当前位置:网站首页>HOW TO ADD P-VALUES TO GGPLOT FACETS
HOW TO ADD P-VALUES TO GGPLOT FACETS
2022-07-02 11:49:00 【Xiaoyu 2022】
library(ggpubr)
library(rstatix)
# Transform `dose` into factor variable
df <- ToothGrowth
df$dose <- as.factor(df$dose)
# Add a random grouping variable
df$group <- factor(rep(c("grp1", "grp2"), 30))
head(df, 3)
stat.test <- df %>%
  group_by(dose) %>%
  t_test(len ~ supp) %>%
  adjust_pvalue(method = "bonferroni") %>%
  add_significance()
# Create a box plot
bxp <- ggboxplot(
  df, x = "supp", y = "len", fill = "#00AFBB",
  facet.by = "dose"
)

# Make facet and add p-values
stat.test <- stat.test %>% add_xy_position(x = "supp")
bxp + stat_pvalue_manual(stat.test)

library(ggpubr)
library(rstatix)
# Transform `dose` into factor variable
df <- ToothGrowth
df$dose <- as.factor(df$dose)
# Add a random grouping variable
df$group <- factor(rep(c("grp1", "grp2"), 30))
head(df, 3)
stat.test <- df %>%
group_by(dose) %>%
t_test(len ~ supp) %>%
adjust_pvalue(method = "bonferroni") %>%
add_significance()
# Create a box plot
bxp <- ggboxplot(
df, x = "supp", y = "len", fill = "#00AFBB",
facet.by = "dose"
)
# Make facet and add p-values
stat.test <- stat.test %>% add_xy_position(x = "supp")
bxp + stat_pvalue_manual(stat.test)
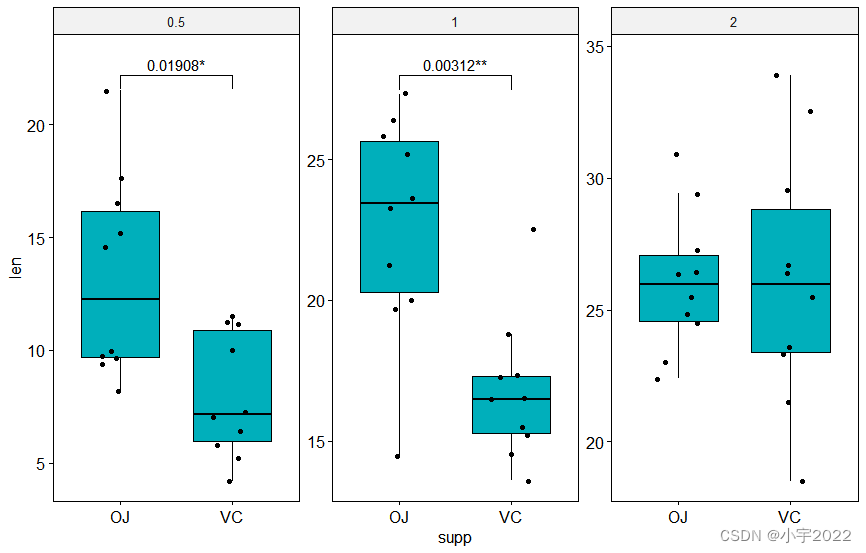
# Make the facet scale free and add jitter points
# Move down the bracket using `bracket.nudge.y`
# Hide ns (non-significant)
# Show adjusted p-values and significance levels
# Add 10% spaces between the p-value labels and the plot border
bxp <- ggboxplot(
df, x = "supp", y = "len", fill = "#00AFBB",
facet.by = "dose", scales = "free", add = "jitter"
)
bxp +
stat_pvalue_manual(
stat.test, bracket.nudge.y = -2, hide.ns = TRUE,
label = "{p.adj}{p.adj.signif}"
) +
scale_y_continuous(expand = expansion(mult = c(0.05, 0.1)))
library(ggpubr)
library(rstatix)
# Transform `dose` into factor variable
df <- ToothGrowth
df$dose <- as.factor(df$dose)
# Add a random grouping variable
df$group <- factor(rep(c("grp1", "grp2"), 30))
head(df, 3)
# Create a bar plot with error bars (mean +/- sd)
bp <- ggbarplot(
  df, x = "supp", y = "len", add = "mean_sd",
  fill = "#00AFBB", facet.by = "dose"
)

# Add p-values onto the bar plots
stat.test <- stat.test %>% add_xy_position(fun = "mean_sd", x = "supp")
bp + stat_pvalue_manual(stat.test)

library(ggpubr)
library(rstatix)
# Transform `dose` into factor variable
df <- ToothGrowth
df$dose <- as.factor(df$dose)
# Add a random grouping variable
df$group <- factor(rep(c("grp1", "grp2"), 30))
head(df, 3)
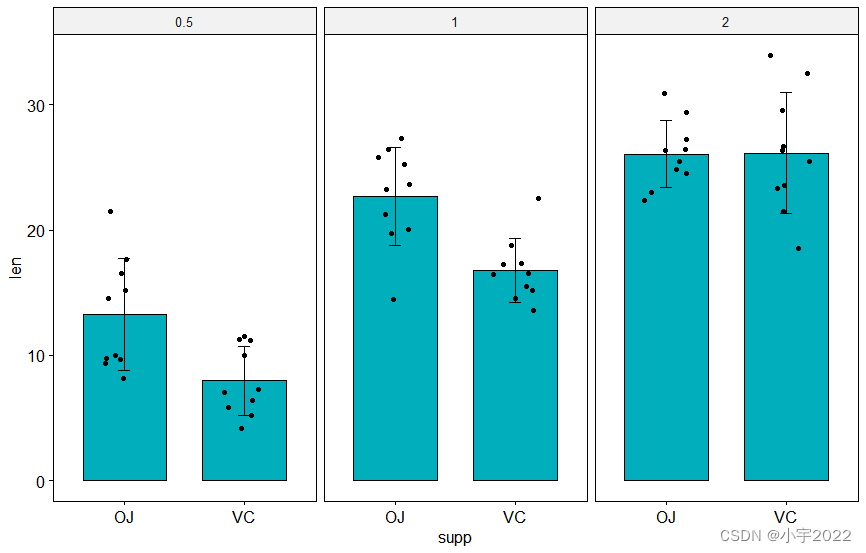
# Create a bar plot with error bars (mean +/- sd)
bp <- ggbarplot(
df, x = "supp", y = "len", add = c("mean_sd", "jitter"),
fill = "#00AFBB", facet.by = "dose"
)
# Add p-values onto the bar plots
stat.test <- stat.test %>% add_xy_position(fun = "max", x = "supp")
bp + stat_pvalue_manual(stat.test)

library(ggpubr)
library(rstatix)
# Transform `dose` into factor variable
df <- ToothGrowth
df$dose <- as.factor(df$dose)
# Add a random grouping variable
df$group <- factor(rep(c("grp1", "grp2"), 30))
head(df, 3)
# Create a bar plot with error bars (mean +/- sd)
bp <- ggbarplot(
df, x = "supp", y = "len", add = c("mean_sd", "jitter"),
fill = "#00AFBB", facet.by = "dose"
)
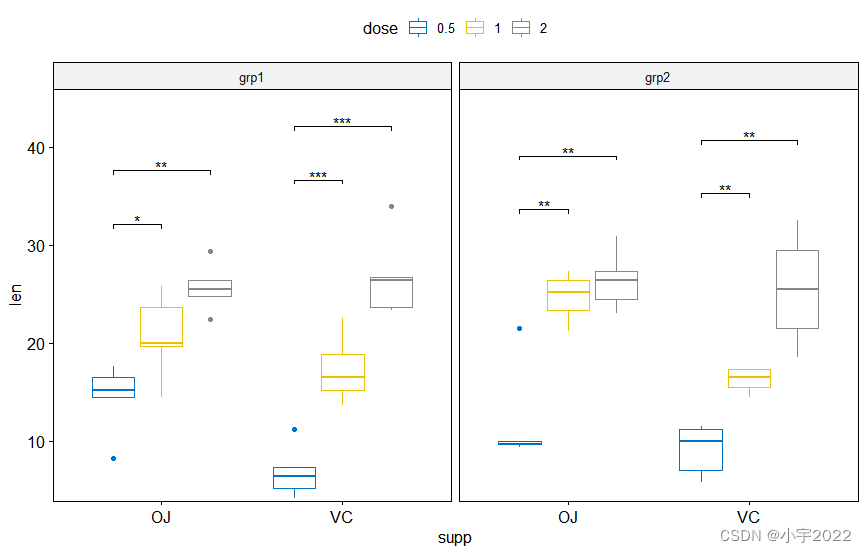
stat.test <- df %>%
group_by(group, dose) %>%
t_test(len ~ supp) %>%
adjust_pvalue(method = "bonferroni") %>%
add_significance()
# Create box plots with significance levels
# Hide ns (non-significant)
stat.test <- stat.test %>% add_xy_position(x = "supp")
ggboxplot(
df, x = "supp", y = "len", fill = "#E7B800",
facet = c("group", "dose")
) +
stat_pvalue_manual(stat.test, hide.ns = TRUE)

library(ggpubr)
library(rstatix)
# Transform `dose` into factor variable
df <- ToothGrowth
df$dose <- as.factor(df$dose)
# Add a random grouping variable
df$group <- factor(rep(c("grp1", "grp2"), 30))
head(df, 3)
# Create a bar plot with error bars (mean +/- sd)
bp <- ggbarplot(
  df, x = "supp", y = "len", add = c("mean_sd", "jitter"),
  fill = "#00AFBB", facet.by = "dose"
)
stat.test <- df %>%
  group_by(group, dose) %>%
  t_test(len ~ supp) %>%
  adjust_pvalue(method = "bonferroni") %>%
  add_significance()
# Create bar plots with significance levels
# Hide ns (non-significant)
stat.test <- stat.test %>% add_xy_position(x = "supp", fun = "mean_sd")
ggbarplot(
  df, x = "supp", y = "len", fill = "#E7B800",
  add = c("mean_sd", "jitter"), facet = c("group", "dose")
) +
  stat_pvalue_manual(stat.test, hide.ns = TRUE)

library(ggpubr)
library(rstatix)
# Transform `dose` into factor variable
df <- ToothGrowth
df$dose <- as.factor(df$dose)
# Add a random grouping variable
df$group <- factor(rep(c("grp1", "grp2"), 30))
head(df, 3)
# Create a bar plot with error bars (mean +/- sd)
bp <- ggbarplot(
df, x = "supp", y = "len", add = c("mean_sd", "jitter"),
fill = "#00AFBB", facet.by = "dose"
)
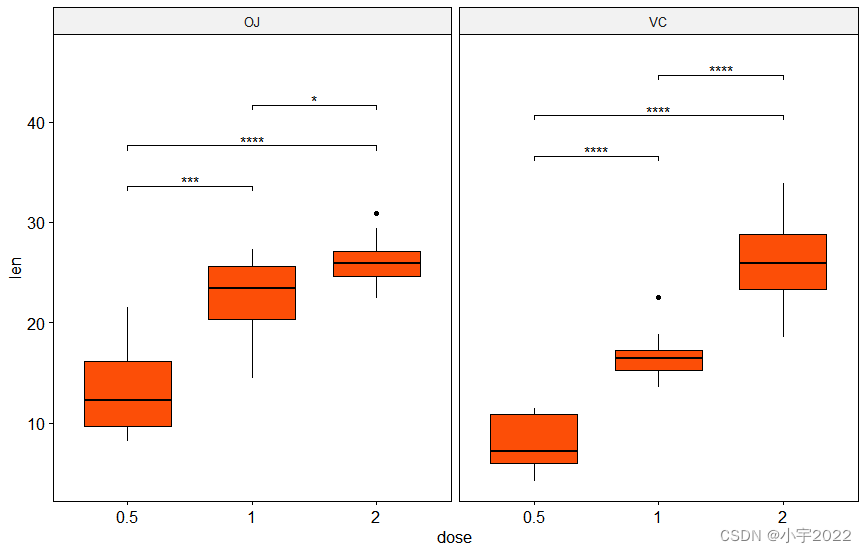
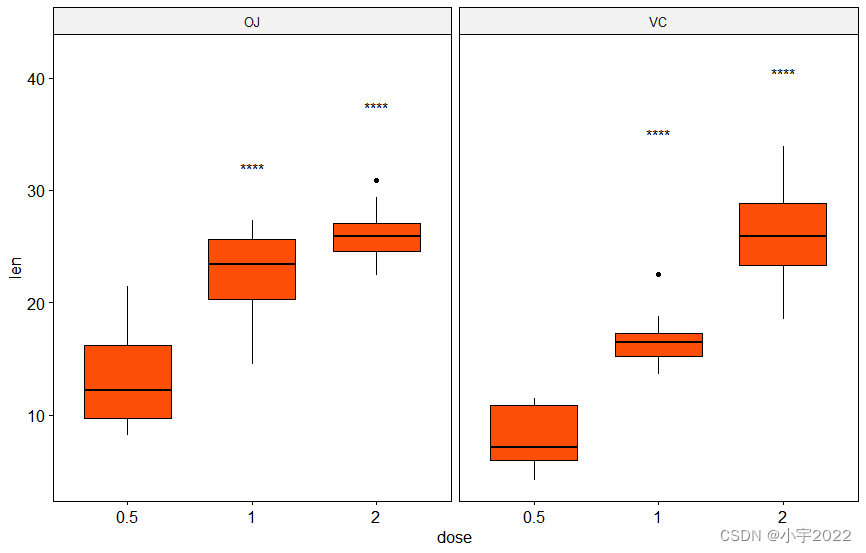
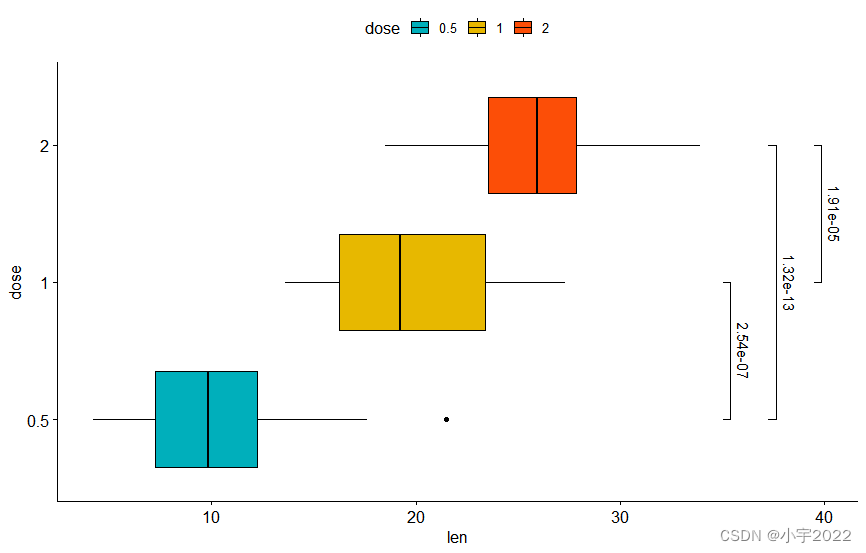
stat.test <- df %>%
group_by(supp) %>%
t_test(len ~ dose)
# Box plots with p-values
stat.test <- stat.test %>% add_y_position()
ggboxplot(df, x = "dose", y = "len", fill = "#FC4E07", facet.by = "supp") +
stat_pvalue_manual(stat.test, label = "p.adj.signif", tip.length = 0.01) +
scale_y_continuous(expand = expansion(mult = c(0.05, 0.1)))
library(ggpubr)
library(rstatix)
# Transform `dose` into factor variable
df <- ToothGrowth
df$dose <- as.factor(df$dose)
# Add a random grouping variable
df$group <- factor(rep(c("grp1", "grp2"), 30))
head(df, 3)
# Create a bar plot with error bars (mean +/- sd)
bp <- ggbarplot(
df, x = "supp", y = "len", add = c("mean_sd", "jitter"),
fill = "#00AFBB", facet.by = "dose"
)
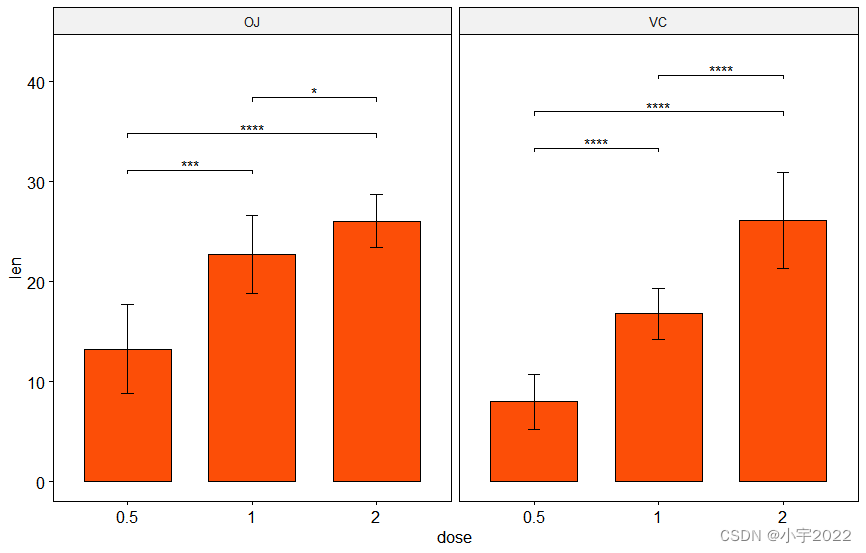
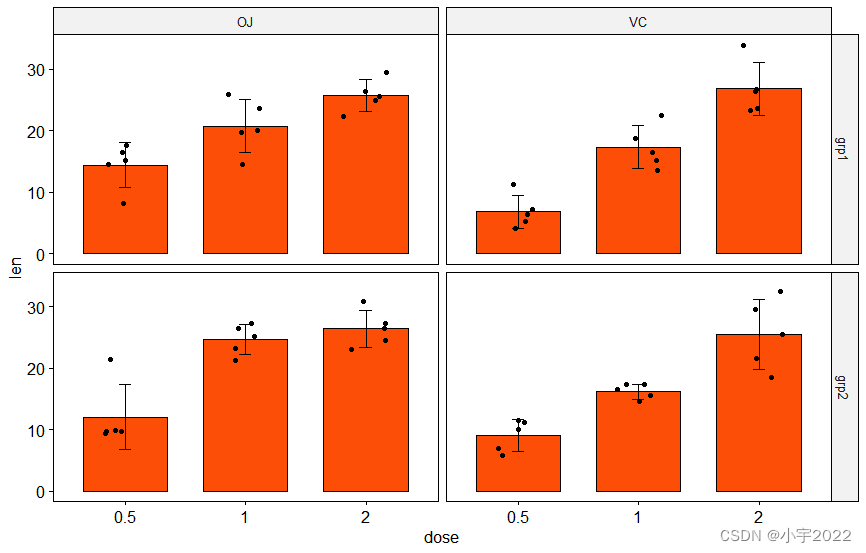
# Bar plot with p-values
# Add 10% space on the y-axis above the box plots
stat.test <- stat.test %>% add_y_position(fun = "mean_sd")
ggbarplot(
df, x = "dose", y = "len", fill = "#FC4E07",
add = "mean_sd", facet.by = "supp"
) +
stat_pvalue_manual(stat.test, label = "p.adj.signif", tip.length = 0.01) +
scale_y_continuous(expand = expansion(mult = c(0.05, 0.1)))
library(ggpubr)
library(rstatix)
# Transform `dose` into factor variable
df <- ToothGrowth
df$dose <- as.factor(df$dose)
# Add a random grouping variable
df$group <- factor(rep(c("grp1", "grp2"), 30))
head(df, 3)
# Create a bar plot with error bars (mean +/- sd)
bp <- ggbarplot(
df, x = "supp", y = "len", add = c("mean_sd", "jitter"),
fill = "#00AFBB", facet.by = "dose"
)
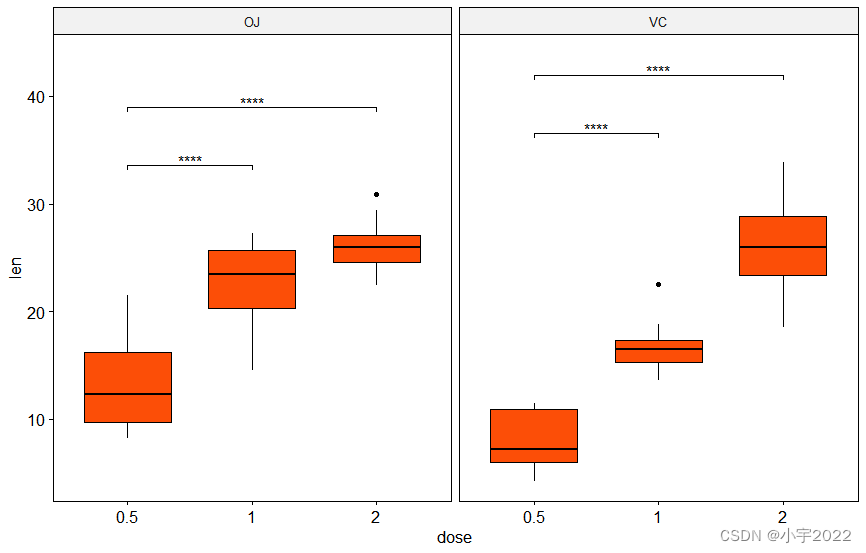
stat.test <- df %>%
group_by(supp) %>%
t_test(len ~ dose, ref.group = "0.5")
# Box plots with p-values
stat.test <- stat.test %>% add_y_position()
ggboxplot(df, x = "dose", y = "len", fill = "#FC4E07", facet.by = "supp") +
stat_pvalue_manual(stat.test, label = "p.adj.signif", tip.length = 0.01) +
scale_y_continuous(expand = expansion(mult = c(0.05, 0.1)))
library(ggpubr)
library(rstatix)
# Transform `dose` into factor variable
df <- ToothGrowth
df$dose <- as.factor(df$dose)
# Add a random grouping variable
df$group <- factor(rep(c("grp1", "grp2"), 30))
head(df, 3)
# Create a bar plot with error bars (mean +/- sd)
bp <- ggbarplot(
  df, x = "supp", y = "len", add = c("mean_sd", "jitter"),
  fill = "#00AFBB", facet.by = "dose"
)
# Show only significance levels at x = group2
# Move down significance symbols using vjust
stat.test <- stat.test %>% add_y_position()
ggboxplot(df, x = "dose", y = "len", fill = "#FC4E07", facet.by = "supp") +
  stat_pvalue_manual(stat.test, label = "p.adj.signif", x = "group2", vjust = 2)
library(ggpubr)
library(rstatix)
# Transform `dose` into factor variable
df <- ToothGrowth
df$dose <- as.factor(df$dose)
# Add a random grouping variable
df$group <- factor(rep(c("grp1", "grp2"), 30))
head(df, 3)
# Create a bar plot with error bars (mean +/- sd)
bp <- ggbarplot(
  df, x = "supp", y = "len", add = c("mean_sd", "jitter"),
  fill = "#00AFBB", facet.by = "dose"
)
# Bar plot with p-values
# Add 10% space on the y-axis above the box plots
stat.test <- stat.test %>% add_y_position(fun = "mean_sd")
ggbarplot(
  df, x = "dose", y = "len", fill = "#FC4E07",
  add = c("mean_sd", "jitter"), facet.by = "supp"
) +
  stat_pvalue_manual(stat.test,  label = "p.adj.signif", tip.length = 0.01) +
  scale_y_continuous(expand = expansion(mult = c(0.05, 0.1)))

library(ggpubr)
library(rstatix)
# Transform `dose` into factor variable
df <- ToothGrowth
df$dose <- as.factor(df$dose)
# Add a random grouping variable
df$group <- factor(rep(c("grp1", "grp2"), 30))
head(df, 3)
# Create a bar plot with error bars (mean +/- sd)
bp <- ggbarplot(
  df, x = "supp", y = "len", add = c("mean_sd", "jitter"),
  fill = "#00AFBB", facet.by = "dose"
)
# Create box plots with significance levels
# Hide ns (non-significant)
# Add 15% space between labels and the plot top border
stat.test <- stat.test %>% add_xy_position(x = "dose")
ggboxplot(
  df, x = "dose", y = "len", fill = "#FC4E07",
  facet = c("group", "supp"),
 )
stat_pvalue_manual(stat.test, hide.ns = TRUE)
scale_y_continuous(expand = expansion(mult = c(0.05, 0.15)))

library(ggpubr)
library(rstatix)
# Transform `dose` into factor variable
df <- ToothGrowth
df$dose <- as.factor(df$dose)
# Add a random grouping variable
df$group <- factor(rep(c("grp1", "grp2"), 30))
head(df, 3)
# Create a bar plot with error bars (mean +/- sd)
bp <- ggbarplot(
  df, x = "supp", y = "len", add = c("mean_sd", "jitter"),
  fill = "#00AFBB", facet.by = "dose"
)
# Create bar plots with significance levels
# Hide ns (non-significant)
# Add 15% space between labels and the plot top border
stat.test <- stat.test %>% add_xy_position(x = "dose", fun = "mean_sd")
ggbarplot(
  df, x = "dose", y = "len", fill = "#FC4E07",
  add = c("mean_sd", "jitter"), facet = c("group", "supp")
)
  stat_pvalue_manual(stat.test, hide.ns = TRUE)
  scale_y_continuous(expand = expansion(mult = c(0.05, 0.15)))
library(ggpubr)
library(rstatix)
# Transform `dose` into factor variable
df <- ToothGrowth
df$dose <- as.factor(df$dose)
# Add a random grouping variable
df$group <- factor(rep(c("grp1", "grp2"), 30))
head(df, 3)
# Create a bar plot with error bars (mean +/- sd)
bp <- ggbarplot(
  df, x = "supp", y = "len", add = c("mean_sd", "jitter"),
  fill = "#00AFBB", facet.by = "dose"
)
# Box plots
bxp <- ggboxplot(
  df, x = "supp", y = "len", color = "dose",
  palette = "jco", facet.by = "group"
)
bxp

library(ggpubr)
library(rstatix)
# Transform `dose` into factor variable
df <- ToothGrowth
df$dose <- as.factor(df$dose)
# Add a random grouping variable
df$group <- factor(rep(c("grp1", "grp2"), 30))
head(df, 3)
# Create a bar plot with error bars (mean +/- sd)
bp <- ggbarplot(
df, x = "supp", y = "len", add = c("mean_sd", "jitter"),
fill = "#00AFBB", facet.by = "dose"
)
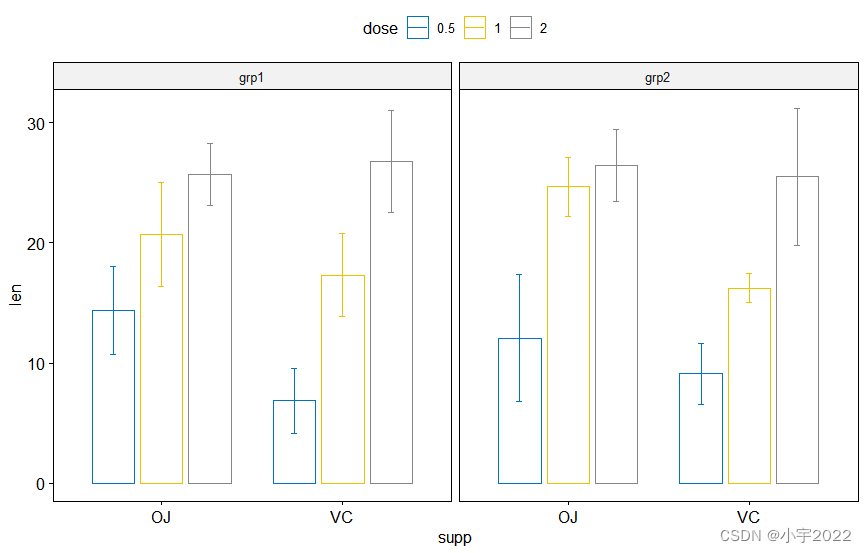
# Bar plots
bp <- ggbarplot(
df, x = "supp", y = "len", color = "dose",
palette = "jco", add = "mean_sd",
position = position_dodge(0.8),
facet.by = "group"
)
bp
library(ggpubr)
library(rstatix)
# Transform `dose` into factor variable
df <- ToothGrowth
df$dose <- as.factor(df$dose)
# Add a random grouping variable
df$group <- factor(rep(c("grp1", "grp2"), 30))
head(df, 3)
# Create a bar plot with error bars (mean +/- sd)
bp <- ggbarplot(
df, x = "supp", y = "len", add = c("mean_sd", "jitter"),
fill = "#00AFBB", facet.by = "dose"
)
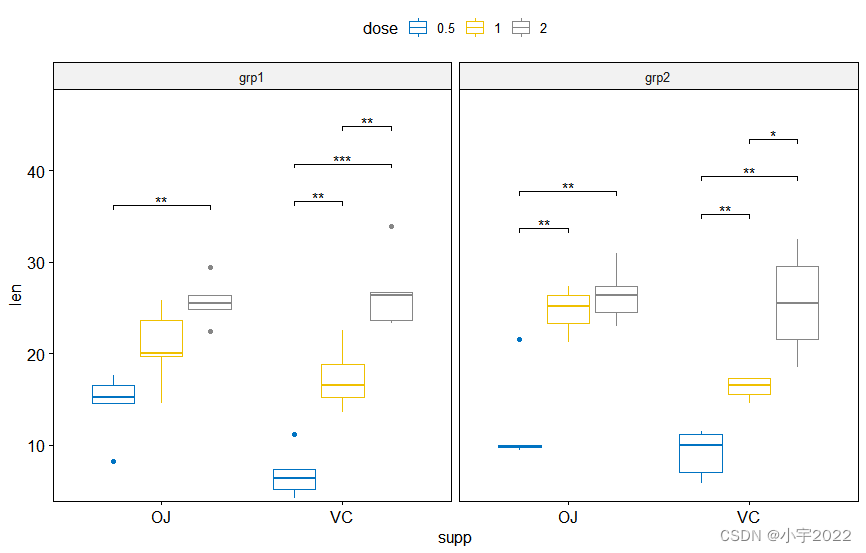
stat.test <- df %>%
group_by(supp, group) %>%
t_test(len ~ dose)
# Box plots with p-values
# Hide ns (non-significant)
stat.test <- stat.test %>%
add_xy_position(x = "supp", dodge = 0.8)
bxp +
stat_pvalue_manual(
stat.test, label = "p.adj.signif", tip.length = 0.01,
hide.ns = TRUE
) +
scale_y_continuous(expand = expansion(mult = c(0.01, 0.1)))
library(ggpubr)
library(rstatix)
# Transform `dose` into factor variable
df <- ToothGrowth
df$dose <- as.factor(df$dose)
# Add a random grouping variable
df$group <- factor(rep(c("grp1", "grp2"), 30))
head(df, 3)
# Create a bar plot with error bars (mean +/- sd)
bp <- ggbarplot(
  df, x = "supp", y = "len", add = c("mean_sd", "jitter"),
  fill = "#00AFBB", facet.by = "dose"
)
# Bar plots with p-values
stat.test <- stat.test %>%
  add_xy_position(x = "supp", fun = "mean_sd", dodge = 0.8)
bp
  stat_pvalue_manual(
    stat.test, label = "p.adj.signif", tip.length = 0.01,
    hide.ns = TRUE
  )
  scale_y_continuous(expand = expansion(mult = c(0.01, 0.1)))
library(ggpubr)
library(rstatix)
# Transform `dose` into factor variable
df <- ToothGrowth
df$dose <- as.factor(df$dose)
# Add a random grouping variable
df$group <- factor(rep(c("grp1", "grp2"), 30))
head(df, 3)
# Create a bar plot with error bars (mean +/- sd)
bp <- ggbarplot(
  df, x = "supp", y = "len", add = c("mean_sd", "jitter"),
  fill = "#00AFBB", facet.by = "dose"
)
stat.test <- df %>%
  group_by(supp, group) %>%
  t_test(len ~ dose, ref.group = "0.5")
stat.test
# Box plots with p-values
stat.test <- stat.test %>%
  add_xy_position(x = "supp", dodge = 0.8)
bxp +
  stat_pvalue_manual(
    stat.test, label = "p.adj.signif", tip.length = 0.01
  ) +
  scale_y_continuous(expand = expansion(mult = c(0.01, 0.1)))
library(ggpubr)
library(rstatix)
# Transform `dose` into factor variable
df <- ToothGrowth
df$dose <- as.factor(df$dose)
# Add a random grouping variable
df$group <- factor(rep(c("grp1", "grp2"), 30))
head(df, 3)
# Create a bar plot with error bars (mean +/- sd)
bp <- ggbarplot(
  df, x = "supp", y = "len", add = c("mean_sd", "jitter"),
  fill = "#00AFBB", facet.by = "dose"
)
stat.test <- df %>%
  group_by(supp, group) %>%
  t_test(len ~ dose, ref.group = "0.5")
stat.test
# Bar plots with p-values
stat.test <- stat.test %>%
  add_xy_position(x = "supp", fun = "mean_sd", dodge = 0.8)
bp
  stat_pvalue_manual(
    stat.test, label = "p.adj.signif", tip.length = 0.01
  )
  scale_y_continuous(expand = expansion(mult = c(0.01, 0.1)))
边栏推荐
- GGHIGHLIGHT: EASY WAY TO HIGHLIGHT A GGPLOT IN R
- bedtools使用教程
- Eight sorting summaries
- Is the Ren domain name valuable? Is it worth investing? What is the application scope of Ren domain name?
- 进入前六!博云在中国云管理软件市场销量排行持续上升
- MySQL comparison operator in problem solving
- Summary of data export methods in powerbi
- Three transparent LED displays that were "crowded" in 2022
- Order by注入
- 制造业数字化转型和精益生产什么关系
猜你喜欢
How to Add P-Values onto Horizontal GGPLOTS

Wechat applet uses Baidu API to achieve plant recognition

Tiktok overseas tiktok: finalizing the final data security agreement with Biden government

GGPUBR: HOW TO ADD ADJUSTED P-VALUES TO A MULTI-PANEL GGPLOT
ESP32 Arduino 引入LVGL 碰到的一些问题

C#多维数组的属性获取方法及操作注意

Digital transformation takes the lead to resume production and work, and online and offline full integration rebuilds business logic

Flesh-dect (media 2021) -- a viewpoint of material decomposition

How to Create a Beautiful Plots in R with Summary Statistics Labels
抖音海外版TikTok:正与拜登政府敲定最终数据安全协议
随机推荐
II Stm32f407 chip GPIO programming, register operation, library function operation and bit segment operation
FLESH-DECT(MedIA 2021)——一个material decomposition的观点
HOW TO ADD P-VALUES ONTO A GROUPED GGPLOT USING THE GGPUBR R PACKAGE
行業的分析
Seriation in R: How to Optimally Order Objects in a Data Matrice
HOW TO ADD P-VALUES TO GGPLOT FACETS
ROS lacks catkin_ pkg
可昇級合約的原理-DelegateCall
Industry analysis
Resources reads 2D texture and converts it to PNG format
A sharp tool for exposing data inconsistencies -- a real-time verification system
微信小程序利用百度api达成植物识别
C # method of obtaining a unique identification number (ID) based on the current time
How to Create a Nice Box and Whisker Plot in R
CTF record
Visualization of chip SEQ data by deeptools
GGPUBR: HOW TO ADD ADJUSTED P-VALUES TO A MULTI-PANEL GGPLOT
基于Hardhat和Openzeppelin开发可升级合约(二)
The position of the first underline selected by the vant tabs component is abnormal
C#基于当前时间,获取唯一识别号(ID)的方法