当前位置:网站首页>QT meter custom control
QT meter custom control
2022-07-02 11:48:00 【Oriental forgetfulness】
Source code
qwidget(paintevent Event implementation ) No more nonsense. The implementation logic is as follows :
	QPainter p(this);
    p.setRenderHint(QPainter::Antialiasing);
    p.translate(width() / 2, height() / 2);
    int anglevalue = 0;
    QPen pen;
    pen.setColor(QColor("#646464A0"));
    pen.setWidth(4);
    p.setPen(pen);
    p.drawEllipse(QPoint(0,0),104,104);
    p.setPen(QColor("#636363"));
    p.drawEllipse(QPoint(0,0),105,105);

    p.setPen(QColor("#636363"));
    p.setBrush(Qt::black);
    p.drawEllipse(QPoint(0,0),100,100);

    p.setPen(QColor("#636363"));
    QLinearGradient lineargradient(0,-100,0,100);
    lineargradient.setColorAt(0,QColor("#FF005600"));
    lineargradient.setColorAt(0.5,QColor("#FF005600"));
    lineargradient.setColorAt(1,QColor("#00005600"));
    lineargradient.setSpread(QGradient::PadSpread);
    QBrush brush = QBrush(lineargradient);
    p.setBrush(brush);
    p.drawEllipse(QPoint(0,0),100,100);

    p.setPen(Qt::red);
    for (int i = 0; i < BigScale; ++i) {

        if (anglevalue < 60 || anglevalue > 120)
        {

            p.drawLine(85,0,100,0);
        }
        double angle = 360.00/BigScale;
        p.rotate(angle);
        anglevalue = anglevalue + angle;
    }

    anglevalue = 0;
    p.setPen(Qt::yellow);
    for (int i = 0; i < ModleScale; ++i) {

        if (anglevalue <= 60 || anglevalue >= 120)
        {

            if (i % 3 != 0)
                p.drawLine(90,0,100,0);
        }
        double angle = 360.00/ModleScale;
        p.rotate(angle);
        anglevalue = anglevalue + angle;
    }

    anglevalue = 0;
    p.setPen(Qt::white);
    for (int i = 0; i < SmallScale; ++i) {

        if (anglevalue < 60 || anglevalue > 120)
        {

            if (i % 5 != 0)
                p.drawLine(95,0,100,0);
        }
        double angle = 360.00/SmallScale;
        p.rotate(angle);
        anglevalue = anglevalue + angle;
    }

    anglevalue = 0;
    p.setPen(Qt::white);
    QStringList list;
    list<<"180"<<"210"<<"240"<<"270"<<"300"<<"330"<<"360"<<"30"<<"60"<<"90"<<"120"<<"150";
    for (int i = 0; i < ModleScale; ++i) {

        if (anglevalue >= 210 || anglevalue <= 150)
        {

            p.drawText(QRect(-8,-85,16,16),Qt::AlignHCenter,list[i]);
        }
        double angle = 360.00/ModleScale;
        p.rotate(angle);
        anglevalue = anglevalue + angle;
    }

    p.save();
    pen.setColor(Qt::gray);
    p.setPen(pen);
    QPoint points[3];
    points[0] = QPoint(-3,0);
    points[1] = QPoint(3,0);
    points[2] = QPoint(0,100);
    if (m_xangle < 30)
        m_xangle = 330;
    else if(m_xangle>330)
        m_xangle = 30;
    p.rotate(m_xangle);
    p.drawConvexPolygon(points,3);
    p.restore();

    QString val = QString("%1km/h").arg(m_xangle);
    pen.setColor(Qt::white);
    p.setPen(pen);
    p.setFont(QFont(" Microsoft YaHei ",12,QFont::Bold,false));
    p.drawText(-50,40,100,40,Qt::AlignHCenter,val);

    // arc
    QConicalGradient conicalGradient(0,0,242);
    conicalGradient.setColorAt(0,QColor("#FFFF0000"));
    conicalGradient.setColorAt(0.5,QColor("#7DFF0000"));
    conicalGradient.setColorAt(0.75,QColor("#FF005600"));
    conicalGradient.setColorAt(1,QColor("#007D5600"));
    conicalGradient.setSpread(QGradient::PadSpread);
    pen = QPen(QBrush(conicalGradient),5);
    p.setPen(pen);
    QRect arcRect = QRect(-110,-110,220,220);
    double startAngle = 240 * 16;
    double spanAngle = -(m_xangle - 30) * 16;
    p.drawArc(arcRect,startAngle,spanAngle);
    qDebug()<<m_xangle;
边栏推荐
- mysql 基本语句
- CTF record
- C # method of obtaining a unique identification number (ID) based on the current time
- vant tabs组件选中第一个下划线位置异常
- CMake交叉编译
- YYGH-10-微信支付
- How to Visualize Missing Data in R using a Heatmap
- Eight sorting summaries
- 6方面带你认识LED软膜屏 LED软膜屏尺寸|价格|安装|应用
- [visual studio 2019] create and import cmake project
猜你喜欢
![[visual studio 2019] create and import cmake project](/img/51/6c2575030c5103aee6c02bec8d5e77.jpg)
[visual studio 2019] create and import cmake project
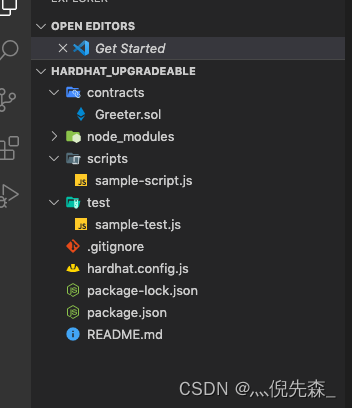
基于Hardhat和Openzeppelin开发可升级合约(一)

GGPUBR: HOW TO ADD ADJUSTED P-VALUES TO A MULTI-PANEL GGPLOT

数据分析 - matplotlib示例代码
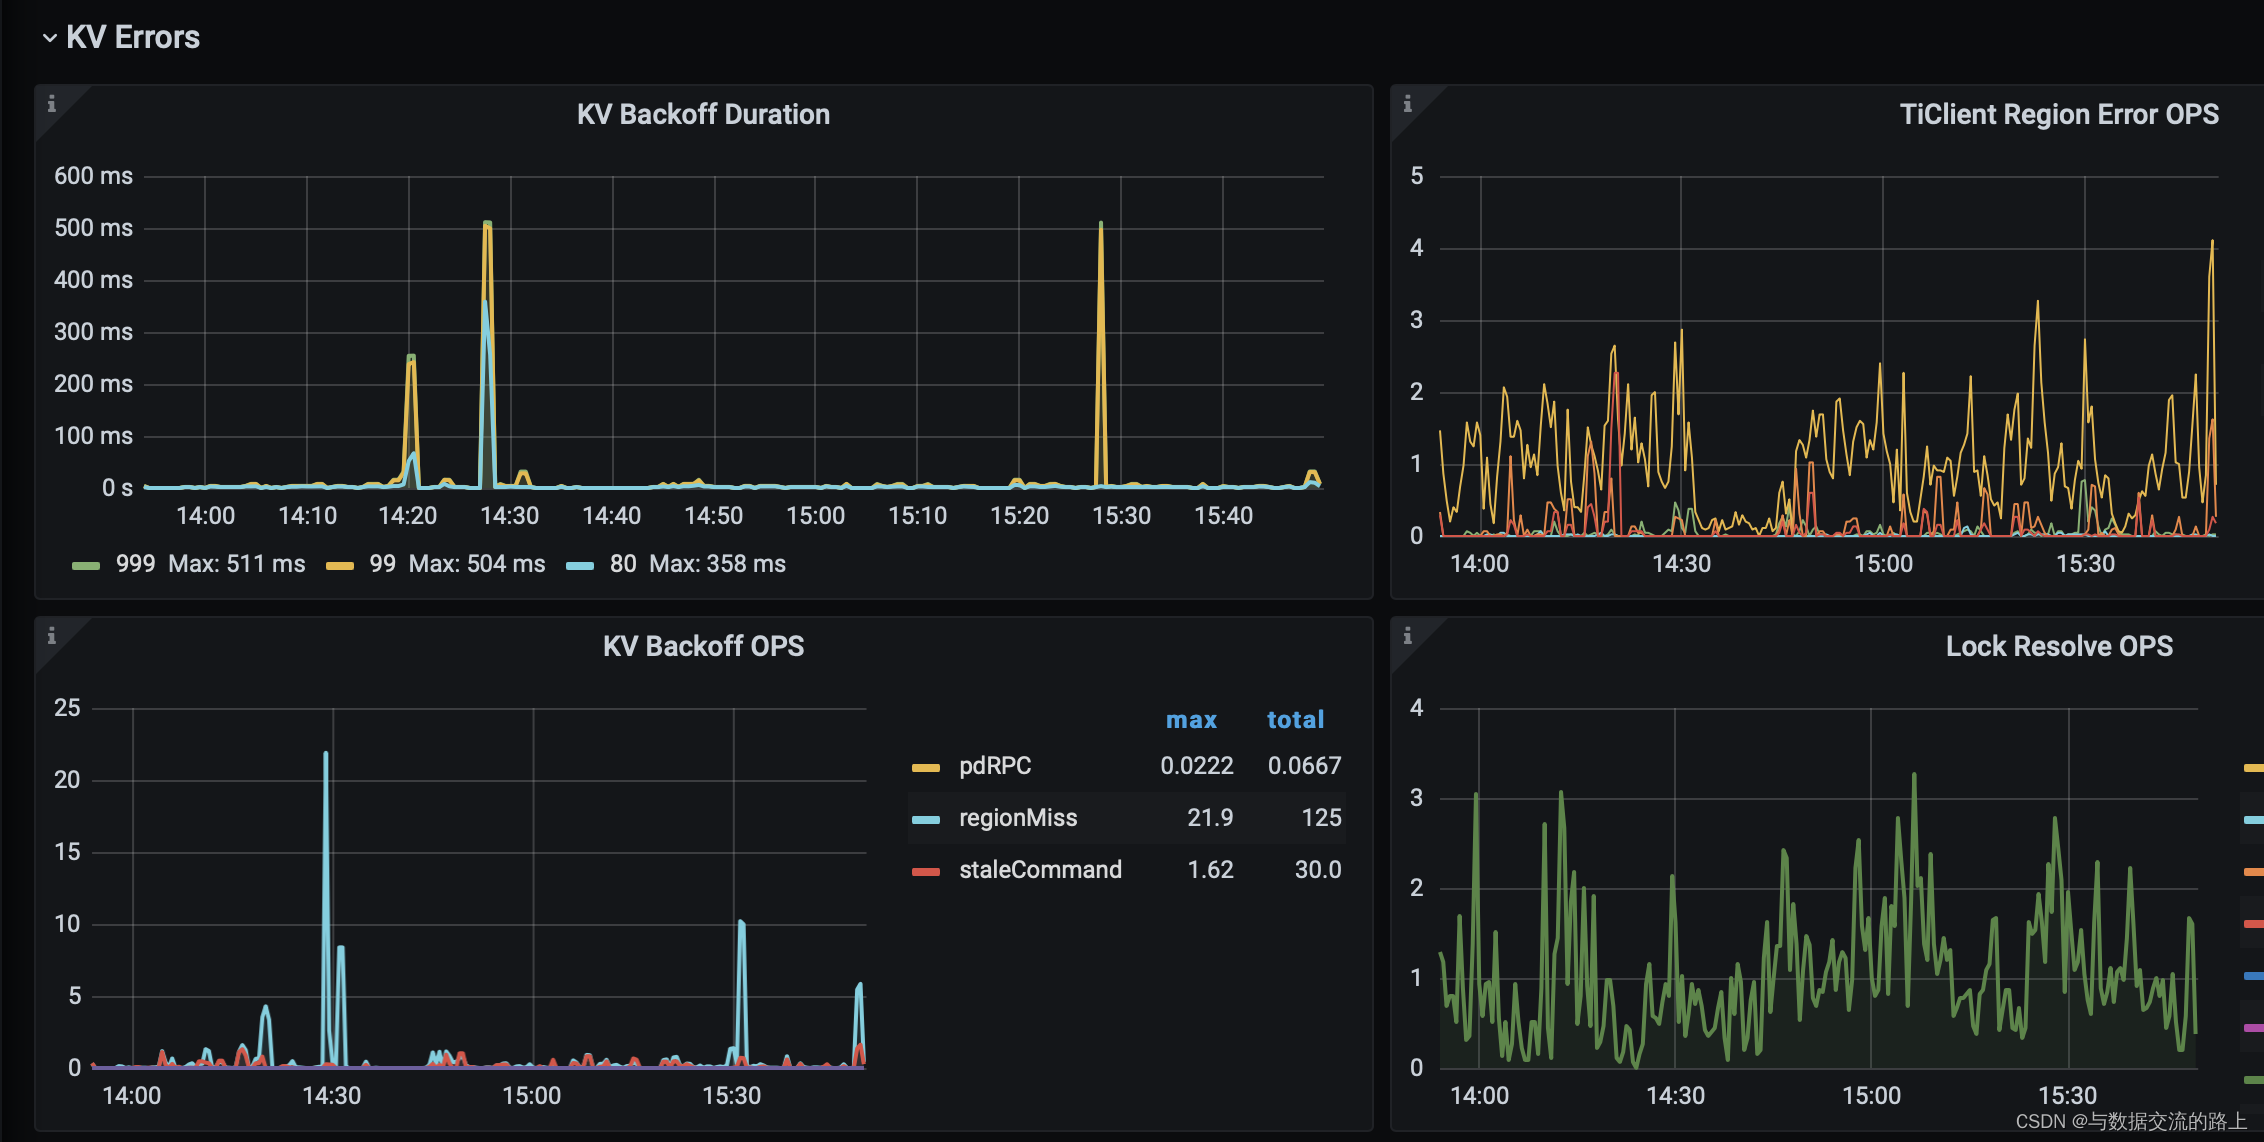
Tidb DM alarm DM_ sync_ process_ exists_ with_ Error troubleshooting

6方面带你认识LED软膜屏 LED软膜屏尺寸|价格|安装|应用
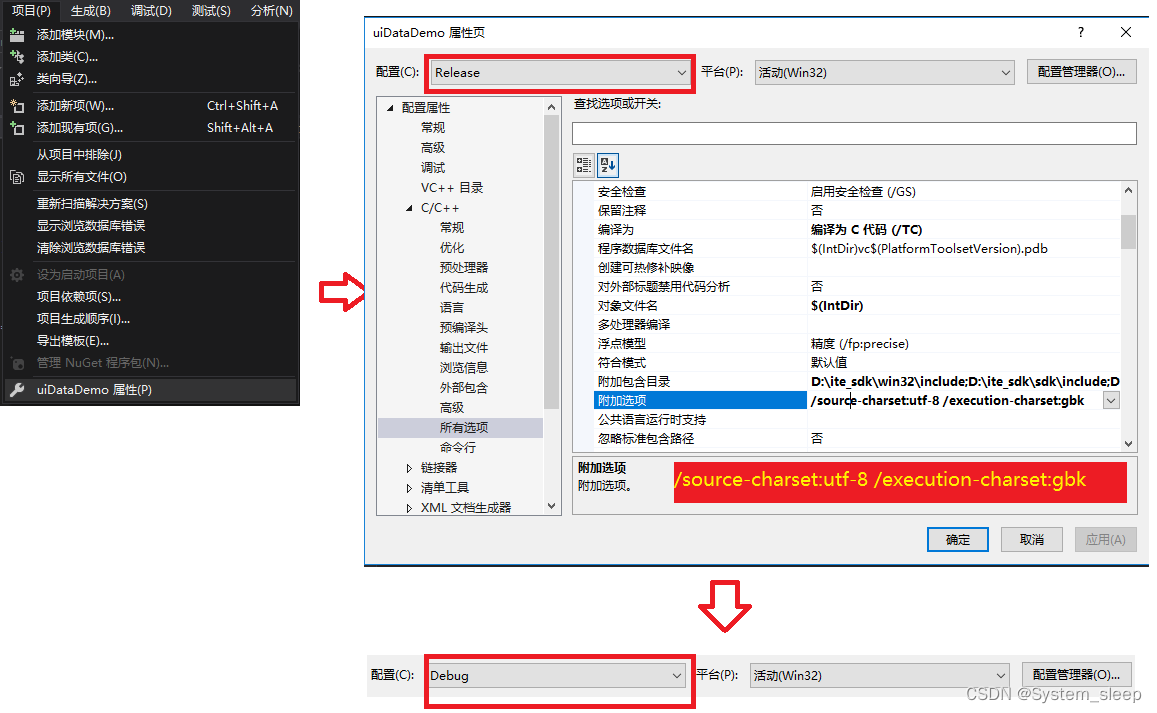
VS2019代码中包含中文内容导致的编译错误和打印输出乱码问题

HOW TO CREATE A BEAUTIFUL INTERACTIVE HEATMAP IN R
A white hole formed by antineutrons produced by particle accelerators

What is the relationship between digital transformation of manufacturing industry and lean production
随机推荐
ren域名有价值吗?值不值得投资?ren域名的应用范围有哪些?
map集合赋值到数据库
通讯录的实现(文件版本)
Seriation in R: How to Optimally Order Objects in a Data Matrice
YYGH-BUG-05
解决uniapp列表快速滑动页面数据空白问题
Tidb DM alarm DM_ sync_ process_ exists_ with_ Error troubleshooting
【2022 ACTF-wp】
Programmer growth Chapter 6: how to choose a company?
JS -- take a number randomly from the array every call, and it cannot be the same as the last time
GGPlot Examples Best Reference
MySQL stored procedure cursor traversal result set
MySQL linked list data storage query sorting problem
Bedtools tutorial
电脑无缘无故黑屏,无法调节亮度。
Always report errors when connecting to MySQL database
Compilation errors and printout garbled problems caused by Chinese content in vs2019 code
How to Create a Nice Box and Whisker Plot in R
数据分析 - matplotlib示例代码
Writing contract test cases based on hardhat