当前位置:网站首页>Example analysis of corrplot related heat map beautification in R language
Example analysis of corrplot related heat map beautification in R language
2022-06-24 19:21:00 【Yisu cloud】
R Language corrplot Example analysis of heat map beautification
This article mainly introduces “R Language corrplot Example analysis of heat map beautification ” Knowledge about , Xiaobian shows you the operation process through practical cases , The operation method is simple and fast , Practical , Hope this article “R Language corrplot Example analysis of heat map beautification ” The article can help you solve problems .
Introduce
R corrplot package Provides a visual exploration tool on the correlation matrix , The tool supports automatic variable reordering , To help detect hidden patterns between variables .
corrplot Very easy to use , And in the visual method 、 Graphic layout 、 Color 、 legend 、 Text labels and other aspects provide a wealth of drawing options . It also provides p Values and confidence intervals , To help users determine the statistical significance of the correlation .
corrplot() There are about 50 Parameters , But the most common parameters are only a few . In most scenes , We can get a correlation matrix with only one line of code .
1. Load package
library(corrplot)
2. Load data
mtcars
3. mapping
corrplot(M, method = 'number')

#order Sorting method original( Default ), Eigenvector angle sorting AOE, The first principal component order FPC, Hierarchical clustering sorting hclust, In alphabetical order alphabetcorrplot(M, method = 'color', order = 'hclust')
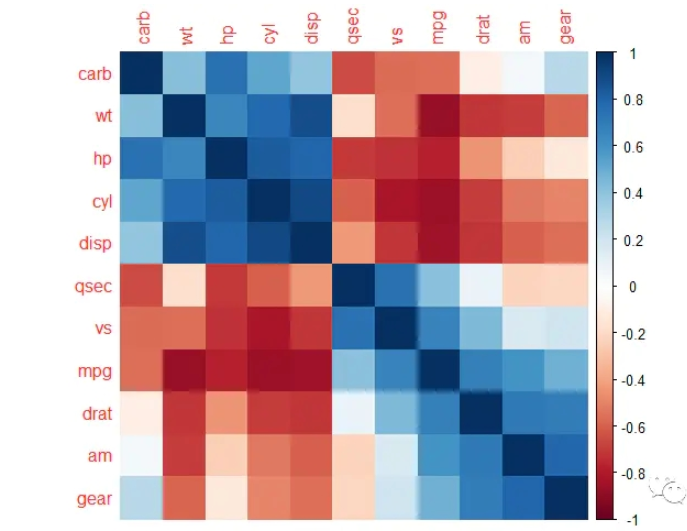
# Shape default circle, In addition to that square,ellipse,number,pie,shade,colorcorrplot(M,method="circle")

corrplot(M,method="square")

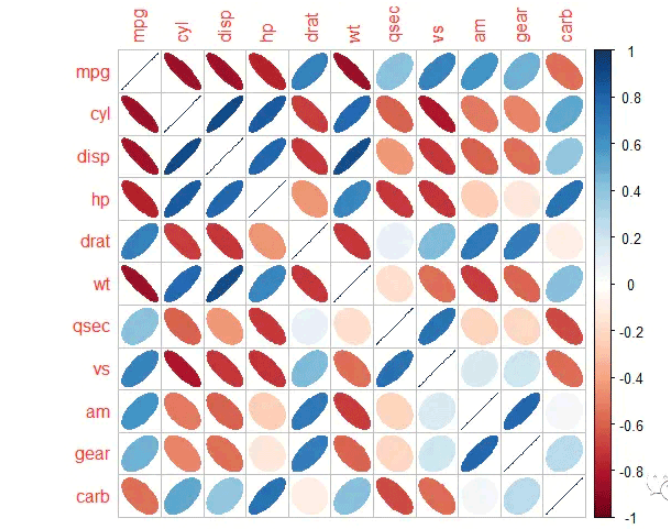
corrplot(M,method="ellipse")
corrplot(M,method="pie")

#diag = FALSE, Do not show... In the middle 1 Lattice of corrplot(M,method="square",diag = FALSE)

#type Show only the lower part of the correlation , In addition, there are parameters full,uppercorrplot(M, method = 'square', order = 'FPC', type = 'lower', diag = FALSE)

corrplot(M, method = 'ellipse', order = 'FPC', type = 'upper', diag = FALSE)

# Mix numbers and graphs corrplot.mixed(M, order = 'AOE')

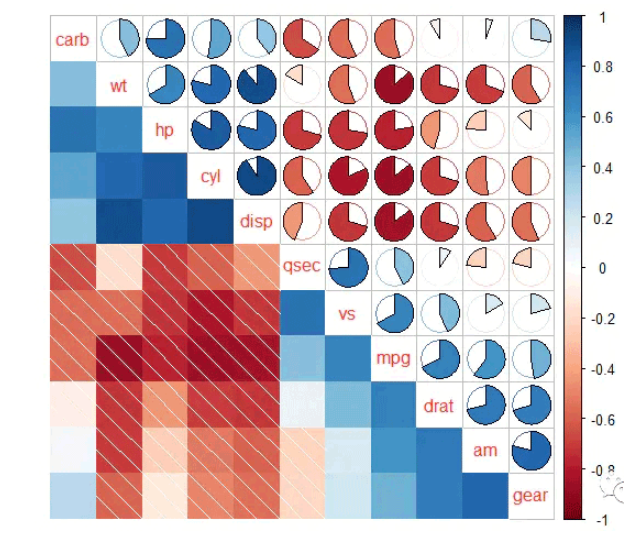
# Mix the upper pie chart , The lower shadow corrplot.mixed(M, lower = 'shade', upper = 'pie', order = 'hclust')
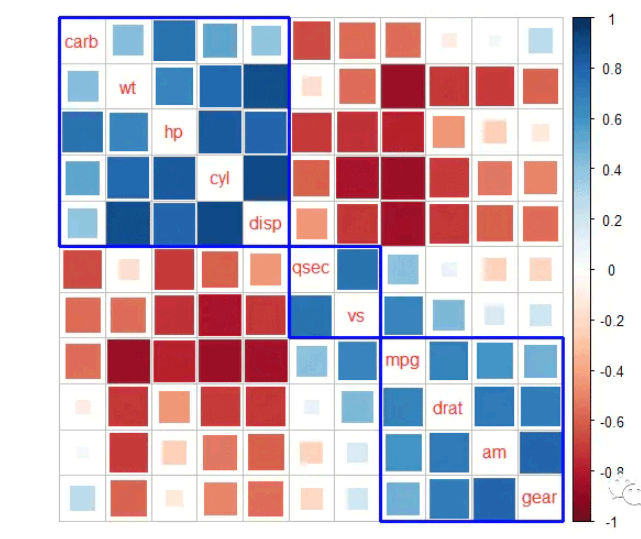
# Hierarchical clustering , Mark out 2 individual clustercorrplot(M, order = 'hclust', addrect = 2)
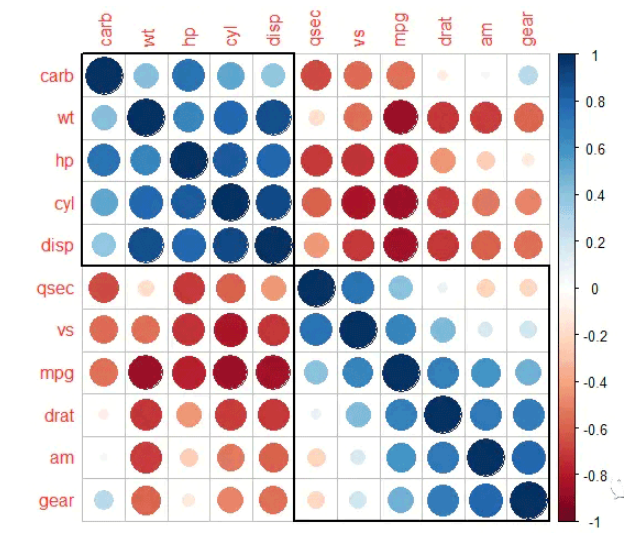
# Define the circled cluster, And the color and line of the loop line corrplot(M, method = 'square', diag = FALSE, order = 'hclust', addrect = 3, rect.col = 'blue', rect.lwd = 3, tl.pos = 'd')
4. Personalize the clustering method
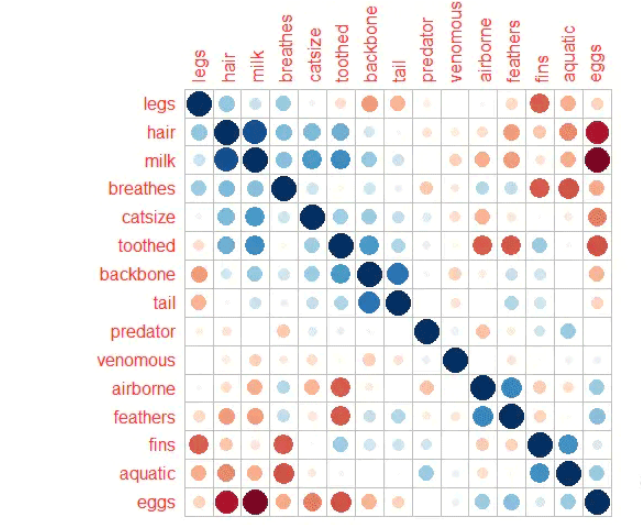
install.packages("seriation")library(seriation)list_seriation_methods('matrix')list_seriation_methods('dist')data(Zoo)Z = cor(Zoo[, -c(15, 17)])dist2order = function(corr, method, ...) { d_corr = as.dist(1 - corr) s = seriate(d_corr, method = method, ...) i = get_order(s) return(i)}# Fast Optimal Leaf Ordering for Hierarchical Clusteringi = dist2order(Z, 'OLO')corrplot(Z[i, i], cl.pos = 'n')
# Quadratic Assignment Problemi = dist2order(Z, 'QAP_2SUM')corrplot(Z[i, i], cl.pos = 'n')
# Multidimensional Scalingi = dist2order(Z, 'MDS_nonmetric')corrplot(Z[i, i], cl.pos = 'n')

5. Add a personalized matrix
library(magrittr)# Method 1i = dist2order(Z, 'R2E')corrplot(Z[i, i], cl.pos = 'n') %>% corrRect(c(1, 9, 15))

# Method 2corrplot(Z, order = 'AOE') %>% corrRect(name = c('tail', 'airborne', 'venomous', 'predator'))
# Method 3 Direct designation r = rbind(c('eggs', 'catsize', 'airborne', 'milk'), c('catsize', 'eggs', 'milk', 'airborne'))corrplot(Z, order = 'hclust') %>% corrRect(namesMat = r)
6. color setting
COL1(sequential = c("Oranges", "Purples", "Reds", "Blues", "Greens", "Greys", "OrRd", "YlOrRd", "YlOrBr", "YlGn"), n = 200)COL2(diverging = c("RdBu", "BrBG", "PiYG", "PRGn", "PuOr", "RdYlBu"), n = 200)#cl.* Parameters are often used in color legends :cl.pos Location of color labels ('r'type='upper''full''b'type='lower''n'),cl.ratio Width recommendations for color legend 0.1~0.2#tl.* Parameters are often used in text legends :tl.pos Location for text labels ,tl.cex Text size ,tl.srt Rotation of text corrplot(M, order = 'AOE', col = COL2('RdBu', 10))
corrplot(M, order = 'AOE', addCoef.col = 'black', tl.pos = 'd', cl.pos = 'r', col = COL2('PiYG'))
corrplot(M, method = 'square', order = 'AOE', addCoef.col = 'black', tl.pos = 'd', cl.pos = 'r', col = COL2('BrBG'))
corrplot(M, order = 'AOE', cl.pos = 'b', tl.pos = 'd',col = COL2('PRGn'), diag = FALSE)
corrplot(M, type = 'lower', order = 'hclust', tl.col = 'black', cl.ratio = 0.2, tl.srt = 45, col = COL2('PuOr', 10))
corrplot(M, order = 'AOE', cl.pos = 'n', tl.pos = 'n', col = c('white', 'black'), bg = 'gold2')
About “R Language corrplot Example analysis of heat map beautification ” That's all for , Thanks for reading . If you want to know more about the industry , You can pay attention to the Yisu cloud industry information channel , Xiaobian will update different knowledge points for you every day .
边栏推荐
- 程序员大部分时间不是写代码,而是。。。
- Does version 2.2.0 support dynamic addition of MySQL synchronization tables
- 初步学习Nuxt3
- Introduction to smart contract security audit delegatecall (2)
- This is not safe
- The group offsets of the Kafka of the Flink SQL. If the specified groupid is not mentioned
- [computer talk club] Lecture 3: how to raise key issues?
- 【Leetcode】旋转系列(数组、矩阵、链表、函数、字符串)
- 1: Mosaic of 100W basic geographic information data
- 假如,程序员面试的时候说真话
猜你喜欢
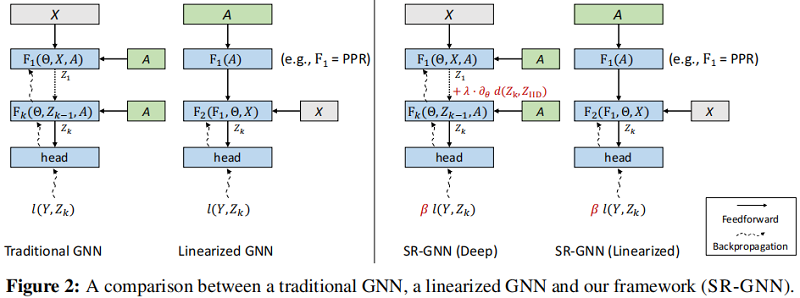
Sr-gnn shift robot gnns: overlapping the limitations of localized graph training data

程序员如何做自媒体?

Spatial simulation model acquisition future land cover tutorial

How to customize cursor position in wechat applet rotation chart

Mqtt protocol usage of LabVIEW

使用阿里云RDS for SQL Server性能洞察优化数据库负载-初识性能洞察
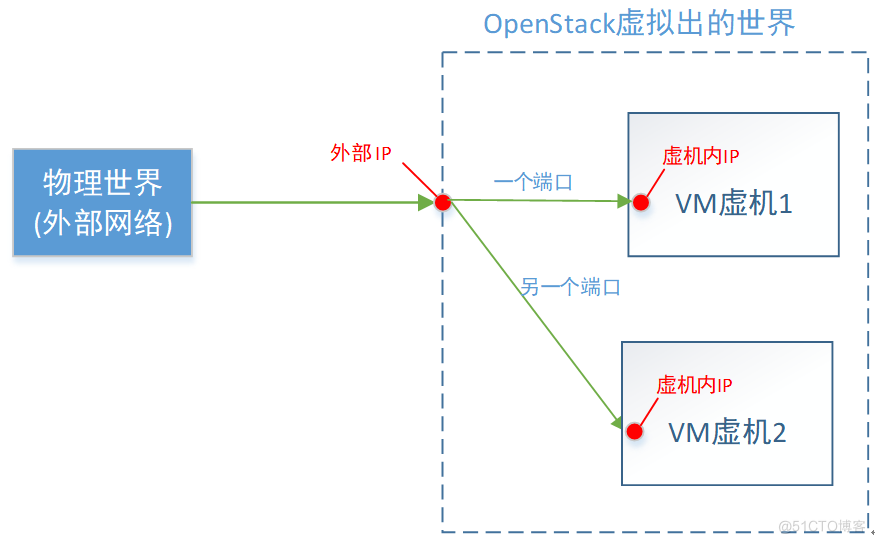
一文理解OpenStack网络

企业网络管理员必备的故障处理系统

Source code analysis of ArrayList

The verifiable certificate of geoscience remote sensing industry
随机推荐
Server lease error in Hong Kong may lead to serious consequences
The sharp sword of API management -- eolink
How to protect biological privacy in the AI era? Overview of the latest "privacy enhancement technology in biometrics" of the Autonomous University of Madrid, comprehensively detailing the biometric p
Remote sensing Forum
Sr-gnn shift robot gnns: overlapping the limitations of localized graph training data
Ask a question. Adbhi supports the retention of 100 databases with the latest IDs. Is this an operation like this
多云模式并非“万能钥匙”
ls 常用参数
Northwestern Polytechnic University attacked by hackers? Two factor authentication changes the situation!
System design idea of time traceability
How to select the ECS type and what to consider?
How to deal with the problem that the Flink CDC reads MySQL in full and always reports this error
假如,程序员面试的时候说真话
IBPS开源表单设计器有什么功能?
请教一个问题。adbhi支持保留一个ID最新100条数据库,类似这样的操作吗
Intel and Microsoft give full play to the potential energy of edge cloud collaboration to promote the large-scale deployment of AI
The script implements the automated deployment of raid0
Experience of MDM master data project implementation for manufacturing projects
Multi segment curve temperature control FB (SCL program) of PLC function block series
Xiaodi class massive data processing business short chain platform