The importance of a journal is self-evident , But I seem to have completely ignored it , What kind of problems often arise , The first time is not to look at the log .
Obviously, I completely ignored its power , take nginx In terms of access logs , The following information can be analyzed from it :
- Response time of the request
- The address and port of the back-end server that the request reaches
- Whether the request has cache configuration
- Request body 、 Request header 、 The size of response body and response head, etc
- Client's IP Address 、UserAgent Etc
- The content of the custom variable
Through this information , You can get the response time-consuming request and the number of requests and concurrency , To analyze the causes of concurrency , This is very important for application level services .
GoAccess What is it?
GoAccess It's an open source Real time network log analyzer and Interactive viewer , Can be in the class Unix Running through a browser or system . —— GoAccess official
Why choose GoAccess?
- because GoAccess It is designed as a terminal based fast log analyzer . Its core idea is to analyze and view in real time Web Server statistics , Instead of using a browser . You can also input it into HTML perhaps CSV、JSON.
- GoAccess You can parse almost anything Web Log format (Apache,Nginx,Amazon S3,Elastic Load Balancing,CloudFront etc. ). Just format the log and run it based on your log .
GoAccess introduction
Yesterday I was using GoAccess when , I stepped into some holes , It led me to think for a time whether this tool existed or not Bug. Because in reading other people's tutorials, they are out of the box .
The following is a detailed description from installation to use .
install GoAccess
Because the operating system of the server is Ubuntu, So here we are Ubuntu For example :
Because not all distributions offer the latest version of GoAccess, So here we use the latest stable version of the official installation method
$ echo "deb http://deb.goaccess.io/ $(lsb_release -cs)main" | sudo tee -a /etc/apt/sources.list.d/goaccess.list
$ wget -O - https://deb.goaccess.io/gnugpg.key | sudo apt-key add -
$ sudo apt-get update
$ sudo apt-get install goaccess
Determine the log format
Installed on the computer GoAccess after , The first thing to do is to determine the log format of the access log , You can set them permanently , You can also pass them on the command line .
Here we use Nginx Of access.log For example
36.113.128.155 - - [28/Apr/2019:02:20:01 +0000] "GET /Manage/Dingdan/fail_index/startTime/2019-04-28+00%3A00%3A00/endTime/2019-04-28+23%3A59%3A59.html HTTP/1.1" 200 7798 "http://www.692213.com/Manage/Dingdan/fail_index/startTime/2019-04-28+00%3A00%3A00/endTime/2019-04-28+23%3A59%3A59.html" "Mozilla/5.0 (Windows NT 10.0; WOW64) AppleWebKit/537.36 (KHTML, like Gecko) Chrome/70.0.3538.110 Safari/537.36" Mode one , To configure .goaccessrc file :
vim ~/.goaccessrc

time-format %T
date-format %d/%b/%Y
log_format %h %^[%d:%t %^] "%r" %s %b "%R" "%u" %^
Mode two , Pass parameters on the command line :
$ goaccess nginx/access.log --log-format='%h %^[%d:%t %^] "%r" %s %b "%R" "%u" %^' --date-format=%d/%b/%Y --time-format=%TBe careful : Whether it's a configuration file or a command line parameter It's not always the same , Just relative to the log format you want to monitor .
function GoAccess
Mode one , adopt -p Parameters , Specify profile .
$ goaccess nginx/access.log -p ~/.goaccessrcMode two , Specify the log format directly in the command line parameter , See the example above for details .
Terminal output
The following tips use the log configuration dialog box of predefined log format for you to choose from , Then the statistics are displayed in real time .
$ goaccess nginx/access.log -c
The third is usually chosen , Common log format (CLF), That's what it looks like after success :

How to operate under the console :
* F1 or h The main help .
* F5 Redraw the main window .
* q Exit procedure , Current window or collapse active module
* o or ENTER Expand the selected module or open a window
* 0-9 And will Shift + 0 The selected module is set to active state
* j Scroll down through the expanded module
* k Scroll up in the extension module
* c Set or change scheme colors
* ^ f Scroll one screen forward in the active module
* ^ b Scroll back one screen in the active module
* TAB Iteration module ( forward )
* SHIFT + TAB Iteration module ( backward )
* s Sorting options for active modules
* / Search all modules ( Allow regular expressions )
* n Find the next place to appear
* g Move to the first item or top of the screen
* G Move to the last item or bottom of the screen
static state HTML Output
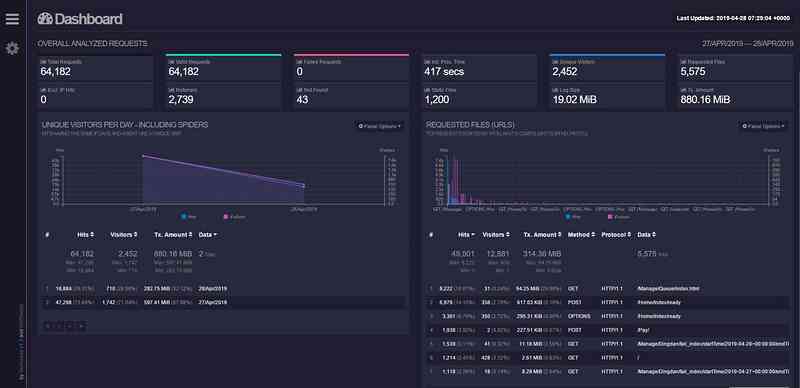
The following content analyzes the access log and static HTML The report shows statistics .
$ goaccess -a -d -f nginx/access.log.1 -p ~/.goaccessrc -o /var/www/report.htmlreal time HTML Output
$ goaccess -a -d -f nginx/access.log.1 -p ~/.goaccessrc -o /var/www/report.html --real-time-htmlThen use the browser to access , That's about it :
Description of configuration file and log format
GoAccess The configuration file is located in %sysconfdir%/goaccess.conf or ~/.goaccessrc
among ,%sysconfdir% yes /etc/,/usr/etc/ or /usr/local/etc/
time-format and date-format The format is usually fixed , Only log-format The format of the log depends on the specific log format .
time-format %T

date-format %d/%b/%Y
log-format Common format description :
* %x Date and time fields that match time format and date format variables . Use when you give a timestamp instead of a date and time in two separate variables .
* %t The time field matches the time format variable .
* %d Date fields that match date format variables .
* %v The server name is set according to the canonical name ( Server block or virtual host ).
* %e This is a HTTP The user ID of the person who requested the document as determined by authentication .
* %hhost( client IP Address ,IPv4 or IPv6)
* %r Request line from client . This requires a specific separator around the request ( Single quotation marks , Double quotation marks, etc ) Analyzable . otherwise , Use special format specifiers , Such as combination %m,%U,%q and %H Parse the fields .
 Be careful : Use or %r Get the complete request OR %m,%U,%q and %H Form your requirements , Don't use... At the same time .
* %m Request method .
* %U Requested URL route .
 Be careful : If the query string is in %U, No need to use %q. however , If URL The path does not contain any query strings , You can use %q And append the query string to the request .
* %q Query string .
* %H Request protocol .
* %s The server sends the status code back to the client .
* %b The size of the object returned to the client .
* %R“Referer”HTTP Request header .
* %u The user agent HTTP Request header .
* %D The time required for the service request , In microseconds .
* %T The time required for the service request , In Milliseconds , The resolution is milliseconds .
* %L  The time taken for the service request , A decimal number in milliseconds .
* %^ Ignore this field .
* %~ Move the log string forward , Until a non space is found (!isspace)char.
* ~h X-Forwarded-For(XFF) Host in the field ( client IP Address ,IPv4 or IPv6).
Common parameters
-f: Specify the log file path to be analyzed-c: Prompt log when program starts / Date configuration window-p: Specify the custom profile to use-d: stay HTML or JSON Enable on output IP Parser-o: Output to the specified extension file (Html、Json、CSV)-a: Enable user agent list by host . For faster resolution of , Please do not enable this flag-d: stay HTML or JSON Enable on output IP Parser .
summary :GoAccess It's very convenient from installation to use , Not only can you analyze historical logs , It can also analyze the log in real time , The supported log format can basically meet most application scenarios .
Reference link
- GoAccess Official website
- GoAccess introduction
- Use GoAccess analysis Nginx journal
- take Nginx log_format Convert to goaccess The configuration file
- GoAccess Log format conversion case 1
- GoAccess Log format conversion case 2
- GoAccess Log format conversion case 3
- GoAccess Log format conversion case 4