当前位置:网站首页>Drawing with MATLAB (1)
Drawing with MATLAB (1)
2022-06-26 08:46:00 【NBb-666】
figure(1)

% parabola
s = 7;
u =-s:.1:s;
v =-s:.1:s;
[x,y] = meshgrid(u,v);
z = (x.^2 + y.^2)/5;
surf(x,y,z,'FaceAlpha',0.5,'EdgeColor','none','FaceColor',[.9 .9 .9]);

% torus
hold on
for i = 2:6

    r = .2;
    R = i;
    [t,p] = meshgrid(linspace(0,2*pi,512));
    x = r*cos(t).*cos(p) + R*cos(p);
    y = r*cos(t).*sin(p) + R*sin(p);
    z = r*sin(t) + R.^2/5;
    surf(x,y,z,'EdgeColor','none','FaceColor','r');

end

axis equal off

% camera setttings
campos([60 130 40])
camtarget([0 0 10])
camlight('headlight')
camzoom(1.3)
camproj('perspective')

边栏推荐
- keras_ Callback function summary
- torch. fft
- How to use leetcode
- VS2005 project call free() compiled with static libcurl library reported heap error
- opencv学习笔记三
- Analysis of Yolo series principle
- STM32 project design: temperature, humidity and air quality alarm, sharing source code and PCB
- Cause analysis of serial communication overshoot and method of termination
- Bezier curve learning
- HEVC学习之码流分析
猜你喜欢

Line detection_ nanyangjx

Installation of jupyter
2020-10-17

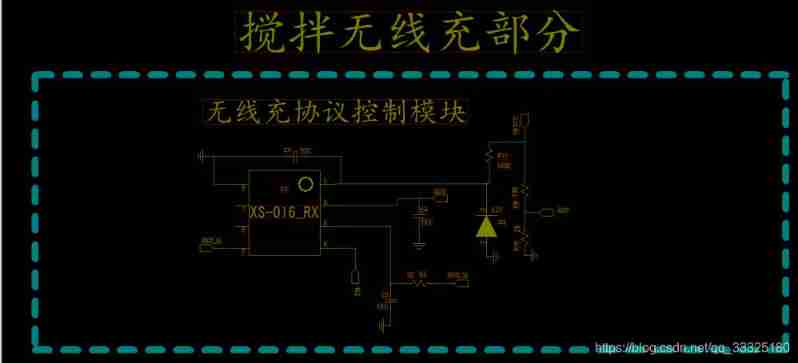
What is Qi certification Qi certification process

Exploration of webots and ROS joint simulation (I): software installation

Compiling owncloud client on win10
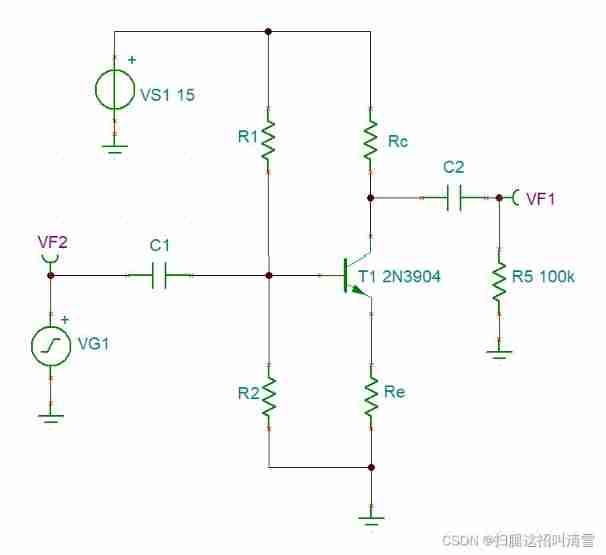
Design of reverse five times voltage amplifier circuit
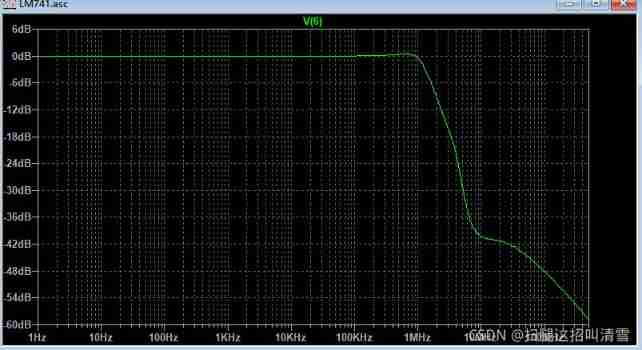
Analysis of internal circuit of operational amplifier

Discrete device ~ diode triode
Jupyter的安装
随机推荐
Relationship extraction -- casrel
Mapping '/var/mobile/Library/Caches/com. apple. keyboards/images/tmp. gcyBAl37' failed: 'Invalid argume
OpenGL display mat image
Leetcode notes: binary search simple advanced
Whale conference provides digital upgrade scheme for the event site
opencv学习笔记三
keras_ Callback function summary
golang json unsupported value: NaN 处理
Software engineering - personal assignment - question review and personal summary
软件工程-个人作业-提问回顾与个人总结
How to Use Instruments in Xcode
Learning signal integrity from scratch (SIPI) -- 3 challenges faced by Si and Si based design methods
OpenCV Learning notes iii
Assembly led on
Swift code implements method calls
pgsql_ UDF01_ jx
What are the conditions for Mitsubishi PLC to realize Ethernet wireless communication?
STM32 encountered problems using encoder module (library function version)
Tokenizer description in Bert
多台三菱PLC如何实现无线以太网高速通讯?