当前位置:网站首页>Perf simple process for multithreaded profile
Perf simple process for multithreaded profile
2022-07-04 04:04:00 【BanFS】
Background knowledge
Perf It is a tool for software performance analysis , adopt Perf, Applications can take advantage of PMU,tracepoint And special counters in the kernel for performance statistics .Perf It can not only analyze the performance problems of applications (per thread), You can also analyze the performance problems of the kernel , Handle all performance related events : Hardware events during program operation , Such as instructions retired ,processor clock cycles etc. ; Software events , Such as Page Fault And process switching .
Perf The basic principle is to sample the monitored object , The simplest case is based on tick Interrupt sampling , That is to say tick Trigger sampling point in interrupt , Determine the current context of the program at the sampling point . Suppose a program 90% All the time spent on the function func1() On , that 90% All of the sampling points should fall in the function func1() In the context of , The longer the sampling time is , The more reliable the above inference is . Use perf Have administrator privileges
Use perf Multithreading profile
Prepare multithreaded program
In this program , Two threads were created . Ran different times func1() Method .gcc -lpthread main.c
#include <pthread.h>
#include <stdio.h>
#include <string.h>

pthread_t thread[2];

void func1() {

    int i = 0;
    while (i<10000)
        ++i;
}

void func2() {

    int i = 0;

    while (i<10000)
        i = i*2;
    func1();
}

void *thread1()
{

        for (;;)
        {

            func1();
        }

        pthread_exit(NULL);
}

void *thread2()
{

        for (;;)
        {

            func2();
        }

        pthread_exit(NULL);
}

void thread_create(void)
{

        int temp;
        memset(&thread, 0, sizeof(thread));
        if((temp = pthread_create(&thread[0], NULL, thread1, NULL)) != 0)
                printf(" Threads 1 Create failure !\n");
        else
                printf(" Threads 1 Be created \n");

        if((temp = pthread_create(&thread[1], NULL, thread2, NULL)) != 0)
                printf(" Threads 2 Create failure \n");
        else
                printf(" Threads 2 Be created \n");
}


int main()
{

        thread_create();
        pthread_join(thread[0],NULL);
        printf(" Threads 1 Join in ");
        pthread_join(thread[1],NULL);
        printf(" Threads 2 Join in ");

        return 0;
}
Use perf Sample the program
For the program that hasn't been started
[email protected]:/home/banfushen/perf_cpu/multi_thread# perf record -h
Usage: perf record [<options>] [<command>]
    or: perf record [<options>] -- <command> [<options>]

    ...
    -F, --freq <n>        profile at this frequency
    -g                    enables call-graph recording
    -p, --pid <pid>       record events on existing process id
    -t, --tid <tid>       record events on existing thread id
    ...
perf record -g -F 99 ./a.out, Sampling multithreaded programs , sampling frequency 99,(-F 99: sample at 99 Hertz (samples per second). I’ll sometimes sample faster than this (up to 999 Hertz), but that also costs overhead. 99 Hertz should be negligible. Also, the value ‘99’ and not ‘100’ is to avoid lockstep sampling, which can produce skewed results.). After running, you will get a perf.data, To get the flame diagram , Other tools are needed .
For the program that has been started
For programs that have been started , To get pid,perf record -g -F 99 -p <pid>
Download tool FlameGraph
git clone https://github.com/brendangregg/FlameGraph.git
[email protected]:~/perf_cpu/FlameGraph$ pwd
/home/banfushen/perf_cpu/FlameGraph
Generate flame chart
Yes perf.data Generate flame chart ( According to the above, it is a process )
perf script |/home/banfushen/perf_cpu/FlameGraph/stackcollapse-perf.pl|/home/banfushen/perf_cpu/FlameGraph/flamegraph.pl > output.svg![[ Failed to transfer the external chain picture , The origin station may have anti-theft chain mechanism , It is suggested to save the pictures and upload them directly (img-68Nci8QI-1644756192593)(_v_images/20211214172626556_19376.png)]](/img/9a/4b8b620164dfd1697b1bbf03044e51.jpg)
Generate a flame diagram for a single thread
You know, threads id
[email protected]:/home/banfushen/perf_cpu/multi_thread# perf script -h

 Usage: perf script [<options>]
    or: perf script [<options>] record <script> [<record-options>] <command>
    or: perf script [<options>] report <script> [script-args]
    or: perf script [<options>] <script> [<record-options>] <command>
    or: perf script [<options>] <top-script> [script-args]

    ...
    -v, --verbose         be more verbose (show symbol address, etc)
        --pid <pid[,pid...]>
        --tid <tid[,tid...]>
                          only consider symbols in these tids
perf script -v --tid <tid> Specified thread perf script -v --tid 2283471|/home/banfushen/perf_cpu/FlameGraph/stackcollapse-perf.pl|/home/banfushen/perf_cpu/FlameGraph/flamegraph.pl > output1.svg![[ Failed to transfer the external chain picture , The origin station may have anti-theft chain mechanism , It is suggested to save the pictures and upload them directly (img-UAKuRRSC-1644756192594)(_v_images/20211214172949738_20703.png)]](/img/3a/efd6efcab3be126d9b2bea028c1f43.jpg)
Generate a flame diagram for multiple threads
perf script -v --tid <tid[,tid...]> Specify multiple threads perf script -v --tid 2283472,2283471|/home/banfushen/perf_cpu/FlameGraph/stackcollapse-perf.pl|/home/banfushen/perf_cpu/FlameGraph/flamegraph.pl > output3.svg![[ Failed to transfer the external chain picture , The origin station may have anti-theft chain mechanism , It is suggested to save the pictures and upload them directly (img-y7qrS028-1644756192595)(_v_images/20211214173120899_8466.png)]](/img/e6/c3c01067801a09ddc443ddb161ab0d.jpg)
Reference material :
perf Examples
perf Performance analysis
Performance analysis tool perf elementary analysis
utilize perf analyse Linux Applications
Linux Performance analysis tool Perf brief introduction
边栏推荐
- The three-year revenue is 3.531 billion, and this Jiangxi old watch is going to IPO
- JSON string conversion in unity
- 【华为云IoT】读书笔记之《万物互联:物联网核心技术与安全》第3章(上)
- 投资深度思考
- EV6 helps the product matrix, and Kia is making efforts in the high-end market. The global sales target in 2022 is 3.15 million?
- 思考的小记录
- Leetcode51.n queen
- Typical applications of minimum spanning tree
- Session learning diary 1
- “软硬皆施”,助力建成新型云计算数据中心
猜你喜欢
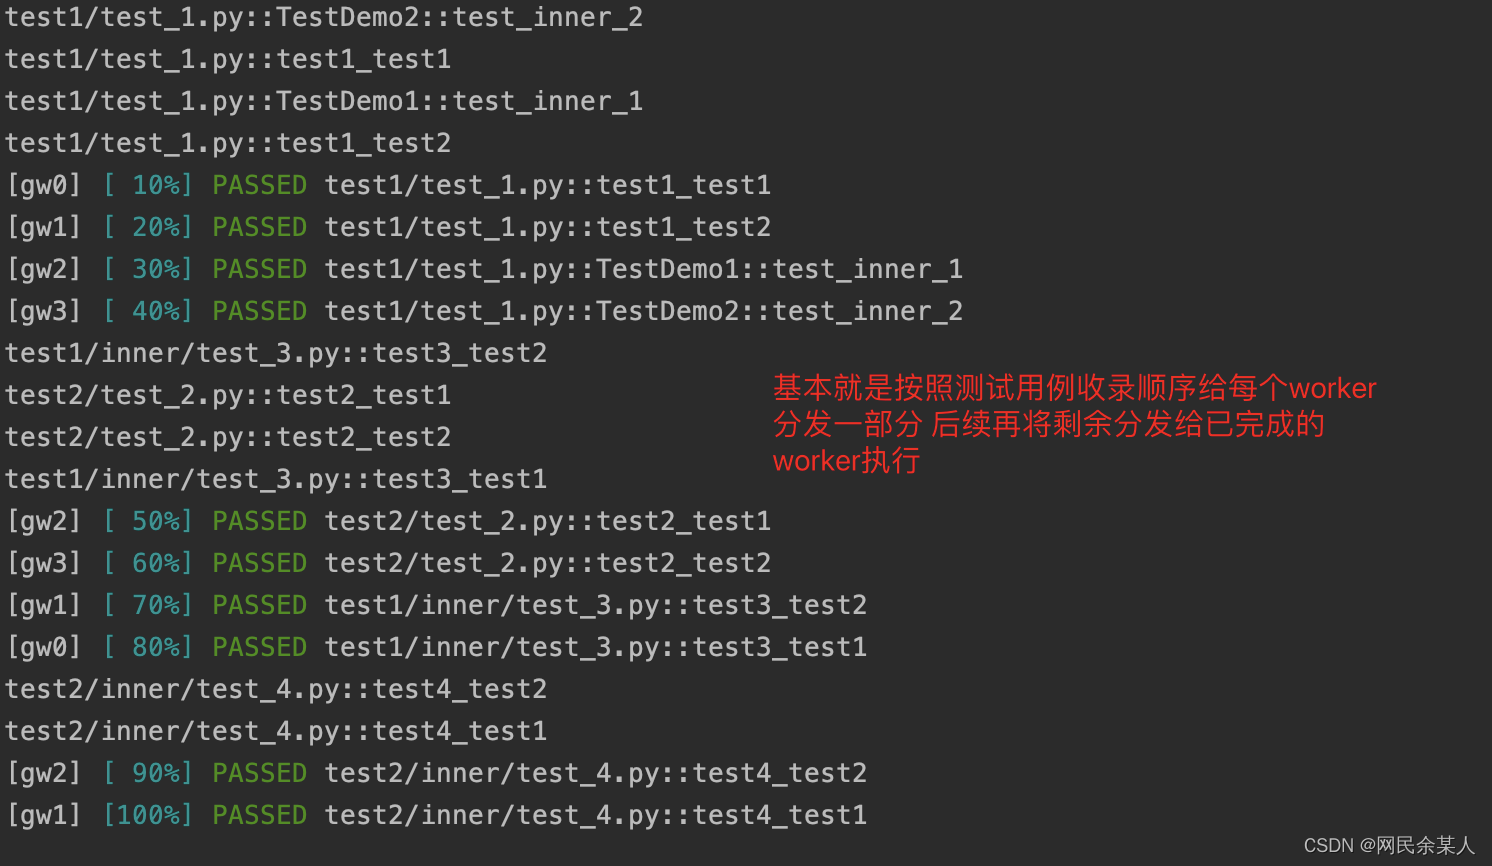
Pytest multi process / multi thread execution test case
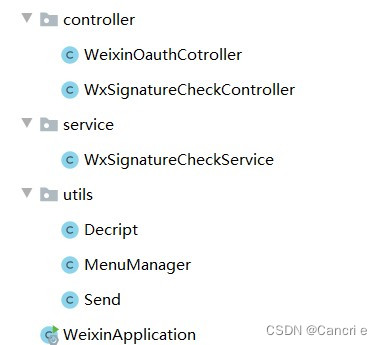
Wechat official account web page authorization
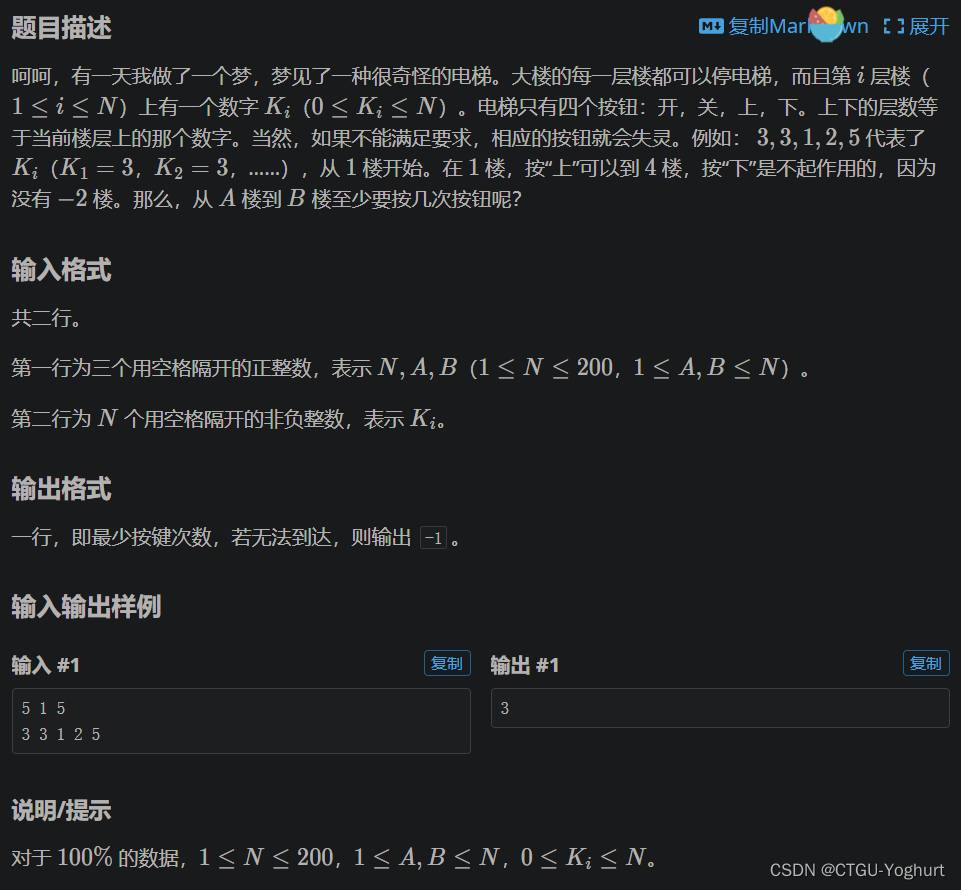
深度优先搜索简要讲解(附带基础题)
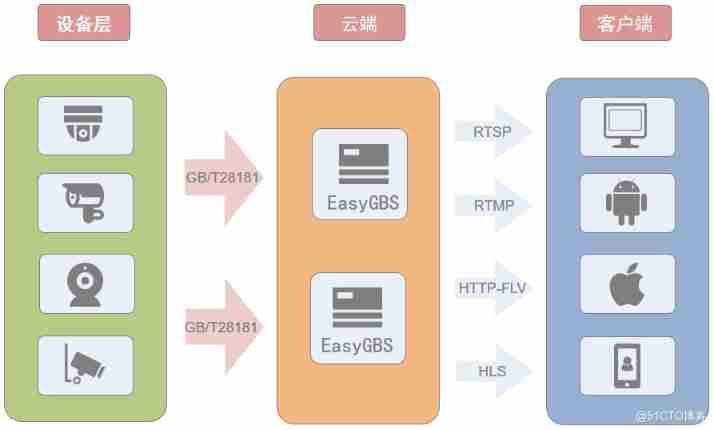
National standard gb28181 protocol platform easygbs fails to start after replacing MySQL database. How to deal with it?
![[untitled]](/img/b5/bf76783aa428222623d760756a14d9.jpg)
[untitled]
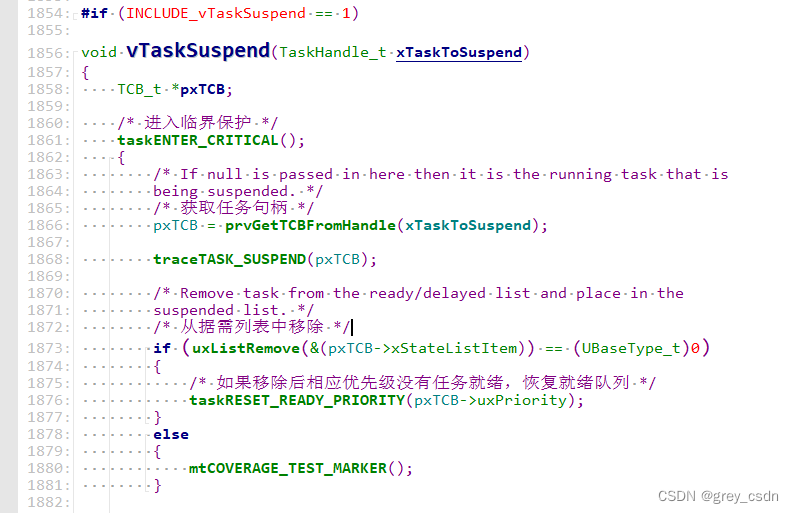
1289_FreeRTOS中vTaskSuspend()接口实现分析

Two sides of the evening: tell me about the bloom filter and cuckoo filter? Application scenario? I'm confused..

The maximum expiration time of client secret in azure ad application registration is modified to 2 years
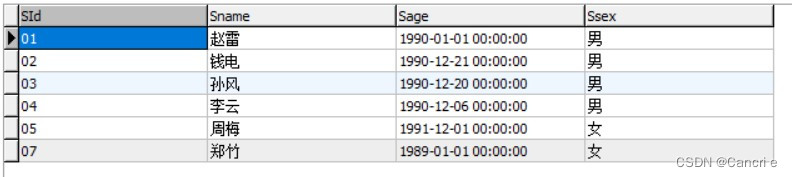
SQL statement strengthening exercise (MySQL 8.0 as an example)
There is a problem that the package cannot be parsed in the like project
随机推荐
Introduction to asynchronous task capability of function calculation - task trigger de duplication
MySQL maxscale realizes read-write separation
Katalon中控件的参数化
vim正确加区间注释
[PaddleSeg 源码阅读] PaddleSeg计算Dice
pytest多进程/多线程执行测试用例
渗透实战-guest账户-mimikatz-向日葵-sql提权-离线解密
Database SQL statement summary, continuous update
How about the ratings of 2022 Spring Festival Gala in all provinces? Map analysis helps you show clearly!
[untitled]
“软硬皆施”,助力建成新型云计算数据中心
Illustrated network: what is the hot backup router protocol HSRP?
思考的小记录
Why is it recommended that technologists write blogs?
JSON string conversion in unity
【webrtc】m98 ninja 构建和编译指令
[book club issue 13] packaging format of video files
微信公众号网页授权
How to dynamically cache components in Vue multi-level route nesting
图解网络:什么是热备份路由器协议HSRP?