当前位置:网站首页>Two commonly used graphics can easily realize data display
Two commonly used graphics can easily realize data display
2022-07-04 04:05:00 【Desai wisdom number】
At present, we are keen to use various charts to do Report data processing , among Broken line diagram , The histogram is the basic graph for collecting various data , It can help us solve all kinds of problems easily Data report analysis Provide efficiency .
How to use these basic figures flexibly , It is a necessary skill in our work , Let's take a look at How to use the positive and negative line chart and positive and negative histogram in the visualization platform .
First enter the platform , After creating a new project and page , Find the line chart , Drag the component to the appropriate location . Then check the property settings , You can find Positive and negative line graph 【 Positive and negative display 】 Is turned on by default , If shut down , The positive and negative line graph will become the basic line graph . Under layer parameters, you can also view other corresponding function switch settings .
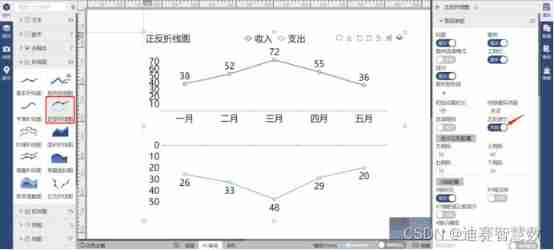

And of course You can modify the chart type as needed . Take the positive and negative line chart as an example , The chart type can be displayed by line chart and column chart . As shown in the figure below, there are both line charts and bar charts , It can meet the display needs of various data .
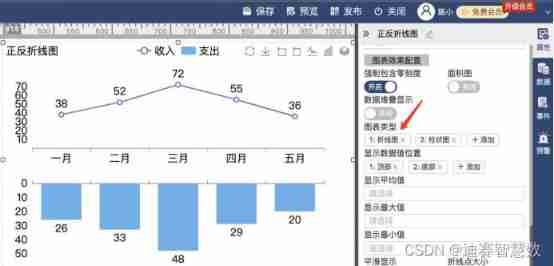
Set both positive and negative groups as histogram , It is the positive and negative histogram . You can also find the positive and negative histogram in the histogram component and drag it directly .
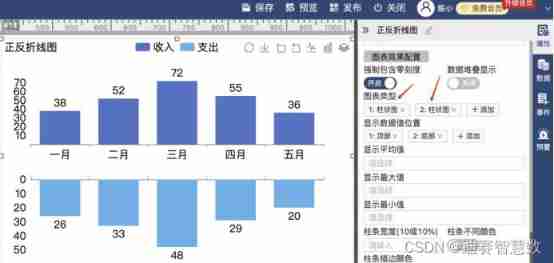
You can set each column bar to a different color , And set the stroke color of the column bar , The whole chart is more gorgeous .
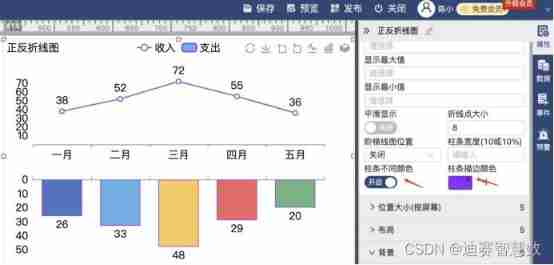
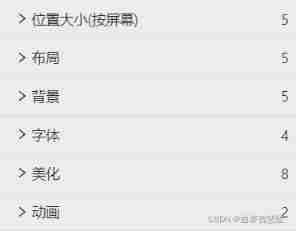
Other attribute functions , For example, location size 、 Layout 、 Background, etc , Configure according to the design requirements .
Let's see how the data is configured . Click data... In the right edit bar , You can see that there are two configurations , The way , Simple configuration and professional configuration . A large number of articles can be found on the Internet , It has been said before , Let me give them a brief explanation .
Simple configuration : Click on 【 Paste excel The table generates this table 】, Just paste the data directly , but Pay attention to the correctness of the format , Refer to the template .

Professional configuration : You can choose to import excel form , Or modify and refresh the original data results .

That's all for the chart , Try to use Visual interactive platform Template page for , Use this component to see , A gorgeous Visual data graph Can help you “ speak ” 了 .
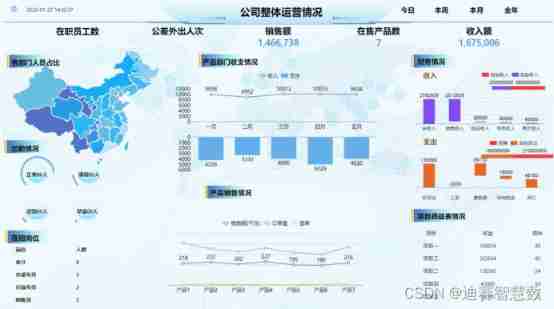
and Data visualization screen For company management is also icing on the cake , The integration of various data is clear at a glance .
边栏推荐
- 【CSRF-01】跨站请求伪造漏洞基础原理及攻防
- JVM family -- monitoring tools
- [paddleseg source code reading] normalize operation of paddleseg transform
- Detailed explanation of PPTC self recovery fuse
- Audio and video technology development weekly | 232
- Graduation summary
- [PaddleSeg 源码阅读] PaddleSeg计算 mIoU
- Wechat official account web page authorization
- Objective-C string class, array class
- [Yugong series] go teaching course 002 go language environment installation in July 2022
猜你喜欢

Rhcsa-- day one
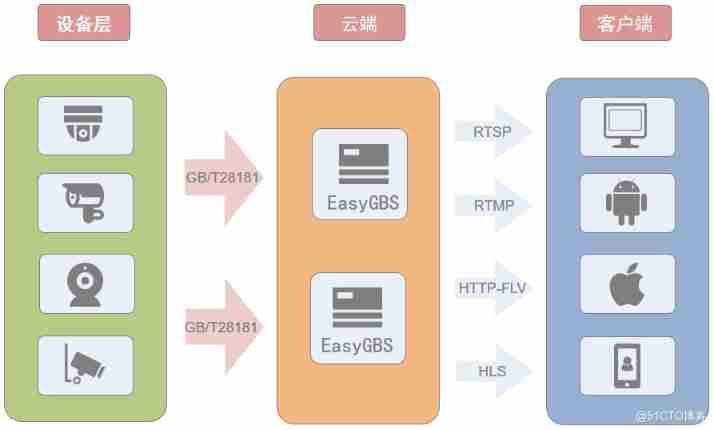
National standard gb28181 protocol platform easygbs fails to start after replacing MySQL database. How to deal with it?
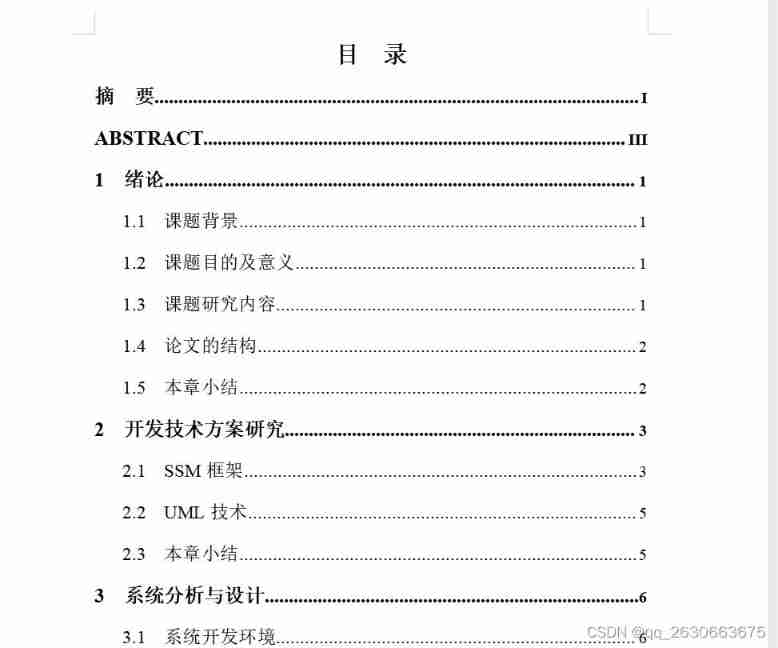
Management and thesis of job management system based on SSM
![[source code analysis] model parallel distributed training Megatron (5) -- pipestream flush](/img/98/3e5f1094141e34d7e77f908e12acda.jpg)
[source code analysis] model parallel distributed training Megatron (5) -- pipestream flush
微信公众号网页授权

Balance between picture performance of unity mobile game performance optimization spectrum and GPU pressure
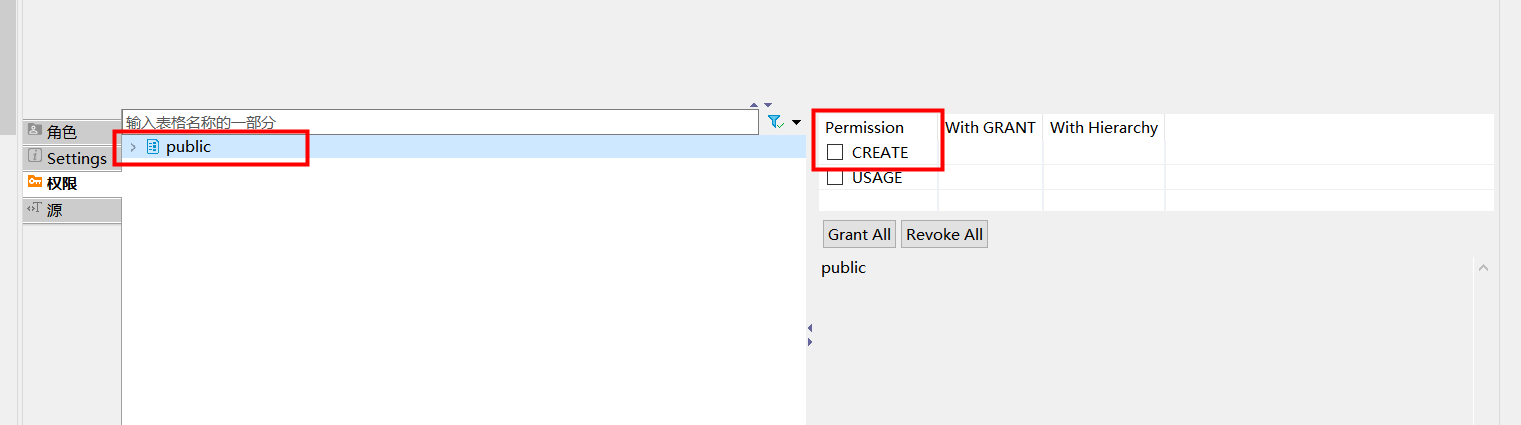
PostgreSQL users cannot create table configurations by themselves

Why is it recommended that technologists write blogs?

mysql数据库的存储
深度优先搜索简要讲解(附带基础题)
随机推荐
JDBC 进阶
CSP drawing
Katalon使用script实现查询List大小
深入浅出对话系统——使用Transformer进行文本分类
pytest多进程/多线程执行测试用例
Katalon框架测试web(二十一)获取元素属性断言
Detailed explanation of PPTC self recovery fuse
What kind of experience is it when the Institute earns 20000 yuan a month!
如何有效远程办公之我见 | 社区征文
Go 语言入门很简单:Go 实现凯撒密码
潘多拉 IOT 开发板学习(HAL 库)—— 实验6 独立看门狗实验(学习笔记)
[PaddleSeg 源码阅读] PaddleSeg Transform 的 Normalize操作
华为云鲲鹏工程师培训(广西大学)
三年进账35.31亿,这个江西老表要IPO了
[paddleseg source code reading] paddleseg calculation dice
ctf-pikachu-XSS
智慧地铁| 云计算为城市地铁交通注入智慧
ctf-pikachu-CSRF
Objective-C string class, array class
logistic regression