当前位置:网站首页>The operation process of using sugar to make a large data visualization screen
The operation process of using sugar to make a large data visualization screen
2022-07-01 12:04:00 【Rain cloud 21】
Baidu data visualization Sugar Address :https://sugar.bce.baidu.com
Register account number first , After the account is registered successfully, there is a 30 Free trial period of days , Then we can use 30 God, what's going on .
1、 Get into ” The first space “
After entering, you can see such a page , The operation steps are displayed on the home page

2、 Connect to data source
the Sugar Connect to your own relational database , Give Way Sugar Be able to use and query the data in your database .
This is the official website to add data source documents :https://cloud.baidu.com/doc/SUGAR/s/Dk6z5xn67
Please add... In your database authorization before adding a data source IP White list :183.240.92.0/24、111.45.0.0/22、14.215.188.4/25
Click add data source in the upper right corner , Then fill in the relevant information , The data source name can be filled in casually , Others correspond to their own database .

After adding successfully, the page :

3、 Creating a data model
Click... Just after the new data source in the figure above “ Creating a data model ”

Then drag the table on the left to the right with the mouse

Put the value to be displayed in “ Measure ” part , Then save it in the upper right corner .
4、 Create a large screen
Click New , There are many templates , Choose one you need , Or you can design one yourself

After creating the large screen, enter the large screen editor , You can do the following :
- Add various charts through the toolbar at the top
- Click to select the chart , You can drag to change the position and size of the chart , And delete the chart ,
- Layer management on the left side of the page , You can adjust the layer of the chart , So as to change the coverage relationship between charts
- After selecting the chart, you can change the data binding of the chart , Replace with real data
Practice :
The data binding method is : Data model
Select the data model to use , Then drag the dimension field to X Axis , Drag the measurement field to Y Axis , The data on the horizontal column chart will be refreshed automatically :

5、SQL Modeling binding data
Add a chart in the large screen editor , Then select the data binding method as SQL modeling , Click the plus sign at the bottom right to create a new SQL Model

Here's the picture :SQL Write the model name casually , The data source is the database just added ,SQL Statement query the fields you want to display , Then use these two fields to model

Be careful :limit If you don't write , The system will automatically add limit 0, 5000
Finally, bind the data to X Axis Y Axis , It is suggested to debug first

6、 Set the scheduled refresh of the chart
The charts in the large screen can be set to refresh automatically every time , So as to achieve real-time data (SAAS Minimum version 10 second , Private deployment is the shortest 1 second )

Finally, save the preview in the upper right corner :

Finally, attach the official document of the product :https://cloud.baidu.com/doc/SUGAR/index.html
边栏推荐
- How to make the development of liquidity pledge mining system, case analysis and source code of DAPP defi NFT LP liquidity pledge mining system development
- C#依赖注入(直白明了)讲解 一看就会系列
- Value/hush in redis
- 印象深刻的bug汇总(持续更新)
- Istio, ebpf and rsocket Broker: in depth study of service grid
- [Yunju entrepreneurial foundation notes] Chapter 7 Entrepreneurial Resource test 2
- How to understand the developed query statements
- C knowledge point form summary 2
- 图的理论基础
- 自定义 grpc 插件
猜你喜欢

GID:旷视提出全方位的检测模型知识蒸馏 | CVPR 2021

Uniapp uses uni upgrade Center

Technology sharing | MySQL: how about copying half a transaction from the database?

Prepare for the Blue Bridge Cup Day10__ PWM control light brightness

MQ prevent message loss and repeated consumption

Mechanism and type of CPU context switch

Leetcode force buckle (Sword finger offer 31-35) 31 Stack push pop-up sequence 32i II. 3. Print binary tree from top to bottom 33 Post order traversal sequence 34 of binary search tree The path with a

强大、好用、适合程序员/软件开发者的专业编辑器/笔记软件综合评测和全面推荐
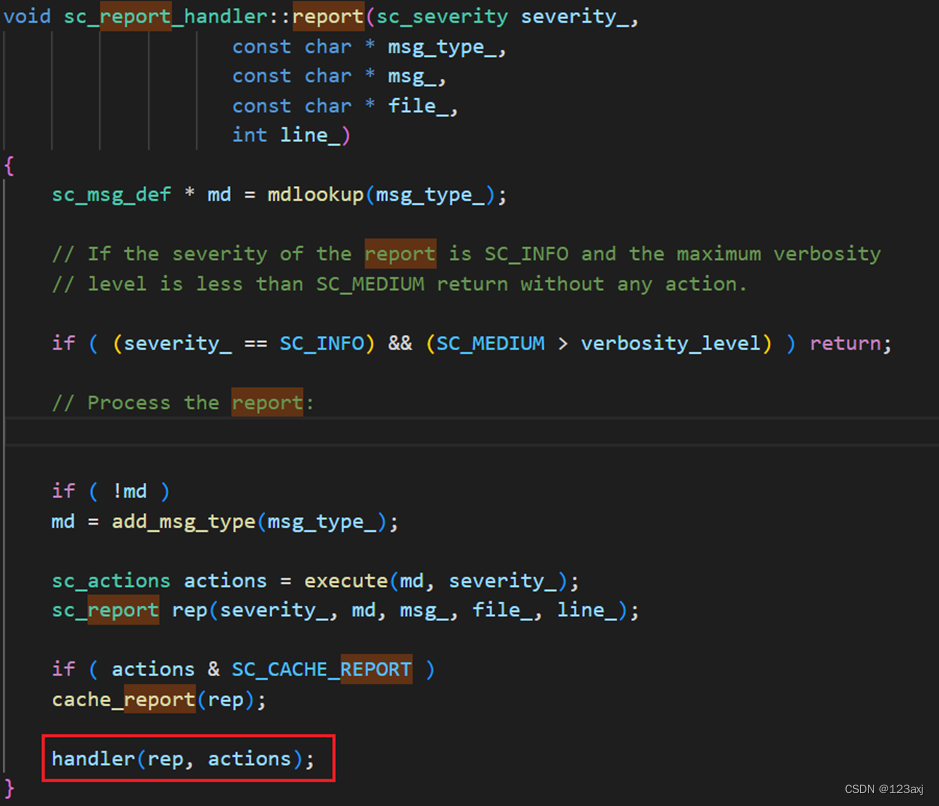
Use set_ Handler filters out specific SystemC wrapping & error messages

Redis configuration environment variables
随机推荐
Redis startup and library entry
指定的服务已标记为删除
Can solo be accessed through IPv6?
Istio, ebpf and rsocket Broker: in depth study of service grid
Value/list in redis
Software project management 9.2 Software project configuration management process
LeetCode力扣(剑指offer 31-35)31. 栈的压入弹出序列32I.II.III.从上到下打印二叉树33. 二叉搜索树的后序遍历序列34. 二叉树中和为某一值的路径35. 复杂链表的复制
Why does the JVM heap memory exceed 32g and pointer compression fail?
用于分类任务的数据集划分脚本
redis中value/set
强大、好用、适合程序员/软件开发者的专业编辑器/笔记软件综合评测和全面推荐
Learning summary on June 29, 2022
ACLY与代谢性疾病
91.(cesium篇)cesium火箭發射模擬
印象深刻的bug汇总(持续更新)
比特熊直播间一周年,英雄集结令!邀你来合影!
redis中value/String
Adjacency matrix undirected graph (I) - basic concepts and C language
内核同步机制
MQ-防止消息丢失及重复消费