当前位置:网站首页>GGPLOT: HOW TO DISPLAY THE LAST VALUE OF EACH LINE AS LABEL
GGPLOT: HOW TO DISPLAY THE LAST VALUE OF EACH LINE AS LABEL
2022-07-02 09:41:00 【小宇2022】
# Load required R packages
library(tidyverse)
library(ggrepel)
# Set ggplot2 default theme to theme_bw()
theme_set(theme_bw())

# Demo data
df <- tibble::tribble(
  ~Species, ~Petal.Length, ~Petal.Width, ~Sepal.Length, ~Sepal.Width,
  "setosa",         1.462,        0.246,         5.006,        3.428,
  "versicolor",          4.26,        1.326,         5.936,         2.77,
  "virginica",         5.552,        2.026,         6.588,        2.974
)
df_long <- df %>%
  pivot_longer(
    Petal.Length:Sepal.Width,
    names_to = "variable", values_to = "value"
  )
# Basic line plot
lp <- ggplot(df_long, aes(x = Species, y = value, group = variable)) +
  geom_line(aes(color = variable)) +
  geom_point() +
  theme(legend.position = "top")

# Filter the last values and add onto the line plot
# Corresponds to the `virginica` species
data_ends <- df_long %>% filter(Species == "virginica")
lp +
  geom_text_repel(
    aes(label = value), data = data_ends,
    fontface ="plain", color = "black", size = 3
  )

边栏推荐
猜你喜欢
Cluster Analysis in R Simplified and Enhanced

Basic usage of MySQL in centos8
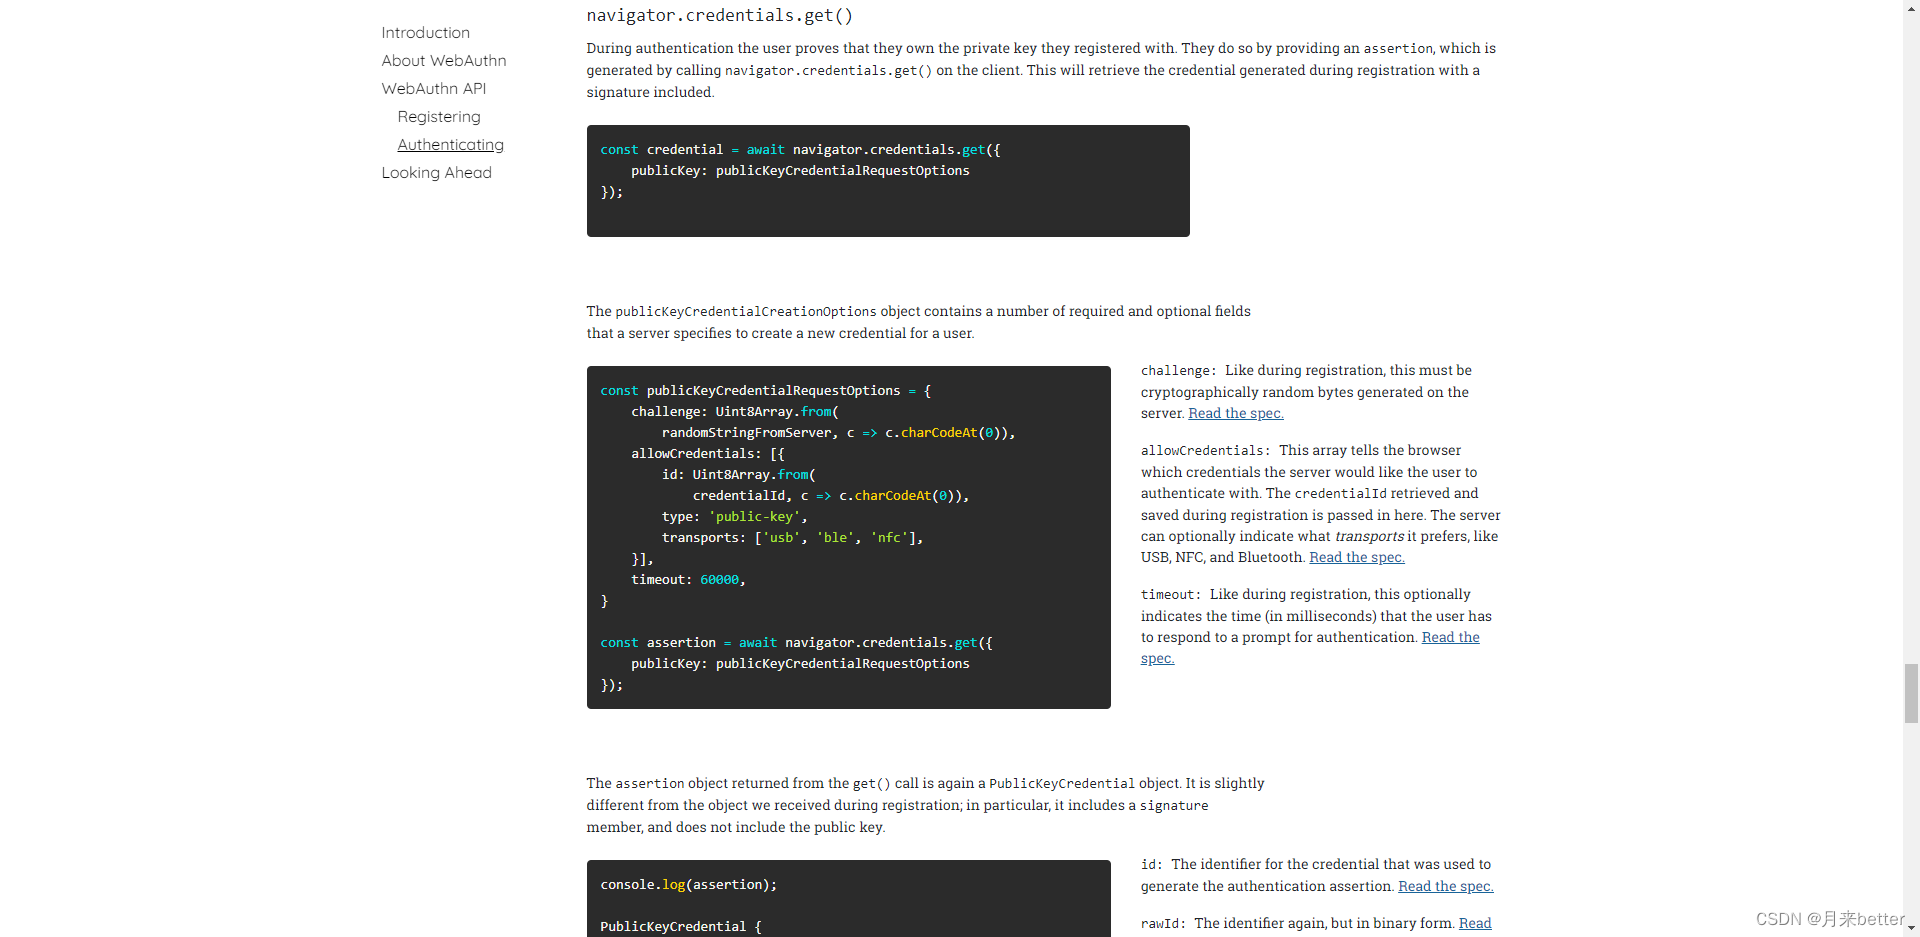
Webauthn - official development document

Principe du contrat évolutif - delegatecall

R HISTOGRAM EXAMPLE QUICK REFERENCE

Never forget, there will be echoes | hanging mirror sincerely invites you to participate in the opensca user award research
![[cloud native] 2.5 kubernetes core practice (Part 2)](/img/87/826894d758392a0c7a60dd5fa09eef.png)
[cloud native] 2.5 kubernetes core practice (Part 2)
念念不忘,必有回响 | 悬镜诚邀您参与OpenSCA用户有奖调研
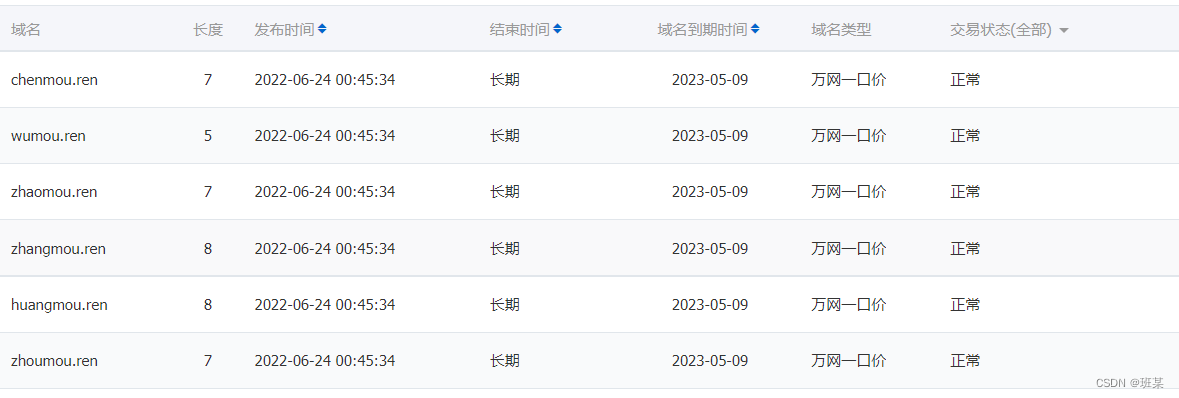
ren域名有价值吗?值不值得投资?ren域名的应用范围有哪些?

制造业数字化转型和精益生产什么关系
随机推荐
[cloud native] 2.5 kubernetes core practice (Part 2)
VS2019代码中包含中文内容导致的编译错误和打印输出乱码问题
可昇級合約的原理-DelegateCall
Astparser parsing class files with enum enumeration methods
Array splitting (regular thinking
Is the stock account given by qiniu business school safe? Can I open an account?
解决uniapp列表快速滑动页面数据空白问题
RPA进阶(二)Uipath应用实践
vant tabs组件选中第一个下划线位置异常
[multithreading] the main thread waits for the sub thread to finish executing, and records the way to execute and obtain the execution result (with annotated code and no pit)
微信小程序利用百度api达成植物识别
从攻击面视角,看信创零信任方案实践
Principle of scalable contract delegatecall
ROS lacks xacro package
SSRF
map集合赋值到数据库
MTK full dump grab
ros缺少catkin_pkg
GGPlot Examples Best Reference
原生方法合并word