当前位置:网站首页>Arthas practice documentation
Arthas practice documentation
2022-06-11 15:13:00 【Small y online coding】
Arthas Documentation of practical operations
The first 1 Chapter Arthas Brief introduction
1.1 Arthas What is it?
arthas Alibaba open source Java Diagnostic tools , The basic usage scenario is to locate and reproduce some problems that are difficult to locate in the production environment . You can check problems online , And dynamic tracking Java Code , Real-time monitoring JVM Status and so on , Official website address :https://arthas.aliyun.com/doc/.
1.2 Arthas Can do
A class from that jar Package loaded ? Why are all kinds of exceptions reported ? ( You can get the loading path and exception information of the specified class through the command )
The modified code is not implemented to ? It's not commit It's the wrong branch or something ?( You can get the code information of the class through decompiling )
I can't get online when I have a problem debug, Can't we just add logs and redistribute them ?( Can pass jdk 1.5 Of instrument To dynamically replace the code )
There is a problem with the data processing of a user online , But online also can't debug, It can't be reproduced offline !(arthas You can see a very detailed jvm Status and some convenient tools , Like decompiling , Online debugging, etc )
Is there a global perspective to see the health of the system ?(dashboard Command view jvm Details of )
How to quickly locate the hot spot of application , Generate flame chart ?
How to directly from JVM Find an instance of a class in ?
1.3 Arthas Supported versions
Support JDK 6+ Support Linux/Mac/Windows
The first 2 Chapter Arthas Use
2.1Arthas Installation (windows)
There are many ways to download and install , Here is a manual installation method .
Download the installation package manually :https://arthas.aliyun.com/download/latest_version?mirror=aliyun;
Linux Please refer to the official website for the installation and use of :https://arthas.aliyun.com/doc/install-detail.html#
2.2Arthas Use
Download the installation package and unzip it cmd Access control , Then enter the unzipped file directory ;
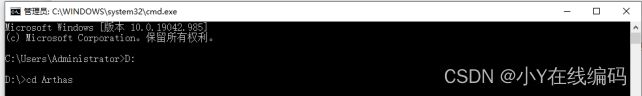
Enter the command :.\as.bat pid( Viewing program pid have access to java Self contained java VisualVM Visualization tools )


Select the... To be monitored and analyzed java process , Successful startup Arthas after , Will see Arthas The interface of , You can also directly access the corresponding port through the browser ;
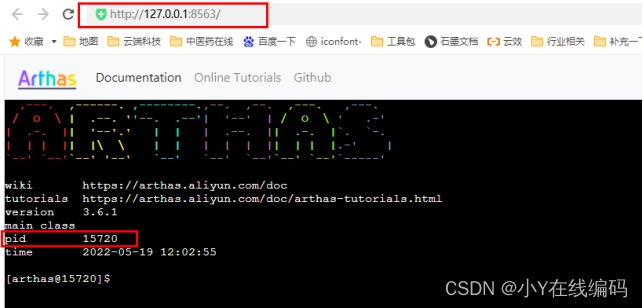
Get into Arthas You can input the corresponding commands in this interface to analyze the program ;
2.3Arthas Basic command introduction and actual use
Be careful : If you don't remember the order , have access to idea plug-in unit arthas idea Generate arthas Relevant command ;

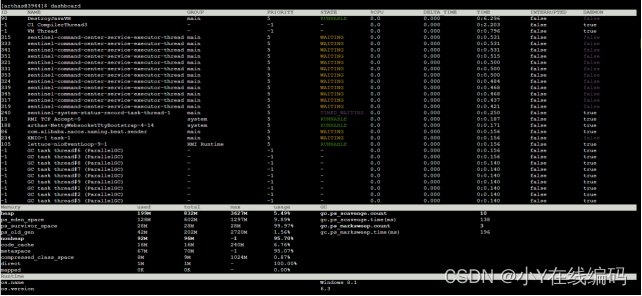
dashboard command
Enter this command to view the real-time data panel of the current system ;
jvm command
Enter this command to see the current jvm Details of ;

thread command
Enter this command to view the stack details of the thread ;

trace command
trace Command can actively search the method call path , And output the time consumption of each node on the method path , Render and count all performance overhead and trace call links on the entire call link .
Examples of use :
Now listen SysUserController Under class user() Method call chain :

Enter the command :
trace com.pig4cloud.pigx.admin.controller.SysUserController user -n 5 --skipJDKMethod false
Be careful :trace The following is the full path of classes and methods ;
Call the method , Then you can see in arthas The interface outputs the call chain of the method and the time consumption of each method on the link , This method can be used to find time-consuming methods for targeted optimization ;

watch command
watch Command allows users to easily observe the call of the specified method . The range that can be observed is : Return value 、 Throw an exception 、 Enter the reference , By writing OGNL Expression to view the corresponding variable .
Examples of use : Observe SysUserController Under class user() Method ;

The first 3 Chapter profiler Generate flame chart ( Support only Linux/Mac)
profiler The command supports the generation of flame diagrams of application hotspots . Essentially through continuous sampling , Then the collected sampling results are generated into a flame diagram , It can be used to quickly troubleshoot online performance problems .
The flame diagram is based on perf The result is SVG picture , Used to display CPU Call stack .

y Axis represents call stack , Each layer is a function . The deeper the call stack , The higher the flame , At the top is the function being executed , Below are all its parent functions .
x The axis represents the number of samples , If a function is in x The wider the width occupied by the axis , It means it's drawn more times , That is, the execution time is long . Be careful ,x The axis does not represent time , But after all call stacks are merged , In alphabetical order .
The flame graph is to see which function of the top layer occupies the largest width . As long as there is " flat roof "(plateaus), It means that the function may have performance problems .
Color has no special meaning , Because the flame graph shows CPU How busy , So the general choice of warm colors .
Interval length . Be careful ,x The axis does not represent time , But after all call stacks are merged , In alphabetical order .
The flame graph is to see which function of the top layer occupies the largest width . As long as there is " flat roof "(plateaus), It means that the function may have performance problems .
Color has no special meaning , Because the flame graph shows CPU How busy , So the general choice of warm colors .
Please refer to the official website for specific use :https://arthas.gitee.io/profiler.html
The first 4 Chapter Actual problem simulation
4.1 Performance problem simulation
1. First, write a long-running loop :
private void test() {

    int a = 1;
    while (a < 9999999) {

        a++;
        System.out.println(out(a));
    }
}
2. Call... In the method that adds the user test() Method 
3. Start the service , use arthas monitor user Method
trace com.pig4cloud.pigx.admin.controller.SysUserController user -n 5 --skipJDKMethod false
4. Call the interface for adding users , The interface responds successfully after a long time , You can see arthas The console outputs the call stack of this method 
You can see test() Methods take the longest .
4.2 cpu Simulation of soaring height problem
1. Transform the above program into an endless loop 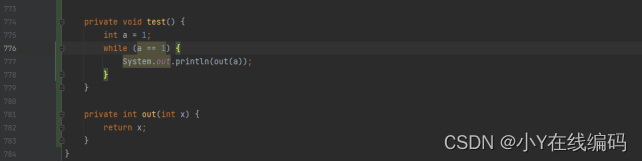
2. Also call... In the interface where the user is added test() Method
3. Restart the service before starting arthas.
4. Enter... Before calling add user interface thread command , At this point, you can see that all threads are normal , Here's the picture :
5. Now call the interface to add the user , Input again thread command , You can see one of them id by 308 Threads of cause cpu Soaring to more than 90% .
6. Print out threads ID by 308 Details of , You can see the specific code location and number of lines that caused the problem .
边栏推荐
- 02 Tekton Pipeline
- Station B executives interpret the financial report: the epidemic has no impact on the company's long-term development, and the video trend is irresistible
- 19. insertion, deletion and pruning of binary search tree
- Lippon instrument software intern interview
- Uniapp développe des applets Wechat, de la construction à la mise en ligne
- 见微知著,细节上雕花:SVG生成矢量格式网站图标(Favicon)探究
- A brief talk on the feelings after working at home | community essay solicitation
- [SystemVerilog interface] ~ interface
- C language simple webserver
- Why can redis be so fast?
猜你喜欢

Uniapp développe des applets Wechat, de la construction à la mise en ligne

Raspberry pie obtains the function of network installation system without the help of other devices

大道至简 | 设计 ViT 到底怎么配置Self-Attention才是最合理的?
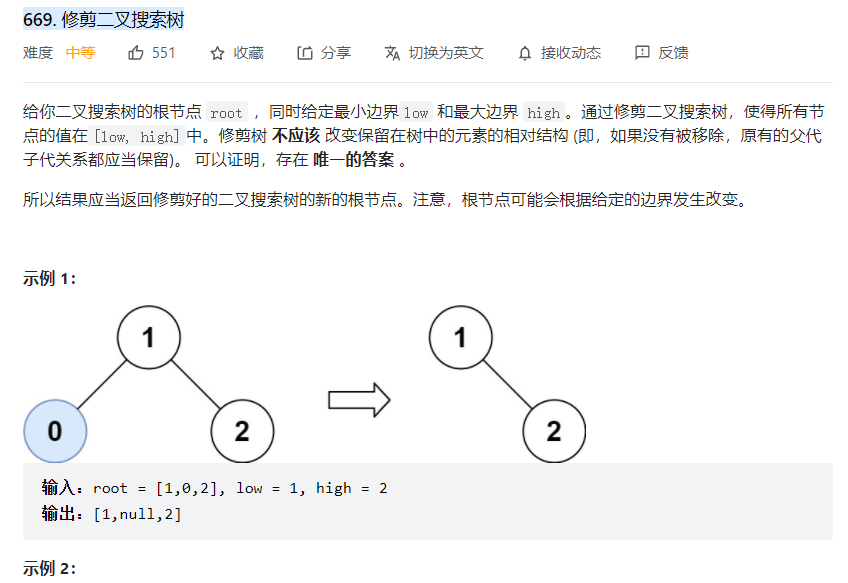
19. Insertion et suppression d'un arbre de recherche binaire

浅析分布式系统之体系结构-事务与隔离级别(多对象、多操作)下篇
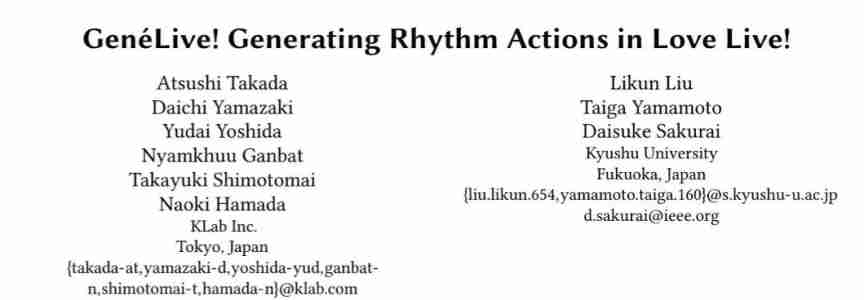
LoveLive! Published an AI paper: generating models to write music scores automatically
Did you break the rules?

Implementation of gray-scale publishing scheme for microservice architecture based on gateway and Nacos

社交软件Soul撤回IPO申请:上市只差临门一脚 腾讯是大股东

【SystemVerilog 之 接口】~ Interface
随机推荐
In depth interpretation: distributed system resilience architecture ballast openchaos
Understanding of oauth2
01discussion on Tekton
Explain the kubernetes package management tool Helm
C语言简易版webserver
大道至簡 | 設計 ViT 到底怎麼配置Self-Attention才是最合理的?
Hot seek tiger, a list of eco economic models
safePoint讲解及其安插思路分析
Installation and use of sonarqube
02 Tekton Pipeline
Knowledge of affairs
A former employee of Baidu was awarded 1.07 million yuan for job hopping; Apple, Google and Microsoft plan to "kill" the password; It is said that Geely has acquired Meizu | Q information
Illustration of tiger international quarterly report: revenue of USD 52.63 million continued to be internationalized
LoveLive! Published an AI paper: generating models to write music scores automatically
[mysql_11] addition, deletion and modification of data processing
Lippon instrument software intern interview
19. Insertion et suppression d'un arbre de recherche binaire
2022 simulated 100 questions and simulated examination of quality officer municipal direction post skills (Quality Officer) examination
新华三交换机系统基本配置命令
Summary of redis basic knowledge