This paper will discuss how to build an effective hybrid predictor , And compare and analyze the common mixing methods
Tree based algorithms are well known in machine learning ecosystems , They are famous for leading the supervision of forms . In the learning process , The splitting criterion of tree only focuses on the range of relevant features and useful values , So given a set of tabular features and goals to predict , Satisfactory results can be obtained without too much configuration and specific preprocessing .
However, the performance of tree based and gradient lifting model in the field of time series prediction is not good , Many people prefer the method of deep learning . That's not surprising , Because the weakness of the tree based model is : It is technically impossible to infer higher than in the training data / Lower eigenvalue . It is almost impossible for them to predict values outside the range they see . contrary , Classical linear regression may be less affected by the dynamic behavior of data . Since linear regression is good at inferring trends , Gradient ascension is good at learning interaction , Can they be combined ? The goal of this article is to create “ blend ” predictor , Combined with complementary learning algorithms , Let one's strengths make up for another's weaknesses .
When using deep learning , Easier to think of “ hybrid model ”, Because the unlimited architecture combination and personalized training process of neural network provide great benefits in customization . Developing custom mixes using a tree model is cumbersome .linear-tree, This python Bag is a good choice , It provides a hybrid model architecture , It combines the learning ability of tree based model and linear model . More Than This ,LGBM or XGBoost The ability of fitting gradient elevation with linear approximation in leaves is also introduced .
In this article , I tried to build a hybrid predictor from scratch . What we need to do next is to learn the system mode according to the two-step method .
Basic knowledge of
In order to design effective mixing , We need to have a general understanding of how time series are constructed . Time series can generally be divided into three parts ( trend 、 Season and cycle ) Add an essentially unpredictable term ( error ) Add together to accurately describe .
series = trend + seasons + cycles + errorLearning time series components can be seen as an iterative process :
- First , Learn the trend and subtract it from the original sequence , Get the residual sequence ;
- secondly , Learn seasonality from the de trending residuals and subtract the seasons ;
- Last , Learn the cycle and subtract the cycle .
let me put it another way , We use an algorithm to fit specific component sequences , Then another algorithm is used to fit the residual sequence . The final prediction is the sum of the predictions of various model components .
In order to try to build a hybrid model , We began to generate some time series data with double seasonal patterns and trend components .
np.random.seed(1234)
seas1 = gen_sinusoidal(timesteps=timesteps, amp=10, freq=24, noise=4)
seas2 = gen_sinusoidal(timesteps=timesteps, amp=10, freq=24*7, noise=4)

rw = gen_randomwalk(timesteps=timesteps, noise=1)
X = np.linspace(0,10, timesteps).reshape(-1,1)
X = np.power(X, [1,2,3])
m = LinearRegression()
trend = m.fit(X, rw).predict(X)

plt.figure(figsize=(16,4))
plt.subplot(121)
plt.plot(seas1 + seas2, c='red'); plt.title('Seasonalities')
plt.subplot(122)
plt.plot(rw, c='black'); plt.plot(trend, c='red'); plt.title('Trend')

plt.figure(figsize=(16,4))
plt.plot(seas1 + seas2 + trend, c='red'); plt.title('Seasonalities + Trend')
Fitting cubic polynomial on random walk sequence can obtain unknown trend . The result is a smooth trend line , It is added to the seasonal component to obtain the final time series . Multiple time series can be generated in this way , And try to predict them and benchmark various solutions .
df.plot(legend=False, figsize=(16,6))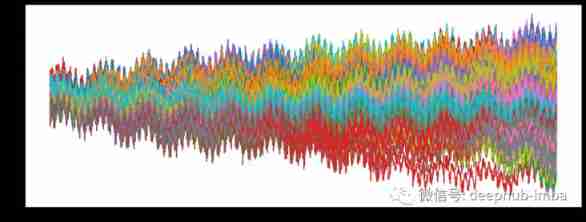
Experimental method
In this paper, four different methods are tried :
- Fitting a simple linear model ;
- differencing: Use differential transformation , Make the goal stable ;
- hybrid additive: Fitting has the best linear model to infer the trend . Then the gradient lifting is used to model the detrended sequence ;
- hybrid inclusive.: Fitting gradient lifting , Including extrapolation trends ( The trend of fitting with the best linear model is obtained ) As a feature .
In addition to the most basic solution , All the above methods use some spline transformations as features . These characteristics can well capture the seasonal pattern . The best trend is calculated by searching the best linear model on the training data . Use the time cross validation strategy to search for some optimal parameter configurations .
result
For each series that can be used , Have tried all the methods mentioned above , And store the results on the test data .
###  A little bit of training , Please check the final complete source code  ###

scores = pd.DataFrame({
    f'{score_naive}': mse_naive,
    f'{score_diff}': mse_diff,
    f'{score_hybrid_add}': mse_hybrid_add,
    f'{score_hybrid_incl}': mse_hybrid_incl
})

scores.plot.box(figsize=(11,6), title='MSEs on Test', ylabel='MSE')
hybrid inclusive Get the lowest average test error , The second is the difference method .hybrid additive Our performance is below our expectations , Because its error is almost three times that of the difference method . Generally speaking , In the dynamic system ( For example, the system proposed in the experiment of this paper ) When modeling , Differential operation on the target value is a good choice . The huge performance differences between hybrid methods also show some problems . Let's check the results , See what happens .
c = 'ts_11'

df[c].plot(figsize=(16,6), label='true', alpha=0.3, c='black')

df_diff[c].plot(figsize=(16,6), label='differencing pred', c='magenta')
df_hybrid_add[c].plot(figsize=(16,6), label='hybrid addictive pred', c='red')
df_hybrid_incl[c].plot(figsize=(16,6), label='hybrid inclusive pred', c='blue')
df_naive[c].plot(figsize=(16,6), label='trend pred', c='lime', linewidth=3)

plt.xlim(0, timesteps)
plt.axvspan(0, timesteps-test_mask.sum(), alpha=0.2, color='orange', label='TRAIN')
plt.axvspan(timesteps-test_mask.sum(), timesteps, alpha=0.2, color='green', label='TEST')
plt.legend()
Prediction comparison 1
c = 'ts_33'

df[c].plot(figsize=(16,6), label='true', alpha=0.3, c='black')

df_diff[c].plot(figsize=(16,6), label='differencing pred', c='magenta')
df_hybrid_add[c].plot(figsize=(16,6), label='hybrid addictive pred', c='red')
df_hybrid_incl[c].plot(figsize=(16,6), label='hybrid inclusive pred', c='blue')
df_naive[c].plot(figsize=(16,6), label='trend pred', c='lime', linewidth=3)

plt.xlim(0, timesteps)
plt.axvspan(0, timesteps-test_mask.sum(), alpha=0.2, color='orange', label='TRAIN')
plt.axvspan(timesteps-test_mask.sum(), timesteps, alpha=0.2, color='green', label='TEST')
plt.legend()
Prediction comparison 2
c = 'ts_73'

df[c].plot(figsize=(16,6), label='true', alpha=0.3, c='black')

df_diff[c].plot(figsize=(16,6), label='differencing pred', c='magenta')
df_hybrid_add[c].plot(figsize=(16,6), label='hybrid addictive pred', c='red')
df_hybrid_incl[c].plot(figsize=(16,6), label='hybrid inclusive pred', c='blue')
df_naive[c].plot(figsize=(16,6), label='trend pred', c='lime', linewidth=3)

plt.xlim(0, timesteps)
plt.axvspan(0, timesteps-test_mask.sum(), alpha=0.2, color='orange', label='TRAIN')
plt.axvspan(timesteps-test_mask.sum(), timesteps, alpha=0.2, color='green', label='TEST')
plt.legend()
Prediction comparison 3
From the pile of images above , Can better understand additive Methodical “ Failure ”. Its performance is closely related to the quality of previous trend fitting . If the trend estimate is not accurate , Then the final prediction will be more inaccurate . But this behavior passes through hybrid inclusive The method is alleviated , Because trends are included as features in the model . Therefore, gradient lifting can correct / Reduce the final prediction error .
summary
In this article , Different methods of establishing time series hybrid prediction model are introduced . An important point to emphasize is , In addition to the methods shown here , There are many other ways to combine machine learning models . If we can clearly understand how the standard algorithm works , It will be easier to debug or understand possible defects or defects created by mixing .
Last , The complete code of this article is here :
https://www.overfit.cn/post/266402dd48eb4a8884aa0f7c359da2cb
author :Marco Cerliani


![姿态估计之2D人体姿态估计 - Human Pose Regression with Residual Log-likelihood Estimation(RLE)[仅链接]](/img/c7/9c25da07236ef0bd241b6023e82306.gif)


