当前位置:网站首页>[probably the most complete in Chinese] pushgateway entry notes
[probably the most complete in Chinese] pushgateway entry notes
2022-07-03 15:06:00 【Initial-T】
Reference link : Official documents Official documents in Chinese prometheus Official Guide Blog
One Concept
Pushgateway Is an intermediary service , It allows the Push indicators from jobs that cannot be crawled .
Its purpose is to allow temporary and batch jobs to Prometheus Disclose its indicators . Because of these types of job It may not exist long enough to be captured , So they can push the indicators to Pushgateway. then Pushgateway Publish these indicators to Prometheus.
Usually ,Pushgateway The only valid use case is to capture the results of a service level batch job , “ Service levels ” A batch job is a job that is not semantically related to a particular machine or job instance . Indicators for such operations should not include machine or instance labels , With Separate the life cycle of a specific machine or instance from the pushed metrics . This alleviates in Pushgateway The burden of managing obsolete indicators .
Advantages and disadvantages
Use it The main reason is :
- Prometheus use pull Pattern , Maybe it's not in a subnet or firewall , Lead to Prometheus You can't pull each one directly target data .
- While monitoring business data , You need to aggregate different data , from Prometheus Unified collection .
Disadvantages are :
- Aggregate data from multiple nodes to pushgateway, If pushgateway Hang up , Affected more than one target Big .
- Prometheus Pull state up Only aim at pushgateway, Can't do it for every node .
- Pushgateway All the monitoring data pushed to it can be persisted . therefore , Even if your monitoring is offline ,prometheus And pull the old monitoring data , It needs to be cleaned by hand pushgateway Don't worry about your data .Pushgateway The life cycle of the index cache is fundamentally separate from the life cycle of the process that pushes the index to it . Compare this with Prometheus Usual pull Type monitoring : When an instance disappears ( Intentionally or unintentionally ) when , Its indicators will automatically disappear . Use Pushgateway when , That's not the case , You must now manually delete any outdated metrics or automatically synchronize this lifecycle yourself .
Two Configuration and use
1 install pushgateway
You can directly visit the official website to download its binary files : https://github.com/prometheus/pushgateway/releases, The latest version of 1.4.3 For example :
The simplest execution , You can decompress and run it directly :
./pushgatewayThe default monitor is 9091 port . It can be changed through the following configuration :
usage: pushgateway [<flags>]
Flags:
      --web.listen-address=":9091"  		 monitor Web Interface ,API And telemetry address .
      --web.telemetry-path="/metrics"  		 Open metrics The path of .
      --web.external-url=        			 Externally accessible Pushgateway Of URL.
      --web.route-prefix=""      			Web Prefix of the internal route of the endpoint .  The default is --web.external-url The path of .
      --persistence.file=""      			 Archive to retain metrics.  If it is empty , be metrics Only in memory .
      --persistence.interval=5m  			 Minimum interval for writing persistent files .
      --log.level="info"         			 Only messages with a given severity or higher are logged .  Effective level :[debug, info, warn, error, fatal]
      --log.format="logger:stderr"  		 Set the log target and format .  Example :“ logger:syslog?appname = bob&local = 7” or “ logger:stdout?json = true”
      --version                  			 Show application version .
The local test is changed to 9095 port ( I don't know why 9091 Of web The interface cannot be accessed ), take pushgateway Move to /usr/local/bin Next , The start command is
/usr/local/bin/pushgateway --web.listen-address=:9095Visit the web page at this time ip:9095 You can see the front page

visit ip:9095/metrics, You can see its indicator page
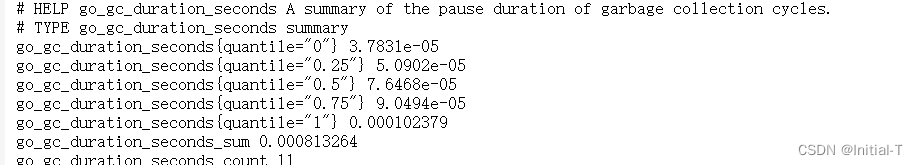
2 Access prometheus
change prometheus The configuration file , increase
  - job_name: 'pushgateway_name'
    scrape_interval: 30s
    honor_labels: true  # Add this configuration ,exporter Some tags in the data uploaded by the node will not be deleted pushgateway The same label of the node overrides
    static_configs:
        - targets: ["127.0.0.1:9095"]
          labels:
              instance: pushgateway_instance
# pushgateway  We usually follow the data in  job  and  instance  Group and classify , So these two parameters are indispensable .
restart Prometheus service , Or hot loading
curl -X POST http://127.0.0.1:9090/-/reloadVisit at this time prometheus Interface , You can see targets In the pushgateway Related information , among instance And job Are specified in the configuration file .job Required ,instance If you don't have it, you'll do it “” An empty string .

3 Push data
Push indicators are managed by group , It is identified by the grouping key of any number of labels , The first one must be job label .
curl Send form description
–data-binary And -d, --data similar , If the @ start , Then the file name must be followed , And the newline character in the file , The carriage return character will be retained , Nor will it write the data to be sent to the file “ name ”, The function is to send the data in the file to the specified place
Example 1 : Simple push
A single sample is pushed by In the identified group {job="example_job"}:
echo "example_metric 3.14" | curl --data-binary @- http://127.0.0.1:9095/metrics/job/example_job
You can see that there is a UNTYPED . Because the type information is not provided , therefore some_metric Put the typeless of type . Because we only wrote job The name of , So you can see instance That column is An empty string .
Example 2: Add lable
echo "example_metric 3.14" | curl --data-binary @- http://127.0.0.1:9095/metrics/job/example_job/lable1/example_lable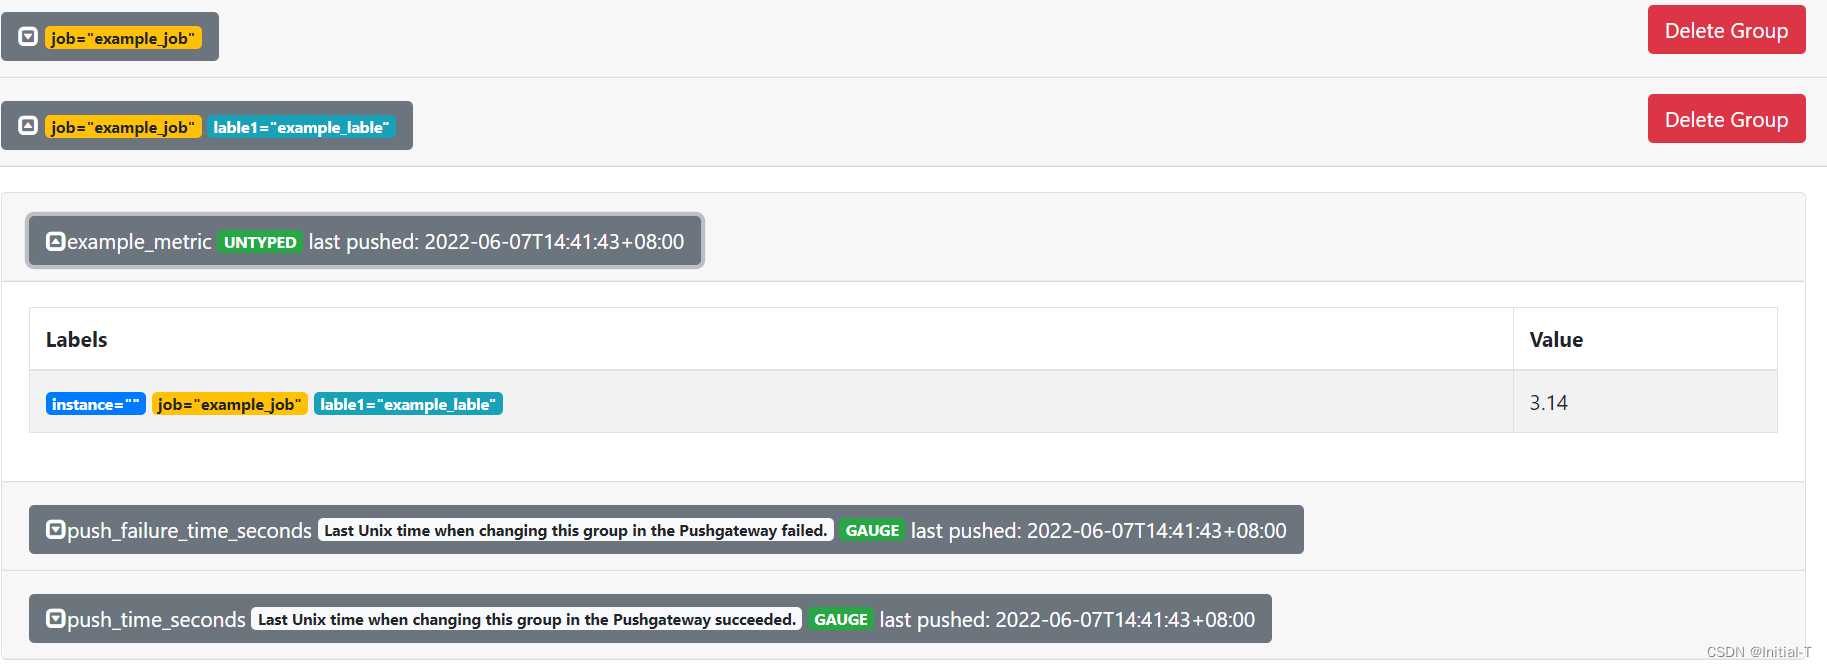
Example 3: Complex push
cat <<EOF | curl --data-binary @- http://127.0.0.1:9095/metrics/job/some_job/instance/some_instance # TYPE some_metric counter some_metric{label="val1"} 42 # TYPE another_metric gauge # HELP another_metric Just an example. another_metric 2398.283 EOF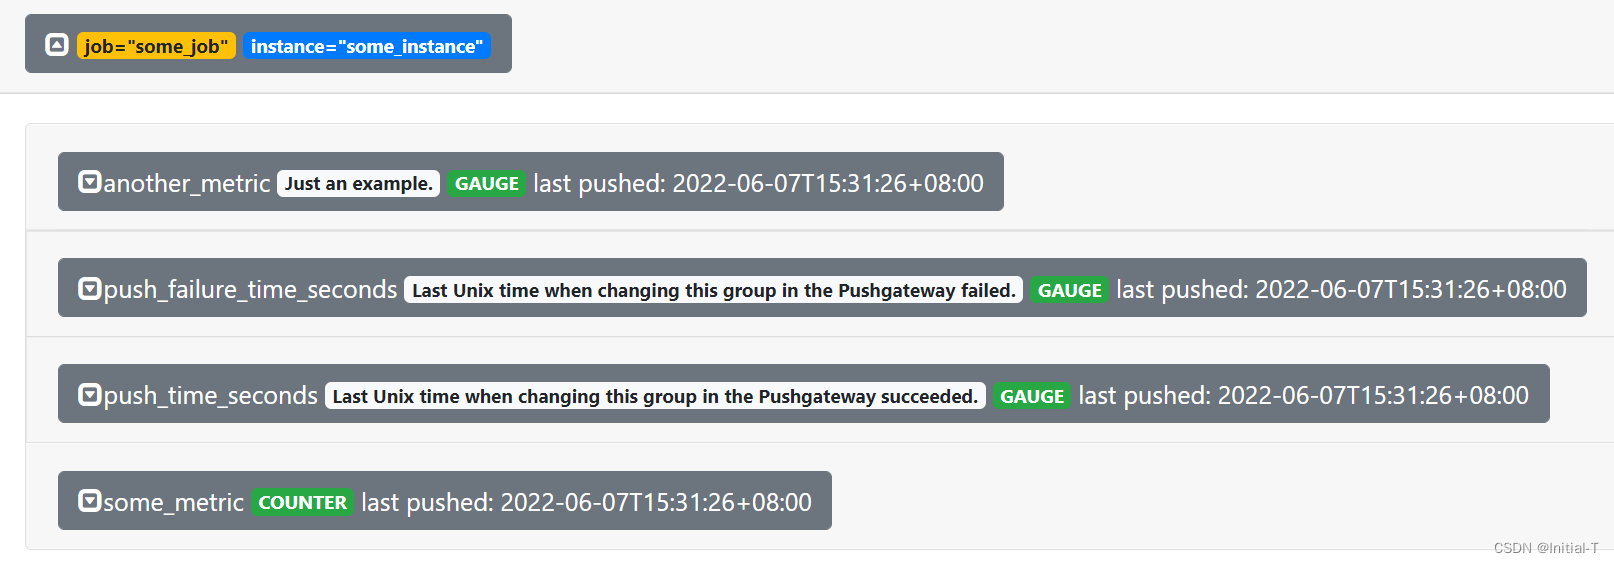
Example 4: Delete
Delete all indicators in the group identified by ,{job="some_job",instance="some_instance"}
curl -X DELETE http://127.0.0.1:9095/metrics/job/some_job/instance/some_instanceDelete the division All indicators in the identified group {job="some_job"}( Please note that , This does not include {job="some_job",instance="some_instance"} Indicators in the group in the previous example , Even if these indicators have the same job tag )
curl -X DELETE http://127.0.0.1:9095/metrics/job/some_jobDelete all indicators of all groups
curl -X PUT http://127.0.0.1:9095/api/v1/admin/wipe # You need to enable management through the command line flag API --web.enable-admin-api3、 ... and analysis
1 prometheus Configuration problem
Pushgateway Must be configured to Prometheus Grab the target , Use one of the common methods . however , You should always honor_labels: true Set in the crawl configuration
Before and after configuration , stay Prometheus The format of fetching data is as follows
echo "example_metric 3.15" | curl --data-binary @- http://127.0.0.1:9095/metrics/job/example_job/instance/i123

example_metric{exported_instance="i123", exported_job="example_job", instance="pushgateway_instance", job="pushgateway_name"} 3.15 #  Before configuration  example_metric{instance="i123", job="example_job"}
That is, if it is not configured , job Follow instance By default Pushgateway Properties of , Instead of pushing the attributes of the main body .
pushgateway We usually follow the data in job and instance Group and classify , So these two parameters are indispensable . because Prometheus To configure pushgateway When , Will also specify job and instance, But it only means pushgateway example , Can't really express the meaning of collecting data . So in prometheus Middle configuration pushgateway When , Need to add honor_labels: true Parameters , So as to avoid collecting the data itself job and instance Be overwritten .
2 Time stamp problem
Prometheus Each sample only knows one timestamp , Indistinguishable “ Push time ” and “ Grab time ”. No use case can be attached with a different timestamp , And many users try to do this by mistake ( Although there is no client library support ),Pushgateway Reject any push with timestamp . If you are in time t1
Push indicators , You may believe Prometheus Will use the same timestamp t1 Grab them . contrary ,Prometheus As an addition to the timestamp, it grabs Pushgateway Time for .
3 Data type problem
All indicators must be consistent : Indicators with the same name must have the same type , Even if they are pushed to different groups , And can't repeat , That is, indicators with the same name and exactly the same label pair . Inconsistent push will be rejected , Status code for 400.
text format parsing error in line 1: expected float as value, got "abc"4 Data validity
pushgateway It's not going to be Prometheus Of pull Changed to push, It just allows users to push indicator information to him and record .
and Prometheus Each time from pushgateway The data pulled is the last push The data coming up , Not all data pushed by users during the period . So set the push time and Prometheus Pull at the same time (
If the client has not pushed new indicators to pushgateway, that Prometheus Will always pull the last push The data coming up .

5 Push Links
Default URL The address is :http://:9091/metrics/job/{/<LABEL_NAME>/<LABEL_VALUE>}
among job Are mandatory , by job Label value , The back can be matched with any number of labels , Generally, we will add one instance/ Instance name label , To distinguish the indicators .
边栏推荐
- [graphics] hair simulation in tressfx
- 【可能是全中文网最全】pushgateway入门笔记
- 5.4-5.5
- [opengl] bone animation blending effect
- App global exception capture
- Apache ant extension tutorial
- Remote server background hangs nohup
- [graphics] efficient target deformation animation based on OpenGL es 3.0
- Global and Chinese markets for transparent OLED displays 2022-2028: Research Report on technology, participants, trends, market size and share
- App全局异常捕获
猜你喜欢

The latest M1 dedicated Au update Adobe audit CC 2021 Chinese direct installation version has solved the problems of M1 installation without flash back!

My QT learning path -- how qdatetimeedit is empty

el-switch 赋值后状态不变化
ASTC texture compression (adaptive scalable texture compression)
![[ue4] geometry drawing pipeline](/img/30/9fcf83a665043fe57389d44c2e16a8.jpg)
[ue4] geometry drawing pipeline

远程服务器后台挂起 nohup
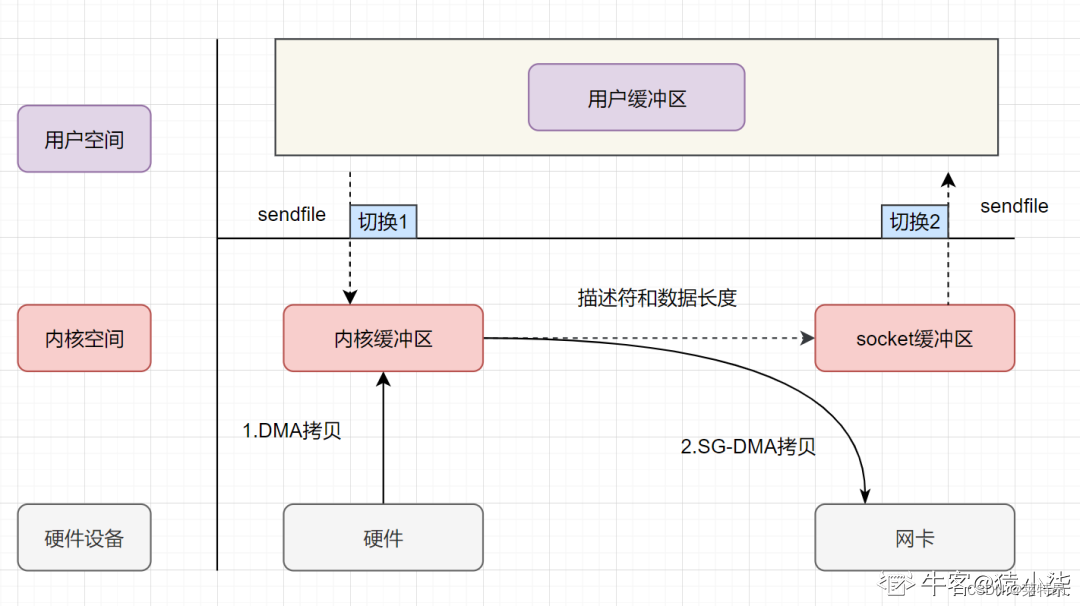
Zero copy underlying analysis
![[engine development] in depth GPU and rendering optimization (basic)](/img/71/abf09941eb06cd91784df50891fe29.jpg)
[engine development] in depth GPU and rendering optimization (basic)

Didi off the shelf! Data security is national security
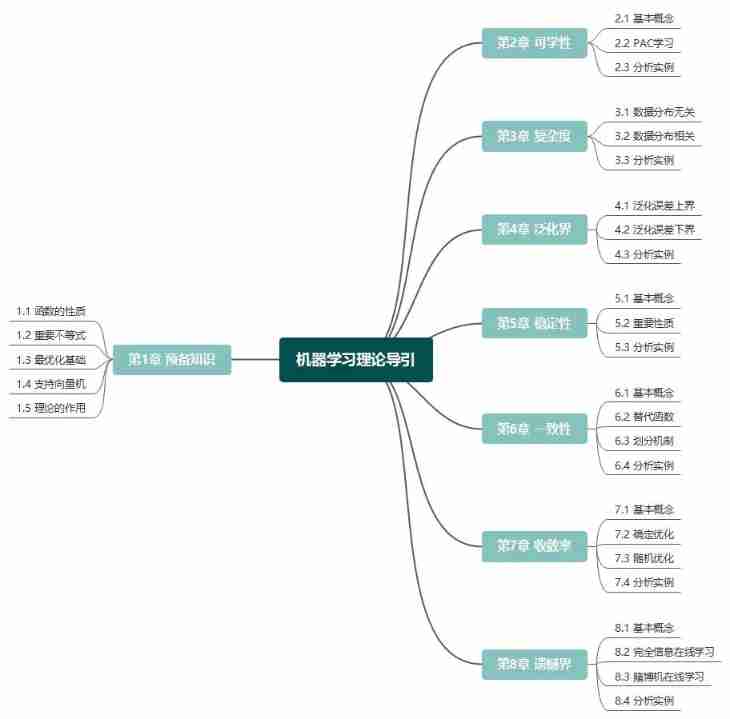
"Seven weapons" in the "treasure chest" of machine learning: Zhou Zhihua leads the publication of the new book "machine learning theory guide"
随机推荐
官网MapReduce实例代码详细批注
Global and Chinese market of lighting control components 2022-2028: Research Report on technology, participants, trends, market size and share
SQL server安装位置改不了
My QT learning path -- how qdatetimeedit is empty
[graphics] efficient target deformation animation based on OpenGL es 3.0
C language dup2 function
CentOS7部署哨兵Redis(带架构图,清晰易懂)
Solve the problem that PR cannot be installed on win10 system. Pr2021 version -premiere Pro 2021 official Chinese version installation tutorial
Yolov5 advanced 8 format conversion between high and low versions
C language DUP function
Composite type (custom type)
运维体系的构建
Yolov5系列(一)——網絡可視化工具netron
Several sentences extracted from the book "leather bag"
"Seven weapons" in the "treasure chest" of machine learning: Zhou Zhihua leads the publication of the new book "machine learning theory guide"
Global and Chinese market of solder bars 2022-2028: Research Report on technology, participants, trends, market size and share
[opengl] pre bake using computational shaders
Tensor ellipsis (three points) slice
[pytorch learning notes] datasets and dataloaders
Unity hierarchical bounding box AABB tree