当前位置:网站首页>【性能测试】jmeter+Grafana+influxdb部署实战
【性能测试】jmeter+Grafana+influxdb部署实战
2022-07-05 16:27:00 【bulabula2022】
Jmeter配置测试结果自动发送到influxdb
网上资料很多,jmeter配置不在此详细介绍
若要Grafana更灵活展示数据,需要对jmeter插件进行二次开发,自动把测试数据存入到influxdb时序数据库,在grafana面板自定义sql查询,自动显示想要的数据,grafana面板根据显示需要也要二次开发
influxDB部署
1.linux指定目录下载InfluxDB
下载地址:wget https://dl.influxdata.com/influxdb/releases/influxdb-1.8.4.x86_64.rpm
2.安装InfluxDB:
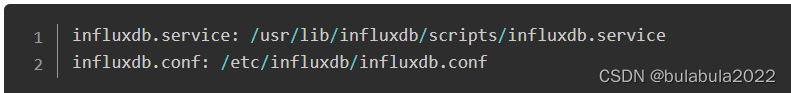
yum localinstall influxdb-1.8.4.x86_64.rpm,两个主要文件位置
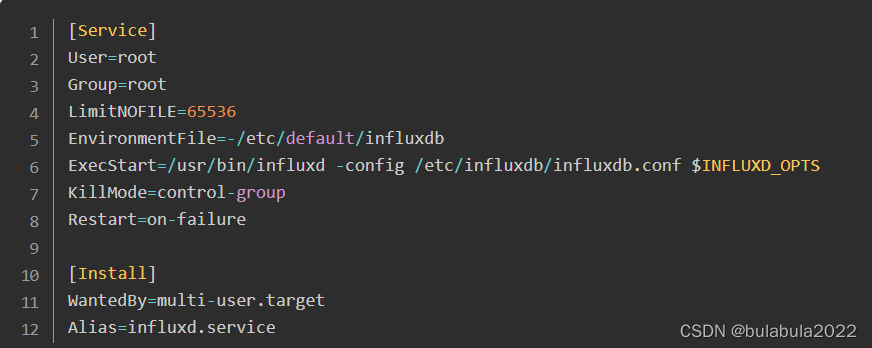
3.更改服务启动配置:vim influxdb.service
1)将User和Group值改成root
2)influxdb.service文件重新启动生效服务命令:systemctl daemon-reload
4.修改influxDB配置文件
执行命令:vi /etc/influxdb/influxdb.conf,将最终修改的配置如下:
[[graphite]]
# Determines whether the graphite endpoint is enabled.
enabled = true
database = "jmeter" # 数据库名称
retention-policy = ""
bind-address = ":2003" # 端口
protocol = "tcp"
consistency-level = "one"
……
[http]
# Determines whether HTTP endpoint is enabled.
enabled = true
# The bind address used by the HTTP service.
bind-address = ":8086"
修改完成后执行 :wq 保存退出
5.启动Influxdb服务
1)临时启动:systemctl start influxdb
2)开机启动:systemctl enable influxdb
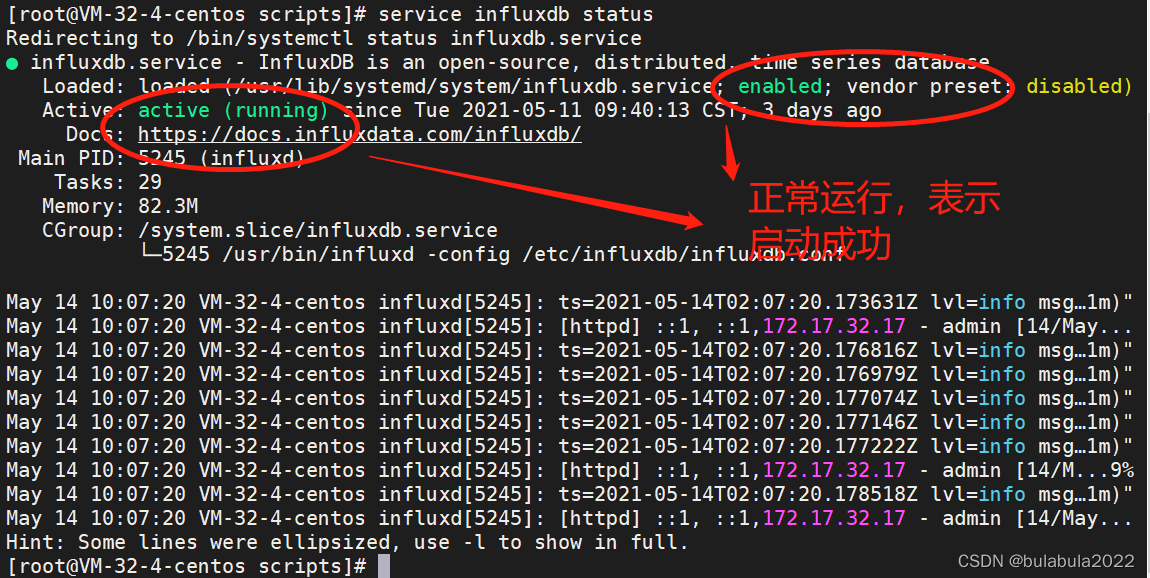
3)查看运行状态:ps -ef | grep -i "influx"或者service influxdb status
4)重启:service influxdb restart
influxDB的tcp默认监听端口是8088,执行:netstat -antp|grep 8088,显示如下则表示端口重新启动成功

附influxdb部分端口说明
启动 influxdb 数据库:
service influxdb start
停止 influxdb 数据库:
service influxdb stop
端口说明
8083:访问 web 页面的地址,8083 为默认端口;1.4版本该功能弃用,改为Chronograf
8086:数据写入 influxdb 的地址,8086 为默认端口;
8088:数据备份恢复地址,8088 为默认端口;
如果linux开启防火墙,需开放8086端口,命令如下:
firewall-cmd --add-port=8086/tcp --permanent
firewall-cmd --add-port=8086/udp --permanent
firewall-cmd --reload
6.创建数据库及用户
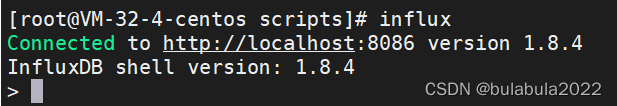
1) 进入influx命令:influx
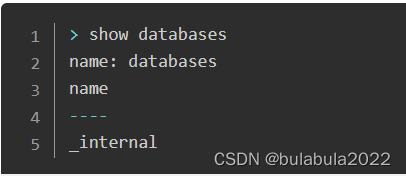
2)展示数据库,和mysql类似:show databases
3)创建数据库: CREATE DATABASE jmeter(库名)
> CREATE DATABASE jmeter
> use jmeter
> create user "admin" with password ' admin ' with all privileges
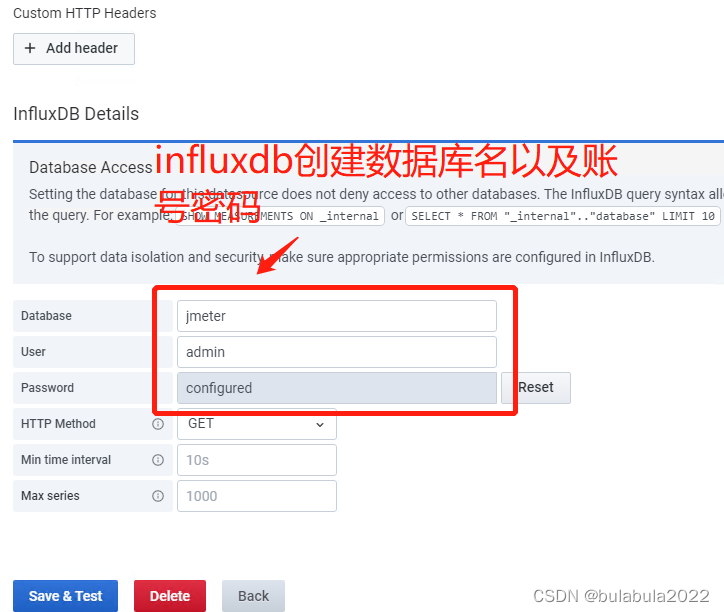
此处设置的用户名和密码需要记录下来,后面配置JMeter和Grafana时有用到
注:这里要注意一下,CREATE DATABASE必须使用大写
端口说明:
2003端口:Jmeter往数据库发数据的端口,服务器端也是该端口接收数据,所以服务器上需要开启该2003端口
8086端口,Grafana或Chronograf从influxdb数据库取数据的端口
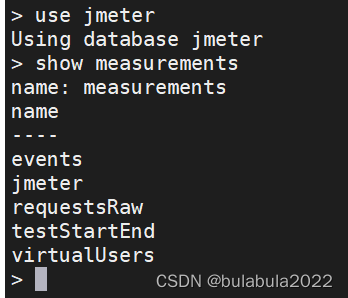
4)切换数据库:use jmeter(库名);展示表:show measurements
Grafana部署
Grafana是一款用Go语言开发的开源数据可视化工具,可以做数据监控和数据统计,带有告警功能
windows版安装
1、官网下载地址:Download Grafana | Grafana Labs
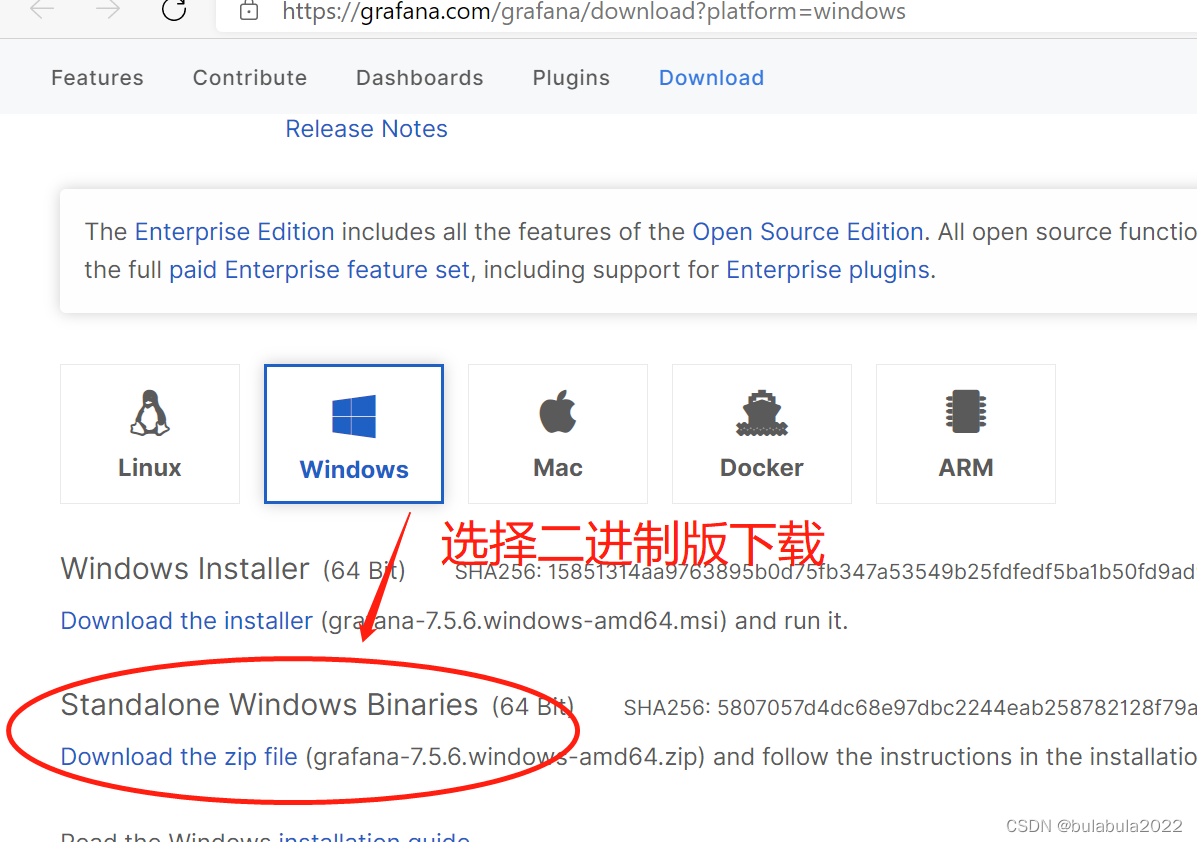
2、解压到安装文件夹即可
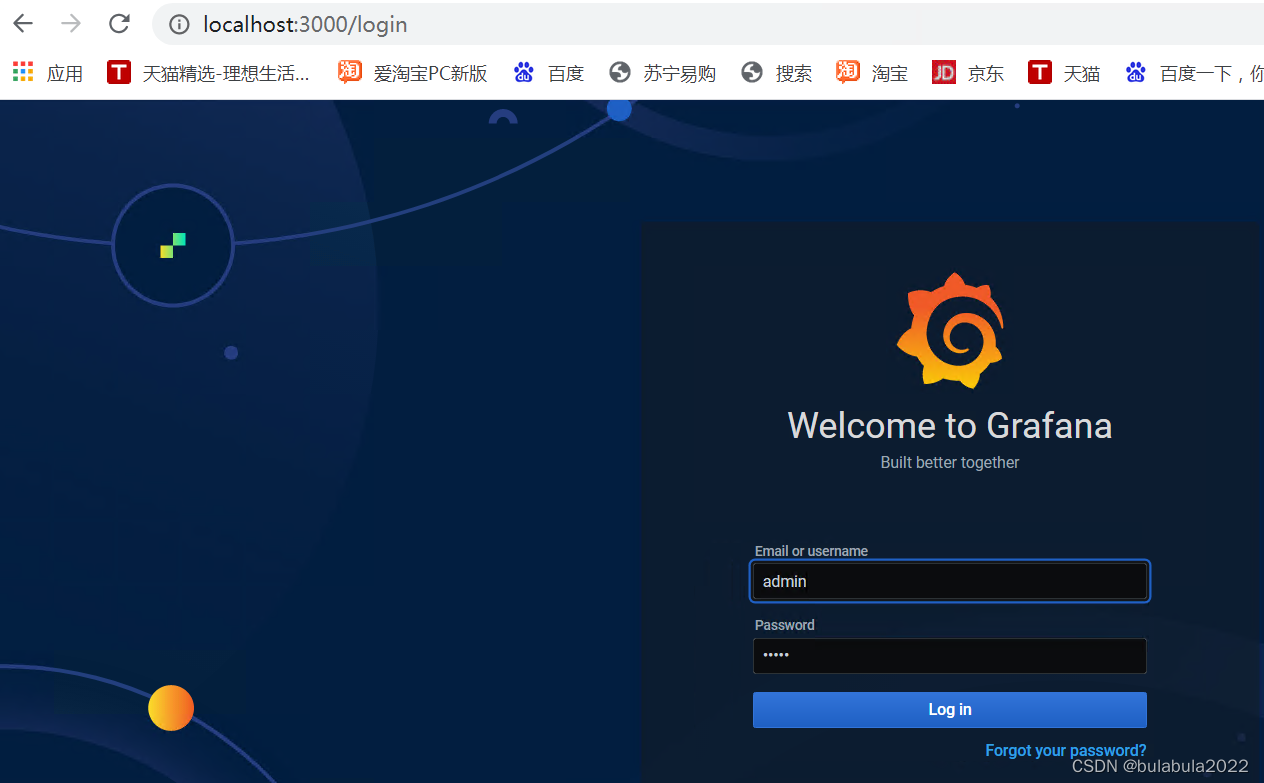
3、启动,切换到Grafana安装目录中的bin目录下,双击grafana-server.exe启动程序
4、访问http://localhost:3000,使用admin/admin登录Grafana即可,如下图
Linux版安装
1.切换到指定目录下下载:wget https://dl.grafana.com/oss/release/grafana-7.4.3-1.x86_64.rpm
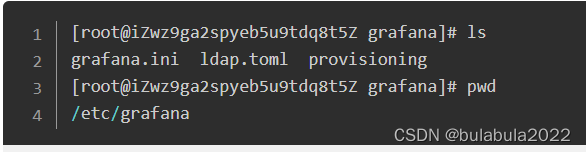
2.安装:sudo yum install grafana-7.4.3-1.x86_64.rpm 配置文件grafana.ini位置
3.启动grafana
1)开机启动
启动服务:systemctl start grafana-server
开机启动:systemctl enable grafana-server
重新启动:systemctl restart grafana-server
查看启动状态:service grafana-server status
grafana集成influxdb
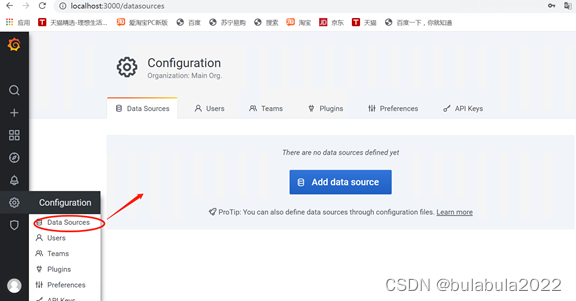
访问http://localhost:3000,使用admin/admin登录
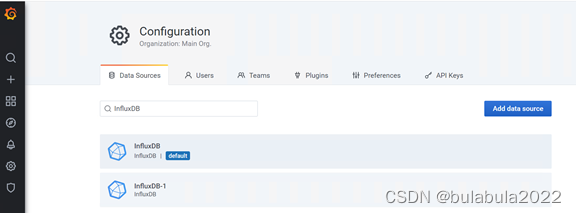
1.添加数据源:Configration –>Data Sources –> Add data source à选择InfluxDB
2.配置influxdb数据库
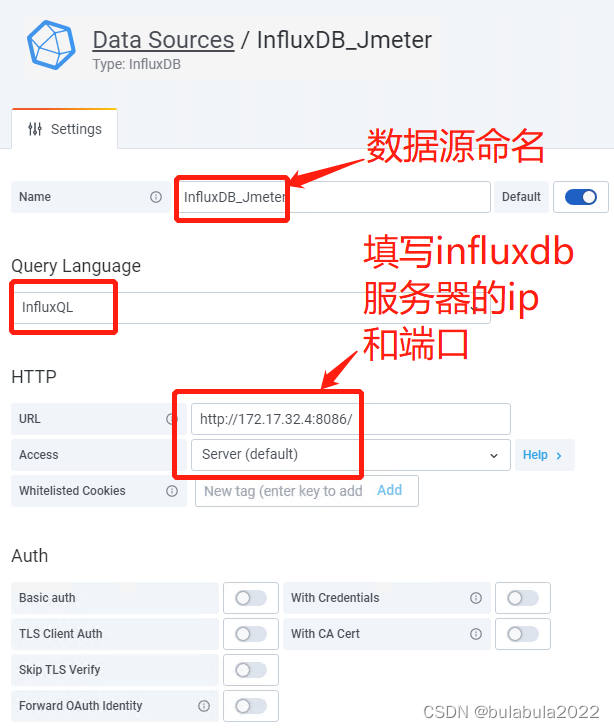
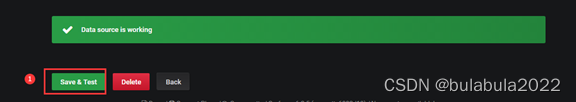
3.保存,显示Data source is working 即表示添加成功
更多可能需要待完成项
1.InfluxDB+Grafana配置监控面板
配置监控面板以及更多监控模板优化,在后续实施过程种补充
2.Jmeter+InfluxDB+Grafana三者集成,需要二次开发优化
3.jenkins+jmeter+influxdb持续集成监控
4.Prometheus+Grafana集成监控服务器(linux,wondows)
5.Prometheus+Grafana集成监控数据库(mysql,PostgreSQL,oracle)
6.nmon2influxdb+grafana服务监控可视化部署
二次优化或者开发,待解决的问题
Q1:Jmeter Load Test面板-Active Users显示虚拟用户数量多1个(已实现) |
Q2:Jmeter Load Test面板-request增加模糊搜索功能(积累请求越来越多,方便搜索查找)(已实现) |
Q3:Jmeter Load Test面板-增加吞吐量实时显示面板(方便梯度压测下TPS模型趋势查看)(已实现) |
Q4:Jmeter Load Test面板-metrics overview面板下的显示实时平均吞吐量(当前手工选择运行时间参与计算)(已实现) |
Q5:Jmeter Load Test面板-增加对服务器资源消耗监控面板(已实现) |
Q6:Jmeter Load Test面板-增加对mysql/oracle/pg等数据库性能监控数据搜集(已实现) |
Q7:Jmeter Load Test面板-部分概览数据能够钻取,查看具体数据细节 |
Q8:Jmeter Load Test面板-增加根据事务显示压测数据(待对jmeter插件工具二次开发) |
Q9:Jmeter Load Test面板-下拉筛选功能新增(主要为多维度查询新增变量) |
Q9:Jmeter Load Test面板-grafana绘图配置查询变量+多级变量联动+查询结果结合应用场景配置(按照项目划分,功能细节暂未实现) 参考:https://clevercode.blog.csdn.net/article/details/104324039?utm_medium=distribute.pc_relevant.none-task-blog-2%7Edefault%7EBlogCommendFromMachineLearnPai2%7Edefault-4.base&depth_1- utm_source=distribute.pc_relevant.none-task-blog-2%7Edefault%7EBlogCommendFromMachineLearnPai2%7Edefault-4.base |
grafana历史数据查询优化() |
Grafana error日志信息实时查看() |
边栏推荐
- 时间戳strtotime前一天或后一天的日期
- 国内首家 EMQ 加入亚马逊云科技「初创加速-全球合作伙伴网络计划」
- 【 brosser le titre 】 chemise culturelle de l'usine d'oies
- Jarvis OJ shell traffic analysis
- Data verification before and after JSON to map -- custom UDF
- Writing method of twig array merging
- 养不起真猫,就用代码吸猫 -Unity 粒子实现画猫咪
- 【剑指 Offer】66. 构建乘积数组
- [61dctf]fm
- Global Data Center released DC brain system, enabling intelligent operation and management through science and technology
猜你喜欢
【刷题篇】有效的数独

Jarvis OJ Flag
If you can't afford a real cat, you can use code to suck cats -unity particles to draw cats

Android privacy sandbox developer preview 3: privacy, security and personalized experience

Benji Bananas 会员通行证持有人第二季奖励活动更新一览
Detailed explanation of use scenarios and functions of polar coordinate sector diagram
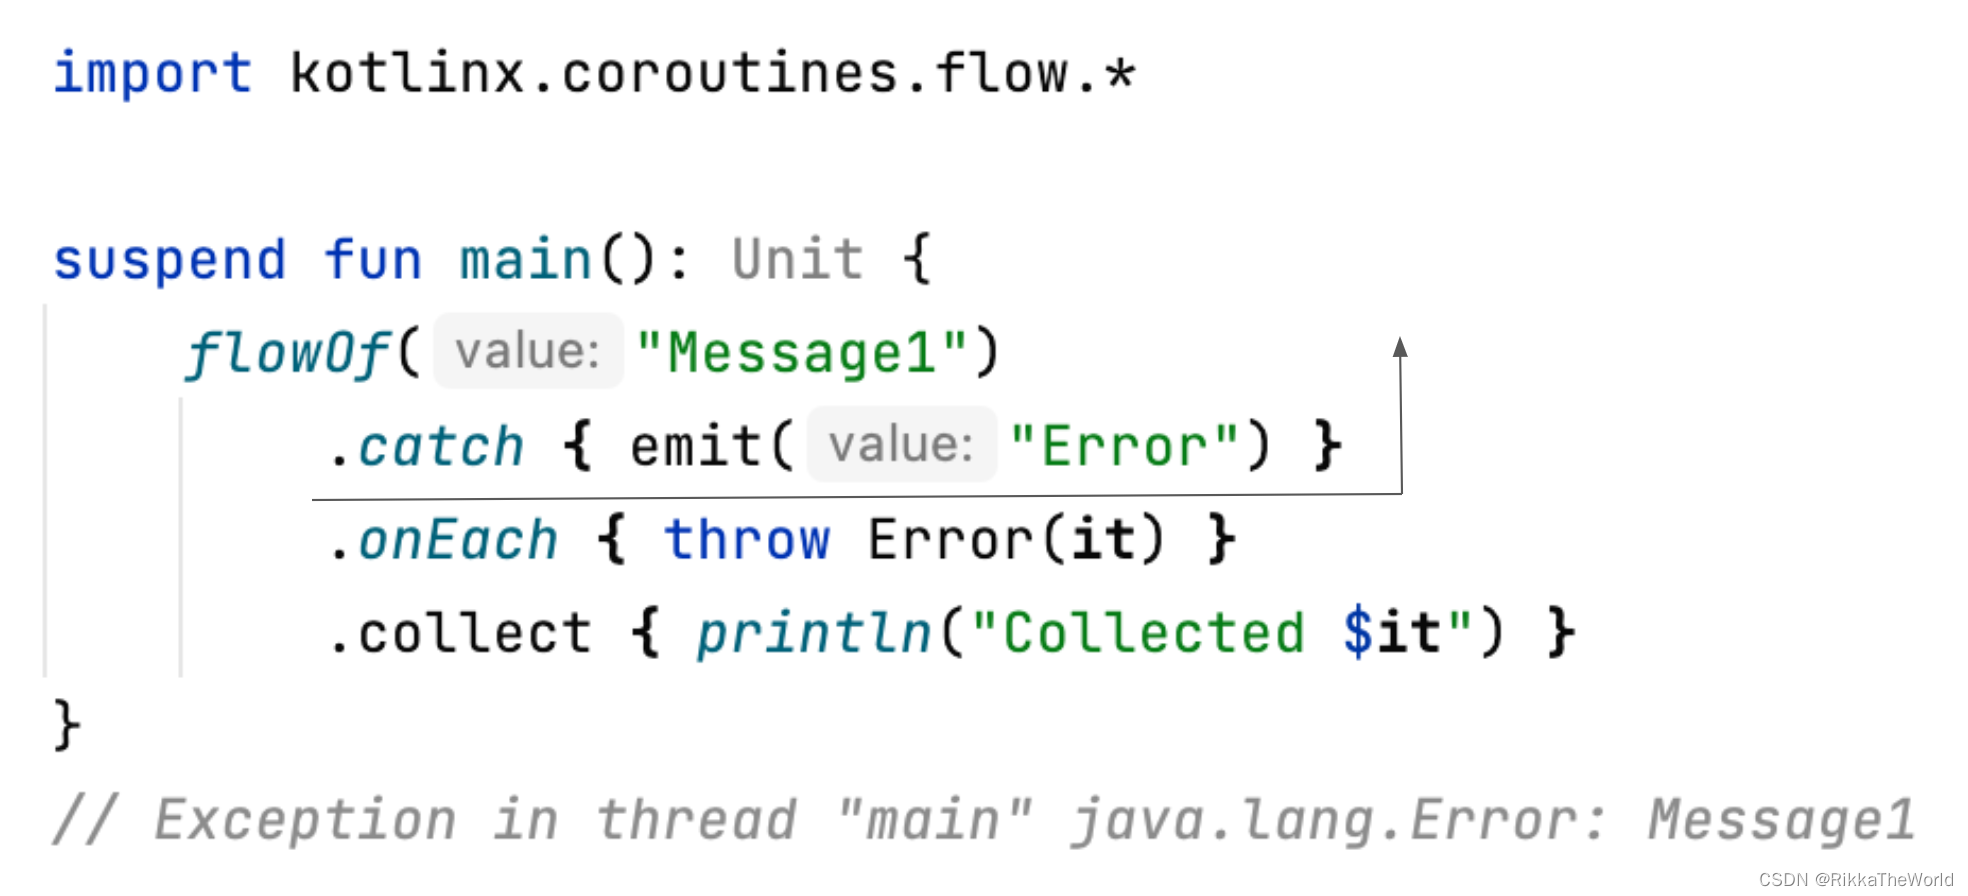
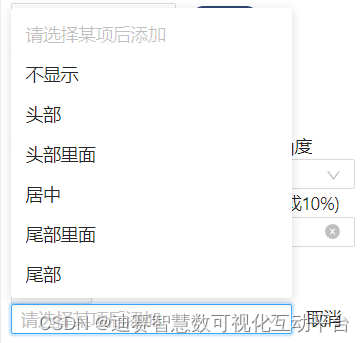
深潜Kotlin协程(二十一):Flow 生命周期函数
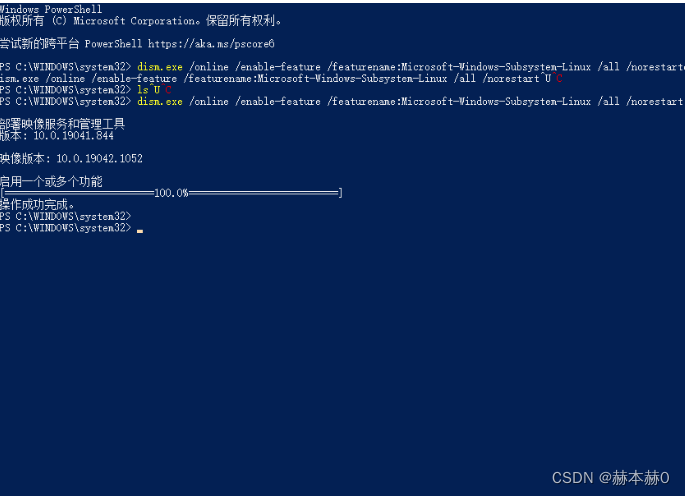
WSL2.0安装
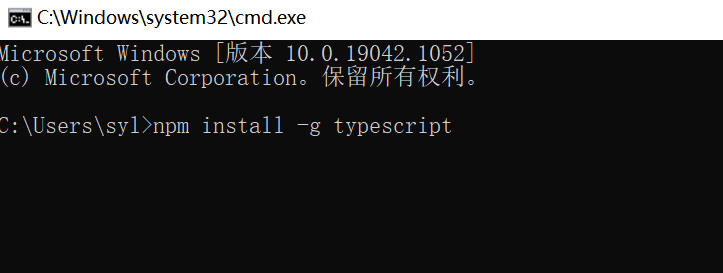
"21 days proficient in typescript-3" - install and build a typescript development environment md
How to uninstall MySQL cleanly
随机推荐
搜索 正排索引 和 倒排索引 区别
Jarvis OJ Webshell分析
[wechat applet] read the life cycle and route jump of the applet
Desci: is decentralized science the new trend of Web3.0?
[es6] 模板字符串内添加if判断或添加三元运算符判断
[深度学习][原创]让yolov6-0.1.0支持yolov5的txt读取数据集模式
Jarvis OJ 远程登录协议
Benji Banas membership pass holders' second quarter reward activities update list
composer安装报错:No composer.lock file present.
Combined use of vant popup+ other components and pit avoidance Guide
[729. My schedule I]
File operation --i/o
American chips are no longer proud, and Chinese chips have successfully won the first place in emerging fields
Sentinel flow guard
Explain in detail the functions and underlying implementation logic of the groups sets statement in SQL
[brush questions] effective Sudoku
Writing method of twig array merging
JSON转MAP前后数据校验 -- 自定义UDF
Bs-xx-042 implementation of personnel management system based on SSM
深潜Kotlin协程(二十一):Flow 生命周期函数