Peloton Stats to Google Sheets with Data Visualization through Seaborn and Plotly

Overview

Peloton Stats to Google Sheets with Data Visualization through Seaborn and Plotly

Problem: 2 peloton users were looking for a way to track their metrics in a way that was readable and available

Solution: this script. I personally run this at set intervals on a raspberry pi, so access to their data is usable at virtually all hours.

Here's how it works. The code relies on first having built a csv file which contains the headings of 'name', 'username', 'email', and 'password' (for Peloton). The script pulls data from this file and then logs into peloton. From there, it downloads the users CSV data with all of their workout data. For my specific needs, we only cared about cycling data (which you will notice in the code). Several calculations are performed and some clean up is completed on the dataframes. That data is then passed into the user's assigned Google Sheet (which also includes their interactive 'goal' cell used for pace calculations [this resets on the first of each year]. Since I am running on a raspberry pi, I use SMTP to send an email to each user at the end of the day with a daily wrap email.

The script utilizes several dependencies (noted in the code itself). One of the dependencies is based on the google sheets API. Information can be found here: https://developers.google.com/sheets/api

You might also like...
Productivity Tools for Plotly + Pandas

Cufflinks This library binds the power of plotly with the flexibility of pandas for easy plotting. This library is available on https://github.com/san

Custom Plotly Dash components based on Mantine React Components library

Dash Mantine Components Dash Mantine Components is a Dash component library based on Mantine React Components Library. It makes it easier to create go

 A Simple Flask-Plotly Example for NTU 110-1 DSSI Class
A Simple Flask-Plotly Example for NTU 110-1 DSSI Class

A Simple Flask-Plotly Example for NTU 110-1 DSSI Class Live Demo Prerequisites We will use Flask and Ploty to build a Flask application. If you haven'

A shimmer pre-load component for Plotly Dash

dash-loading-shimmer A shimmer pre-load component for Plotly Dash Installation Get it with pip: pip install dash-loading-extras Or maybe you prefer Pi

3D plotting and mesh analysis through a streamlined interface for the Visualization Toolkit (VTK)

PyVista Deployment Build Status Metrics Citation License Community 3D plotting and mesh analysis through a streamlined interface for the Visualization

3D plotting and mesh analysis through a streamlined interface for the Visualization Toolkit (VTK)

PyVista Deployment Build Status Metrics Citation License Community 3D plotting and mesh analysis through a streamlined interface for the Visualization

Create Badges with stats of Scratch User, Project and Studio. Use those badges in Github readmes, etc.

Scratch-Stats-Badge Create customized Badges with stats of Scratch User, Studio or Project. Use those badges in Github readmes, etc. Examples Document

 GitHub Stats Visualizations : Transparent
GitHub Stats Visualizations : Transparent

GitHub Stats Visualizations : Transparent Generate visualizations of GitHub user and repository statistics using GitHub Actions. ⚠️ Disclaimer The pro

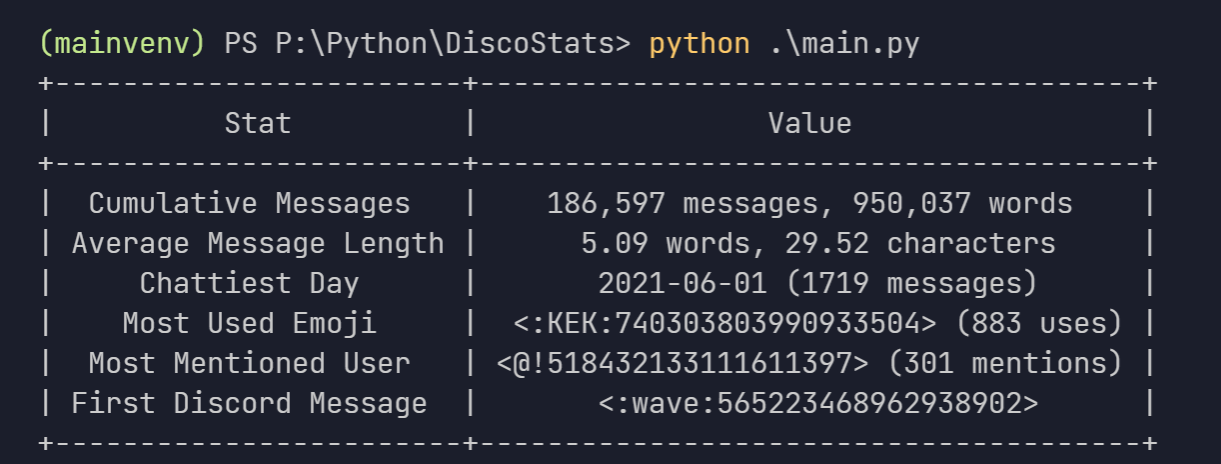
view cool stats related to your discord account.

DiscoStats cool statistics generated using your discord data. How? DiscoStats is not a service that breaks the Discord Terms of Service or Community G

Releases(v2.1.2)
  • v2.1.2(Feb 1, 2022)

    1. added a '--pause' arg to the script to facilitate the pausing for service account quota exceeded errors
    2. Initial push of a google sheet builder

    What's Changed

    • Sheet Build Initial Push by @tychaney in https://github.com/tychaney/Peloton-Data-to-Google-Sheets/pull/3

    Full Changelog: https://github.com/tychaney/Peloton-Data-to-Google-Sheets/compare/v2.1.1...v2.1.2

    Source code(tar.gz)
    Source code(zip)
  • v2.1.1(Jan 31, 2022)

    Minor bug fix from 2.1.0 Corrected the monthly pace calculation

    What's Changed

    • v 2.1.0 by @tychaney in https://github.com/tychaney/Peloton-Data-to-Google-Sheets/pull/2

    Full Changelog: https://github.com/tychaney/Peloton-Data-to-Google-Sheets/compare/v2.1.0...v2.1.1

    Source code(tar.gz)
    Source code(zip)
Resources for teaching & learning practical data visualization with python.

Practical Data Visualization with Python Overview All views expressed on this site are my own and do not represent the opinions of any entity with whi

Paul Jeffries 98 Sep 24, 2022
Generate a roam research like Network Graph view from your Notion pages.

Notion Graph View Export Notion pages to a Roam Research like graph view.

Steve Sun 214 Jan 07, 2023
A Python package for caclulations and visualizations in geological sciences.

geo_calcs A Python package for caclulations and visualizations in geological sciences. Free software: MIT license Documentation: https://geo-calcs.rea

Drew Heasman 1 Jul 12, 2022
A site that displays up to date COVID-19 stats, powered by fastpages.

https://covid19dashboards.com This project was built with fastpages Background This project showcases how you can use fastpages to create a static das

GitHub 1.6k Jan 07, 2023
This Crash Course will cover all you need to know to start using Plotly in your projects.

Plotly Crash Course This course was designed to help you get started using Plotly. If you ever felt like your data visualization skills could use an u

Fábio Neves 2 Aug 21, 2022
A simple Monte Carlo simulation using Python and matplotlib library

Monte Carlo python simulation Install linux dependencies sudo apt update sudo apt install build-essential \ software-properties-commo

Samuel Terra 2 Dec 13, 2021
Tweets your monthly GitHub Contributions as Wordle grid

Tweets your monthly GitHub Contributions as Wordle grid

Venu Vardhan Reddy Tekula 5 Feb 16, 2022
🎨 Python Echarts Plotting Library

pyecharts Python ❤️ ECharts = pyecharts English README 📣 简介 Apache ECharts (incubating) 是一个由百度开源的数据可视化,凭借着良好的交互性,精巧的图表设计,得到了众多开发者的认可。而 Python 是一门富有表达

pyecharts 13.1k Jan 03, 2023
Colormaps for astronomers

cmastro: colormaps for astronomers 🔭 This package contains custom colormaps that have been used in various astronomical applications, similar to cmoc

Adrian Price-Whelan 12 Oct 11, 2022
Visualize large time-series data in plotly

plotly_resampler enables visualizing large sequential data by adding resampling functionality to Plotly figures. In this Plotly-Resampler demo over 11

PreDiCT.IDLab 604 Dec 28, 2022
coordinate to draw the nimbus logo on the graffitiwall

This is a community effort to draw the nimbus logo on beaconcha.in's graffitiwall. get started clone repo with git clone https://github.com/tennisbowl

4 Apr 04, 2022
Simple plotting for Python. Python wrapper for D3xter - render charts in the browser with simple Python syntax.

PyDexter Simple plotting for Python. Python wrapper for D3xter - render charts in the browser with simple Python syntax. Setup $ pip install PyDexter

D3xter 31 Mar 06, 2021
CLAHE Contrast Limited Adaptive Histogram Equalization

A simple code to process images using contrast limited adaptive histogram equalization. Image processing is becoming a major part of data processig.

Happy N. Monday 4 May 18, 2022
daily report of @arkinvest ETF activity + data collection

ark_invest daily weekday report of @arkinvest ETF activity + data collection This script was created to: Extract and save daily csv's from ARKInvest's

T D 27 Jan 02, 2023
A set of useful perceptually uniform colormaps for plotting scientific data

Colorcet: Collection of perceptually uniform colormaps Build Status Coverage Latest dev release Latest release Docs What is it? Colorcet is a collecti

HoloViz 590 Dec 31, 2022
A toolkit to generate MR sequence diagrams

mrsd: a toolkit to generate MR sequence diagrams mrsd is a Python toolkit to generate MR sequence diagrams, as shown below for the basic FLASH sequenc

Julien Lamy 3 Dec 25, 2021
Print matplotlib colors

mplcolors Tired of searching "matplotlib colors" every week/day/hour? This simple script displays them all conveniently right in your terminal emulato

Brandon Barker 32 Dec 13, 2022
Automate the case review on legal case documents and find the most critical cases using network analysis

Automation on Legal Court Cases Review This project is to automate the case review on legal case documents and find the most critical cases using netw

Yi Yin 7 Dec 28, 2022
Collection of data visualizing projects through Tableau, Data Wrapper, and Power BI

Data-Visualization-Projects Collection of data visualizing projects through Tableau, Data Wrapper, and Power BI Indigenous-Brands-Social-Movements Pyt

Jinwoo(Roy) Yoon 1 Feb 05, 2022
Color scales in Python for humans

colorlover Color scales for humans IPython notebook: https://plot.ly/ipython-notebooks/color-scales/ import colorlover as cl from IPython.display impo

Plotly 146 Sep 25, 2022