92 Repositories
Latest Python Libraries
Hands-on machine learning workshop
emb-ntua-workshop This workshop discusses introductory concepts of machine learning and data mining following a hands-on approach using popular tools

A Python toolbox for gaining geometric insights into high-dimensional data
"To deal with hyper-planes in a 14 dimensional space, visualize a 3D space and say 'fourteen' very loudly. Everyone does it." - Geoff Hinton Overview
Customizing Visual Styles in Plotly
Customizing Visual Styles in Plotly Code for a workshop originally developed for an Unconference session during the Outlier Conference hosted by Data

🌌 Economics Observatory Visualisation Repository
Economics Observatory Visualisation Repository Website | Visualisations | Data | Here you will find all the data visualisations and infographics attac
Data-science-on-gcp - Source code accompanying book: Data Science on the Google Cloud Platform, Valliappa Lakshmanan, O'Reilly 2017
data-science-on-gcp Source code accompanying book: Data Science on the Google Cloud Platform, 2nd Edition Valliappa Lakshmanan O'Reilly, Jan 2022 Bran

PyMove is a Python library to simplify queries and visualization of trajectories and other spatial-temporal data
Use PyMove and go much further Information Package Status License Python Version Platforms Build Status PyPi version PyPi Downloads Conda version Cond

An open-source plotting library for statistical data.
Lets-Plot Lets-Plot is an open-source plotting library for statistical data. It is implemented using the Kotlin programming language. The design of Le

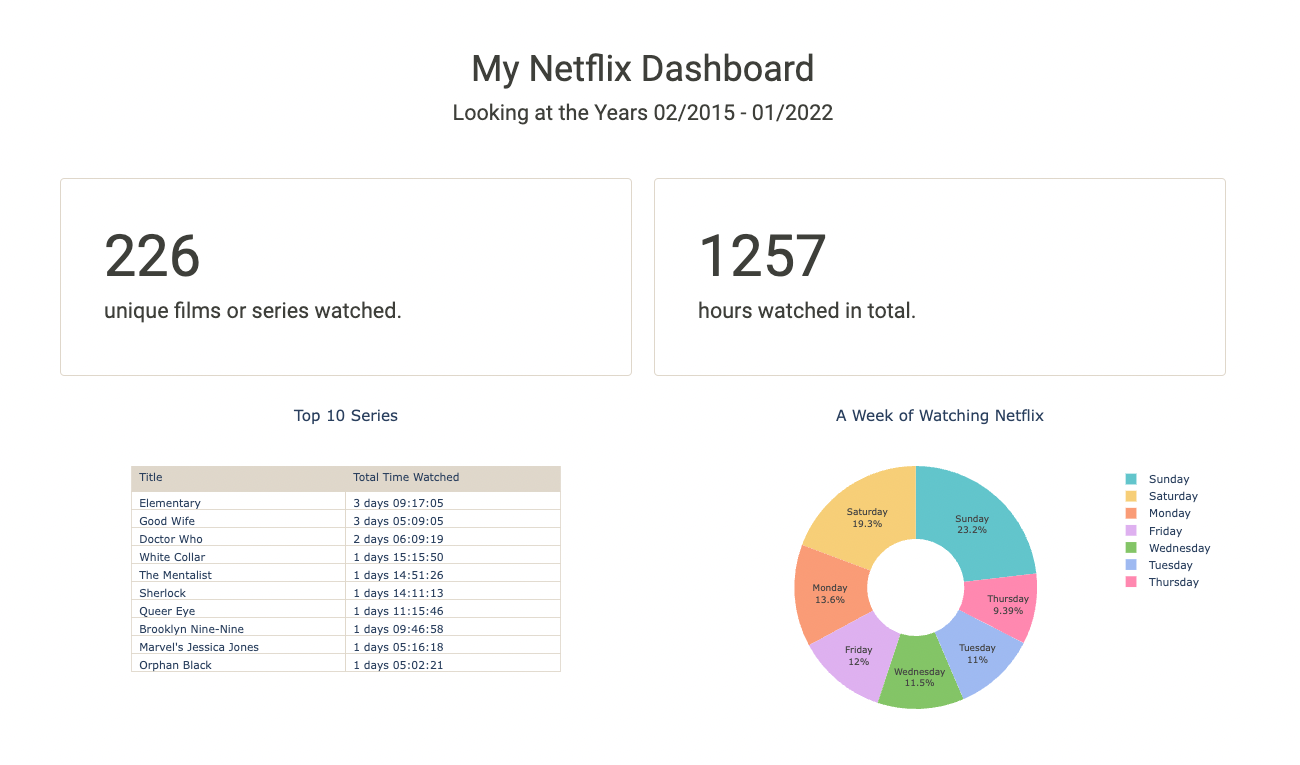
Project: Netflix Data Analysis and Visualization with Python
Project: Netflix Data Analysis and Visualization with Python Table of Contents General Info Installation Demo Usage and Main Functionalities Contribut

A visualization of people a user follows on Twitter
Twitter-Map This software allows the user to create maps of Twitter accounts. Installation git clone
12 Jul 20, 2022

LinkedIn connections analyzer
LinkedIn Connections Analyzer 🔗 https://linkedin-analzyer.herokuapp.com Hey hey 👋 , welcome to my LinkedIn connections analyzer. I recently found ou

Visualizations for machine learning datasets
Introduction The facets project contains two visualizations for understanding and analyzing machine learning datasets: Facets Overview and Facets Dive
Credit EDA Case Study Using Python
This case study aims to identify patterns which indicate if a client has difficulty paying their installments which may be used for taking actions such as denying the loan, reducing the amount of loa
Python Sreamlit Duplicate Records Finder Remover
Python-Sreamlit-Duplicate-Records-Finder-Remover Streamlit is an open-source Python library that makes it easy to create and share beautiful, custom w
Missing data visualization module for Python.
missingno Messy datasets? Missing values? missingno provides a small toolset of flexible and easy-to-use missing data visualizations and utilities tha
1900-2016 Olympic Data Analysis in Python by plotting different graphs
🔥 Olympics Data Analysis 🔥 In Data Science field, there is a big topic before creating a model for future prediction is Data Analysis. We can find o

A python-generated website for visualizing the novel coronavirus (COVID-19) data for Greece.
COVID-19-Greece A python-generated website for visualizing the novel coronavirus (COVID-19) data for Greece. Data sources Data provided by Johns Hopki

A Power BI/Google Studio Dashboard to analyze previous OTC CatchUps
OTC CatchUp Dashboard A Power BI/Google Studio dashboard analyzing OTC CatchUps. File Contents * ├───data ├───old summaries ─── *.md ├

A Python package develop for transportation spatio-temporal big data processing, analysis and visualization.
English 中文版 TransBigData Introduction TransBigData is a Python package developed for transportation spatio-temporal big data processing, analysis and

A workshop on data visualization in Python with notebooks and exercises for following along.
Beyond the Basics: Data Visualization in Python The human brain excels at finding patterns in visual representations, which is why data visualizations

An awesome Data Science repository to learn and apply for real world problems.
AWESOME DATA SCIENCE An open source Data Science repository to learn and apply towards solving real world problems. This is a shortcut path to start s
A classification model capable of accurately predicting the price of secondhand cars
The purpose of this project is create a classification model capable of accurately predicting the price of secondhand cars. The data used for model building is open source and has been added to this

Image Segmentation using U-Net, U-Net with skip connections and M-Net architectures
Brain-Image-Segmentation Segmentation of brain tissues in MRI image has a number of applications in diagnosis, surgical planning, and treatment of bra

Apache Superset is a Data Visualization and Data Exploration Platform
Superset A modern, enterprise-ready business intelligence web application. Why Superset? | Supported Databases | Installation and Configuration | Rele

Apache Superset is a Data Visualization and Data Exploration Platform
Apache Superset is a Data Visualization and Data Exploration Platform
Semi-Automated Data Processing
Perform semi automated exploratory data analysis, feature engineering and feature selection on provided dataset by visualizing every possibilities on each step and assisting the user to make a meanin

Easy genetic ancestry predictions in Python
ezancestry Easily visualize your direct-to-consumer genetics next to 2500+ samples from the 1000 genomes project. Evaluate the performance of a custom

🛰️ Scripts démontrant l'utilisation de l'imagerie RADARSAT-1 à partir d'un seau AWS | 🛰️ Scripts demonstrating the use of RADARSAT-1 imagery from an AWS bucket
🛰️ Scripts démontrant l'utilisation de l'imagerie RADARSAT-1 à partir d'un seau AWS | 🛰️ Scripts demonstrating the use of RADARSAT-1 imagery from an AWS bucket
Active Transport Analytics Model: A new strategic transport modelling and data visualization framework
{ATAM} Active Transport Analytics Model Active Transport Analytics Model (“ATAM”

PyExplainer: A Local Rule-Based Model-Agnostic Technique (Explainable AI)
PyExplainer PyExplainer is a local rule-based model-agnostic technique for generating explanations (i.e., why a commit is predicted as defective) of J

PyExplainer: A Local Rule-Based Model-Agnostic Technique (Explainable AI)
PyExplainer PyExplainer is a local rule-based model-agnostic technique for generating explanations (i.e., why a commit is predicted as defective) of J
Medical appointments No-Show classifier
Medical Appointments No-shows Why do 20% of patients miss their scheduled appointments? A person makes a doctor appointment, receives all the instruct

Dimensionality reduction in very large datasets using Siamese Networks
ivis Implementation of the ivis algorithm as described in the paper Structure-preserving visualisation of high dimensional single-cell datasets. Ivis

Implementation of the ivis algorithm as described in the paper Structure-preserving visualisation of high dimensional single-cell datasets.
Implementation of the ivis algorithm as described in the paper Structure-preserving visualisation of high dimensional single-cell datasets.

🍊 :bar_chart: :bulb: Orange: Interactive data analysis
Orange Data Mining Orange is a data mining and visualization toolbox for novice and expert alike. To explore data with Orange, one requires no program

A part of HyRiver software stack for accessing hydrology data through web services
Package Description Status PyNHD Navigate and subset NHDPlus (MR and HR) using web services Py3DEP Access topographic data through National Map's 3DEP
Proyecto - Análisis de texto de eventos históricos
Acceder al código desde Google Colab para poder ver de manera adecuada todas las visualizaciones y poder interactuar con ellas. Link de acceso: https:
Proyecto - Desgaste y rendimiento de empleados de IBM HR Analytics
Acceder al código desde Google Colab para poder ver de manera adecuada todas las visualizaciones y poder interactuar con ellas. Links de acceso: Noteb
Functions for easily making publication-quality figures with matplotlib.
Data-viz utils 📈 Functions for data visualization in matplotlib 📚 API Can be installed using pip install dvu and then imported with import dvu. You
Exploratory Data Analysis of the 2019 Indian General Elections using a dataset from Kaggle.
2019-indian-election-eda Exploratory Data Analysis of the 2019 Indian General Elections using a dataset from Kaggle. This project is a part of the Cou

DataAnalysis: Some data analysis projects in charles_pikachu
DataAnalysis DataAnalysis: Some data analysis projects in charles_pikachu You can star this repository to keep track of the project if it's helpful fo
Datapane is the easiest way to create data science reports from Python.
Datapane Teams | Documentation | API Docs | Changelog | Twitter | Blog Share interactive plots and data in 3 lines of Python. Datapane is a Python lib

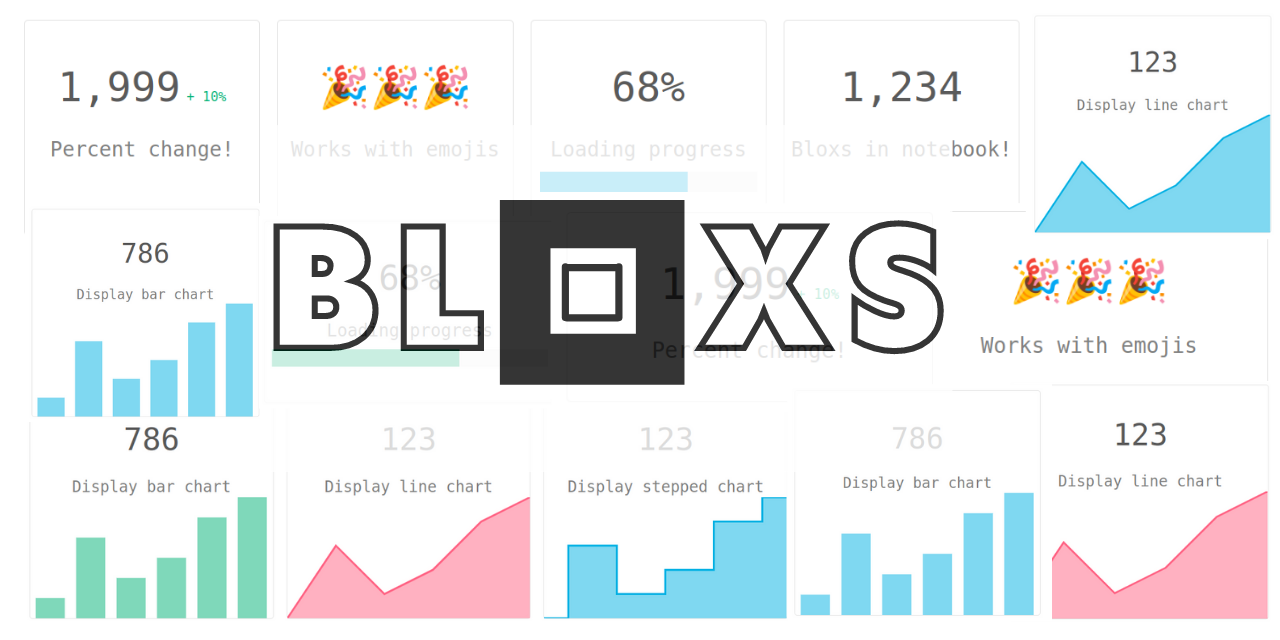
Display your data in an attractive way in your notebook!
Bloxs Bloxs is a simple python package that helps you display information in an attractive way (formed in blocks). Perfect for building dashboards, re

Data science, Data manipulation and Machine learning package.
duality Data science, Data manipulation and Machine learning package. Use permitted according to the terms of use and conditions set by the attached l

Using Selenium with Python to Web Scrap Popular Youtube Tech Channels.
Web Scrapping Popular Youtube Tech Channels with Selenium Data Mining, Data Wrangling, and Exploratory Data Analysis About the Data Web scrapi

Seaborn is one of the go-to tools for statistical data visualization in python. It has been actively developed since 2012 and in July 2018, the author released version 0.9. This version of Seaborn has several new plotting features, API changes and documentation updates which combine to enhance an already great library. This article will walk through a few of the highlights and show how to use the new scatter and line plot functions for quickly creating very useful visualizations of data.
12_Python_Seaborn_Module Introduction 👋 From the website, “Seaborn is a Python data visualization library based on matplotlib. It provides a high-lev

A web app builds using streamlit API with python backend to analyze and pick insides from multiple data formats.
Data-Analysis-Web-App Data Analysis Web App can analysis data in multiple formates(csv, txt, xls, xlsx, ods, odt) and gives shows you the analysis in

Evidence enables analysts to deliver a polished business intelligence system using SQL and markdown.
Evidence enables analysts to deliver a polished business intelligence system using SQL and markdown
Visualize and compare datasets, target values and associations, with one line of code.
In-depth EDA (target analysis, comparison, feature analysis, correlation) in two lines of code! Sweetviz is an open-source Python library that generat
Streaming pivot visualization via WebAssembly
Perspective is an interactive visualization component for large, real-time datasets. Originally developed for J.P. Morgan's trading business, Perspect

A command line tool for visualizing CSV/spreadsheet-like data
PerfPlotter Read data from CSV files using pandas and generate interactive plots using bokeh, which can then be embedded into HTML pages and served by

Create UIs for prototyping your machine learning model in 3 minutes
Note: We just launched Hosted, where anyone can upload their interface for permanent hosting. Check it out! Welcome to Gradio Quickly create customiza

An interactive dashboard for visualisation, integration and classification of data using Active Learning.
AstronomicAL An interactive dashboard for visualisation, integration and classification of data using Active Learning. AstronomicAL is a human-in-the-
🧇 Make Waffle Charts in Python.
PyWaffle PyWaffle is an open source, MIT-licensed Python package for plotting waffle charts. It provides a Figure constructor class Waffle, which coul
HyperSpy is an open source Python library for the interactive analysis of multidimensional datasets
HyperSpy is an open source Python library for the interactive analysis of multidimensional datasets that can be described as multidimensional arrays o

Example Code Notebooks for Data Visualization in Python
This repository contains sample code scripts for creating awesome data visualizations from scratch using different python libraries (such as matplotli

Implementation of SOMs (Self-Organizing Maps) with neighborhood-based map topologies.
py-self-organizing-maps Simple implementation of self-organizing maps (SOMs) A SOM is an unsupervised method for learning a mapping from a discrete ne

High performance, editable, stylable datagrids in jupyter and jupyterlab
An ipywidgets wrapper of regular-table for Jupyter. Examples Two Billion Rows Notebook Click Events Notebook Edit Events Notebook Styling Notebook Pan
General Assembly's 2015 Data Science course in Washington, DC
DAT8 Course Repository Course materials for General Assembly's Data Science course in Washington, DC (8/18/15 - 10/29/15). Instructor: Kevin Markham (

Learn Blockchains by Building One, A simple Blockchain in Python using Flask as a micro web framework.
Blockchain ✨ Learn Blockchains by Building One Yourself Installation Make sure Python 3.6+ is installed. Install Flask Web Framework. Clone this repos
