Today we will analyze a classic paper :Practial Lessons from Predicting Clicks on Ads at Facebook. From this paper We can see that , This article paper The author is Facebook Our advertising team . This is an article that will GBDT And LR The model combines with the method of advertising click through rate prediction , Although it has been several years since , But the method in this paper is still not completely out of date , There are still some small companies still using .
This article paper Very, very classic , Can be said to be recommend 、 A must read article in the field of advertising , It's not too much to say that it's common sense in the industry . The quality of this article is very high , The content is also more basic , It's a great way to get started paper.
This article is a little long , It's suggested to look after the horse first .
brief introduction
paper The first part briefly introduces the status of advertising in the Internet industry and then Facebook The scale of , at that time Facebook with 7.5 The daily life of 100 million ( Daily active user daily active users), More than a million effective advertisers , So for Facebook It's very important to choose the right and effective advertising for users . On this basis, it leads to Facebook Innovative approach to , the GBDT Combined with logistic regression model , In real-world data scenarios, more than 3% Revenue .
stay 2007 In the year Google and Yahoo This paper puts forward the advertising charging mechanism of online bidding , however Facebook It's different from the search engine scene , In the search engine scene , Users will have a clear search intention . The engine will first screen ads according to the user's search intention , So the candidate ad set won't be big . however Facebook There is no such strong intention information , therefore Facebook The number of advertising candidates is much larger , Therefore, the pressure and requirements for the system should be higher .
But this article (paper) It's not about the system , Just focus on the last part of the sorting model . although paper It doesn't say , But we can see that ,Google and Yahoo The advertisement in this kind of search engine is search advertisement , and Facebook These ads are recommendation ads . The biggest difference between the latter and the former is that the logic of recall advertising is not the same , It's sort of like the difference between a recommendation system and a search system .
The core of this is user intent , Although the user logs in Facebook When there is no strong intention , But according to the user's previous browsing behavior and habits , We can extract some weak intentions . For example, what kind of products users stay on the longest , What kind of content you click on the most times , There is a similar collaborative filtering approach that abstracts user behavior into vectors . In fact, there are a lot of contents in it , It's also very valuable , so Facebook When I wrote the paper, I left a hand .
specific working means
After that, let's take a look at the details , Many students may have heard of it, that is GBDT+LR How to do it . It seems that a sentence is finished , But there are a lot of details in it . For example, why use GBDT, Why? GBDT It works ? What is the effective mechanism in this ?paper It's just superficial , Thinking and analyzing these details is the key . because paper It's not universal , But the truth behind it is often universal .
First of all, let's talk about model evaluation ,paper There are two new ways to evaluate the model . One is Normalized Entropy, The other is Calibration. Let's start with model evaluation .
Normalized Entropy
This indicator is quite commonly used in actual scenarios , Often in the code of various gods and paper I see . Normalized entropy means normalized entropy , The meaning has changed a little , Can be interpreted as Normalized cross entropy . It is determined by the cross entropy mean of the sample and the background CTR The ratio of cross entropy is calculated .
background CTR It refers to the experience of training sample set samples CTR, Can be understood as the average click through rate . But pay attention here , It's not a proportion of positive and negative samples . Because we do it before training models sampling , For example, according to the ratio of positive and negative samples 1:3 sampling , The background here CTR It should be set as the ratio before sampling . Let's assume that the ratio is p, So we can write NE Formula :
here The value is
, That is to say, the click is +1, No clicks are -1. This is paper The formula inside , In practical application , We're average click It's written in 1,impression( No, click) It's written as 0.
Calibration
Calibration Calibrate the scale , But here I think it should be understood as a deviation from the baseline . This indicator is The average predicted by the model CTR And background CTR The ratio of the , The closer this ratio is 1, The smaller the benchmark deviation of our model is , The closer we get to the real situation .
This formula can be written as :
AUC
AUC It's a cliche , It's us too The most commonly used indicator in industry , There is hardly one .AUC We have introduced in the previous article , It means Aera-Under-ROC, That is to say ROC Area enclosed by curve .ROC The curve is TPR(true postive rate) and FPR(false positive rate) The curves that make up . The larger the area of the curve, the stronger the ability of the model to distinguish positive and negative samples , stay CTR Sort the scene , In fact, whether the model can predict accurately is not the most important , The ability to sift out positive samples is the most important , This is also AUC Why it's so important .

however AUC Nor is it without drawbacks ,paper One of the disadvantages is listed . For example, if we predict by the model CTR All x2, And then multiply all the predictions by 0.5 To calibrate , such AUC There will still be no change . But if we look at NE Words , Will find NE rose .
Combination model
Finally, it's the big picture , Although this article paper It talks about a lot of other aspects , But we all know that GBDT+LR That's the point .GBDT and LR We are all familiar with , But how about the two of them combine Together ?
In fact, the problem itself is wrong , So-called GBDT+LR It's not a combination of the two models , It's a transformation of characteristics . In other words, we need to think about this problem from the perspective of characteristics, not from the model .
paper First of all, I will talk about two common methods to deal with features , The first is called bin, That is to say Points barrels It means . For example, income , It's a continuous feature . If we put it in the model , What the model learns is a weight , In other words, it works linearly . But in the actual scenario , Maybe it's not linear at all . For example, the brands that the rich like and the poor may be totally different , We hope that the model can learn nonlinear effects . A better way is to This feature is artificially divided into buckets , For example, divide adult income according to income 3 Less than ten thousand ,3 Wan to 10 Ten thousand ,10 Wan to 50 Ten thousand , and 50 Over ten thousand. . In which bucket , Which bucket is marked with 1, Otherwise, it is marked as 0.
The second method is called Feature combination , This is easy to understand , For example, gender is a category , Whether it is a high-income group is a category . Let's arrange and combine , You can get men _ low-income , male _ High-income , Woman _ Low income and women _ The four categories of high income . If it's a continuous feature , It can be used like kd-tree This kind of data structure is discretized . We can get more features by crossing category features in pairs , But not all of these features are useful , Some may not work , Some may be useful, but the data is sparse . So while this can produce a lot of features , however You need to manually filter , A lot of it is ineffective .
Because it's too much work to manually filter features , The revenue is not high , So engineers began to think about a problem : Is there any way to automatically filter features ? Now we all know that neural networks can be used to do automatic feature crossover and filtering , But neural networks didn't emerge at that time , So it can only be done manually . To solve this problem , The engineers at that time thought of GBDT.
This is where there will be GBDT+LR Why , Let's take a look at this picture :
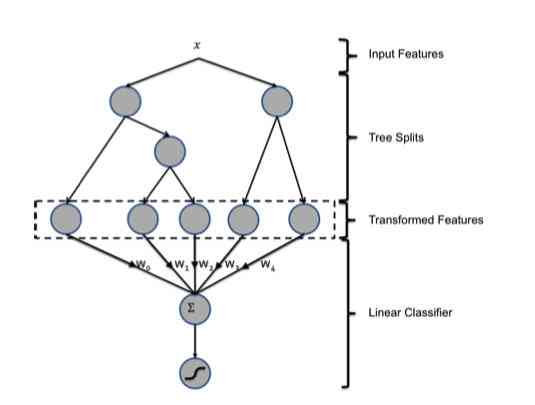
Let's briefly review GBDT Model of , First GBDT It's a forest model made up of many trees . For each sample , It will fall on one of the leaf nodes of each subtree when it is predicted . So we can use it GBDT To map features , Let's take an example :
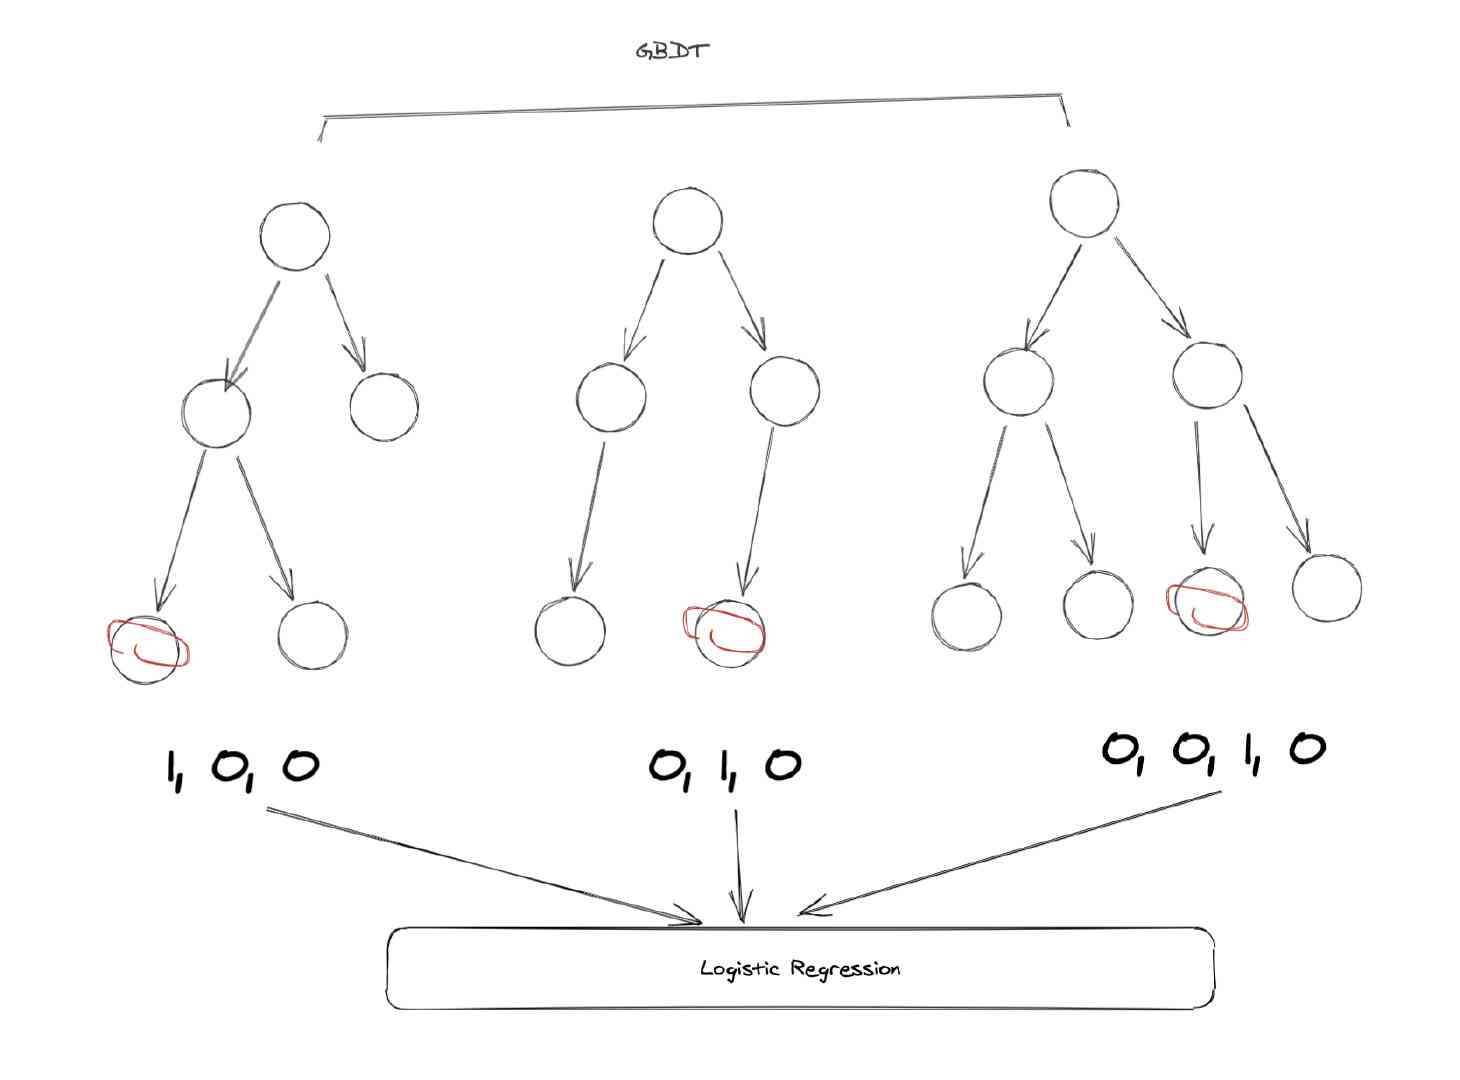
In the example above ,GBDT Altogether 3 Kezi tree , The first tree has 3 A leaf node . Our sample fell to the first , So the first subtree corresponds to one-hot The result is [1, 0, 0], The second tree also has 3 Nodes , The sample falls into the second node , therefore one-hot The result is [0, 1, 0], In the same way, the result of the third subtree is [0, 0, 1, 0].
So we finally merge the vectors of these trees together , You get a new vector :[1, 0, 0, 0, 1, 0, 0, 0, 1, 0], This vector is us LR Model input .
Let's analyze the details , First of all, make it clear ,GBDT It's just used for feature transformation and processing , Its prediction doesn't matter . By using GBDT We have completed the two operations mentioned just now , The continuous feature is transformed into discrete feature , It also automatically completes the intersection of features . Because for every subtree , In fact, it is a tree in essence CART The decision tree implemented by the algorithm , In other words, the link from the root to the leaf node represents a potential rule . So we can approximate it as using GBDT Instead of manual rule extraction and feature processing .
result
Finally, let's look at the results , primary paper Three groups of experiments were carried out , There are only LR、 have only GBDT and GBDT+LR Contrast . The standard of measurement is their own NE, With NE maximal Trees-only As a reference , You can find GBDT+LR Of the group NE Declined 3.4%.
We put on paper The result is :
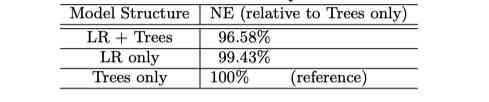
How to put it? , This result is quite a coincidence , Because the contrast is NE, In other words, the cross entropy has decreased . however AUC I don't know ,paper It doesn't say . And this decline is due to NE The biggest result is for reference , There's a little bit of artificial exaggeration . And of course this is also paper The usual means , If only we knew what we knew .
The real-time nature of data
In addition to the innovation of models and features , This article paper The function of data timeliness is also discussed .
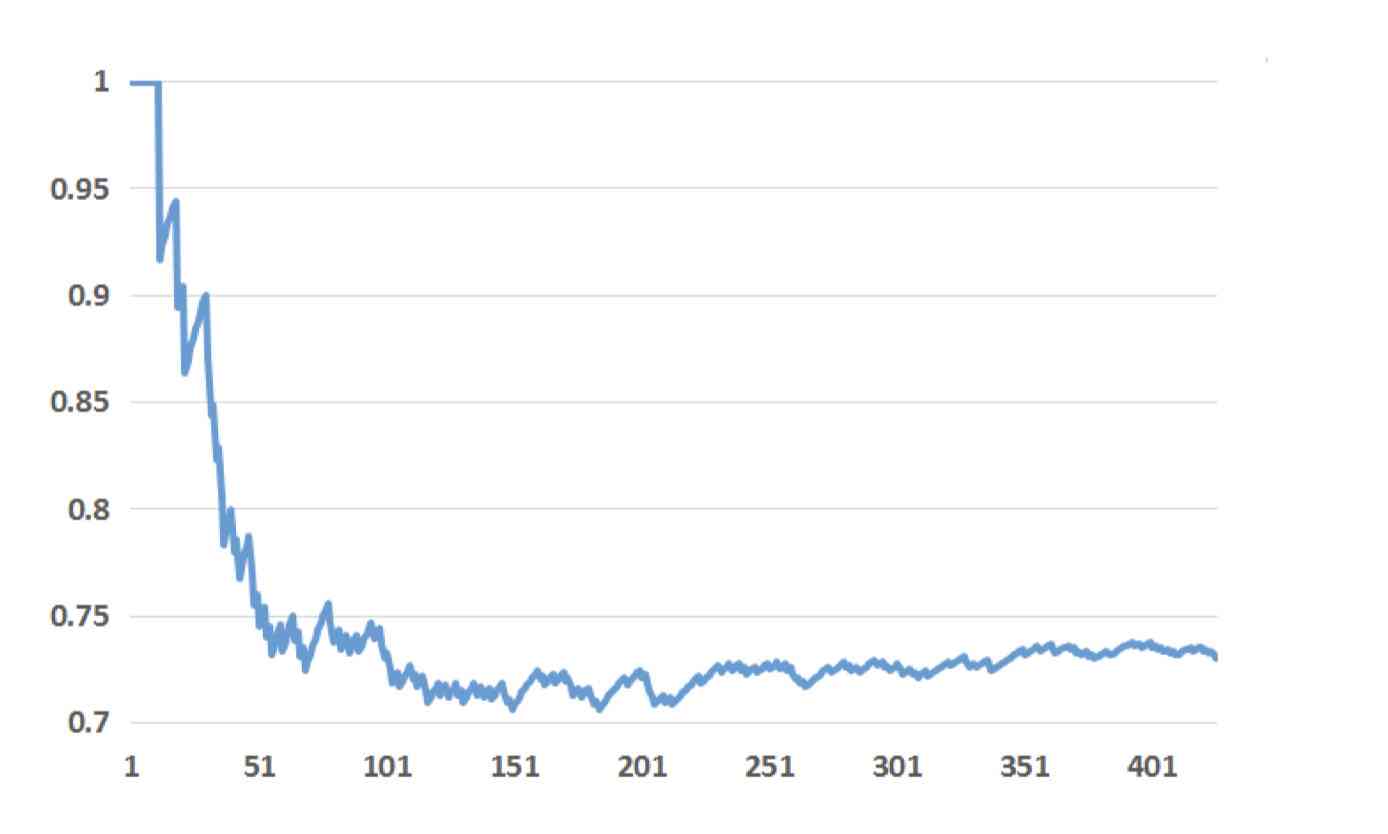
In order to verify the relationship between freshness of data and model performance ,paper Selected a piece of data for training trees-only and GBDT+LR These two models , Then use these two models to predict the future 1 Day to 6 Days of data , Chart the whole situation :
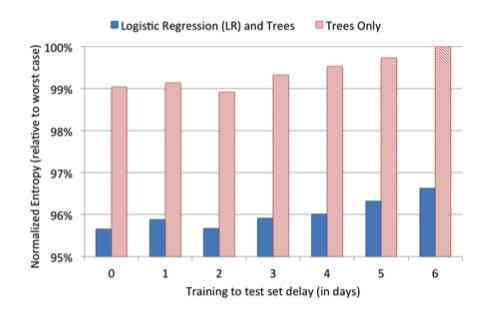
In this picture , The horizontal axis is the number of days between the predicted data and the training data , The vertical axis is the model NE.NE The lower it is, the better the model works , From the picture above, we can see the result of day 6 and the result of day 6 0 Days of NE The difference should be about 1%. That means Just keep the data fresh , We can get 1% The promotion of . That's why companies do online-learning Why .
online learning
In the following content ,paper It also introduces us to some online learning The details of . Some of them are out of date , Or it's not universal , I've chosen a few typical and representative examples .
Time window
In the process of collecting training data , Click is more specific , Because clicking has a specific behavior , however impression( Exposure ) No . Because the user doesn't click, it's not a behavior , So we can't determine whether the user wants to order or wait a moment . A more conventional approach is to maintain a timer window , Set a time , If the user sees the advertisement and doesn't click within the specified time , So think of it as a non click event .
But it's easy to find out , There's a problem with this , Because users may be slow to respond , Or it's not responding yet, resulting in no click . Maybe the time has passed , How users click . under these circumstances impression It's been recorded as a negative sample , Then the positive sample generated by clicking cannot find the corresponding impression 了 . We can calculate a ratio , How many clicks can you find impression, This ratio is called click coverage, Click through coverage .
Is that the longer the window time, the better ? It's not , because If the window is too long, it may cause some non clicking to be considered as clicking . for instance , For example, a commodity , The first time users browse, they feel dissatisfied , So there's no point . After a while , When the user looked back, he changed his mind , There was a click . So according to the principle , We should think of the first behavior without dots as a negative sample , Think of the second action as a positive sample . If we set a long time window , It's supposed to be a click sample . So how long should the time window be set , This is a parameter that needs to be adjusted , You can't beat your head to decide .
framework
streaming It is a common data processing method in the industry , It's called streaming . It can be simply understood as a queue , That is to say queue. But when it happens click We need to find the corresponding impression sample , Change it to a positive sample , So we also need to find the function . That means we need another hashmap To record the nodes in the queue .
When we get enough data , Or after collecting sample data for a specified period of time , We will use the data in the window to train the model . When the model is finished training , Will be pushed into the sorting system , Update the model files that need to be called for sorting in real time , In order to achieve the purpose of online real-time training . Let's take a look at its architecture :
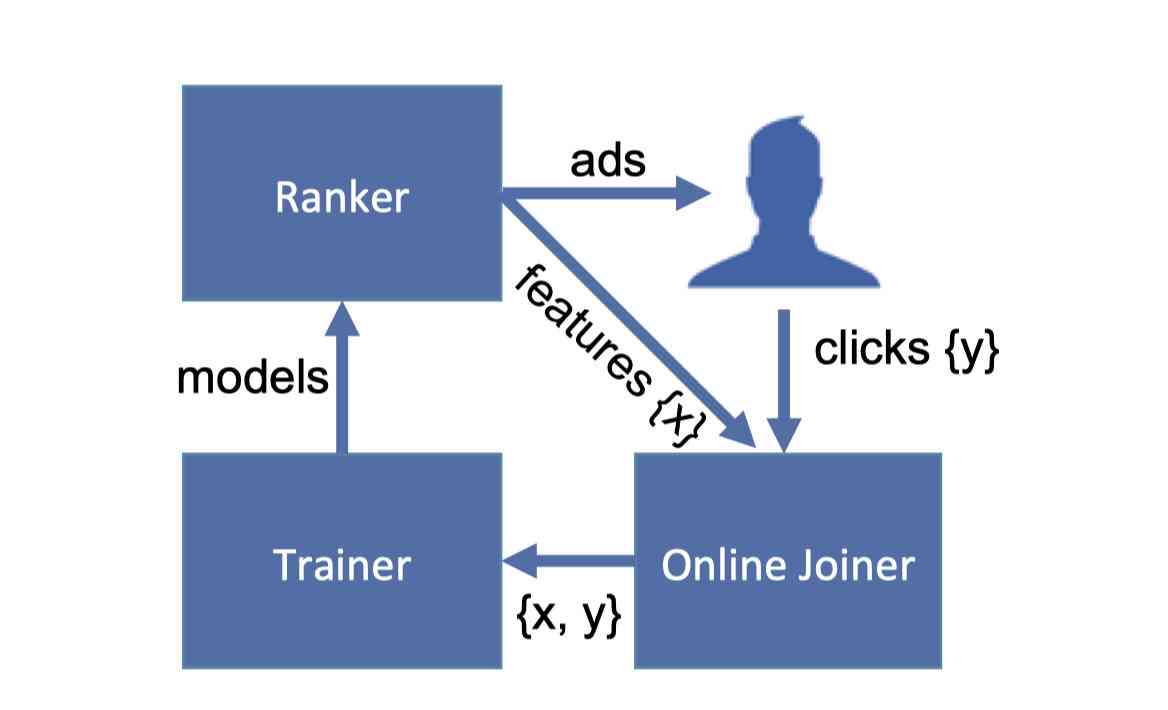
Ranker It's a sort system , The candidate ads are sorted and displayed to users , And the characteristic data of these advertisements push to online joiner, That is to say Feature processing system . When the user clicks on the ad , Click data will also be passed in Joiner among .Joiner The user's click data and Ranker The transmitted data is associated , Link and pass the data to Trainer The system trains the model .
There is also a detail involved here , Is in the joiner How do we relate to each other ? Because a user may have data to watch ads more than once , The same advertisement may refresh and watch many times . So take the user directly id Or advertising id It doesn't work to correlate , We also need a time related id. This id be called requestid, Every time the user refreshes the page ,requestid Will refresh , So we can make sure that even if users refresh the web page , We can also correlate the data correctly .
Characteristics analysis
Last ,paper It also includes some analysis of the features . Although we don't know what features they all use , But the contents of these analyses still have reference significance for us .
behavior characteristics or Contextual features
stay CTR In the estimated scenario , There are two main features , One is Contextual features , One is User history behavior characteristics . The so-called contextual features , It's actually a big concept . It's like the message of the advertisement on display , User information , And the time of the day 、 What's on the page 、 The location of the user, and so on, can be regarded as context information . The characteristics of historical behavior are also well understood , That is, the user's previous behavior within the platform .
paper It focuses on the importance of user behavior characteristics , One way to do this is to invert the features according to their importance , And then calculate in topK Among the important features, the proportion of user's historical behavior characteristics . stay LR In the model , The importance of the feature is equivalent to the weight of the corresponding position , The results are as follows :
We can see from the above figure that , The historical behavior characteristics of users occupy a very large weight in the whole .top20 Of feature among , Only 2 One is context feature . It's also in line with our understanding , The quality of the content we deliver is far less important than what users like . And the data of user's behavior in history can reflect user's preference very well .
Importance analysis
Besides analyzing the importance of features ,paper It also experimented with prediction using only one type of feature , Compare the performance of the model . The results of the experiment are as follows :
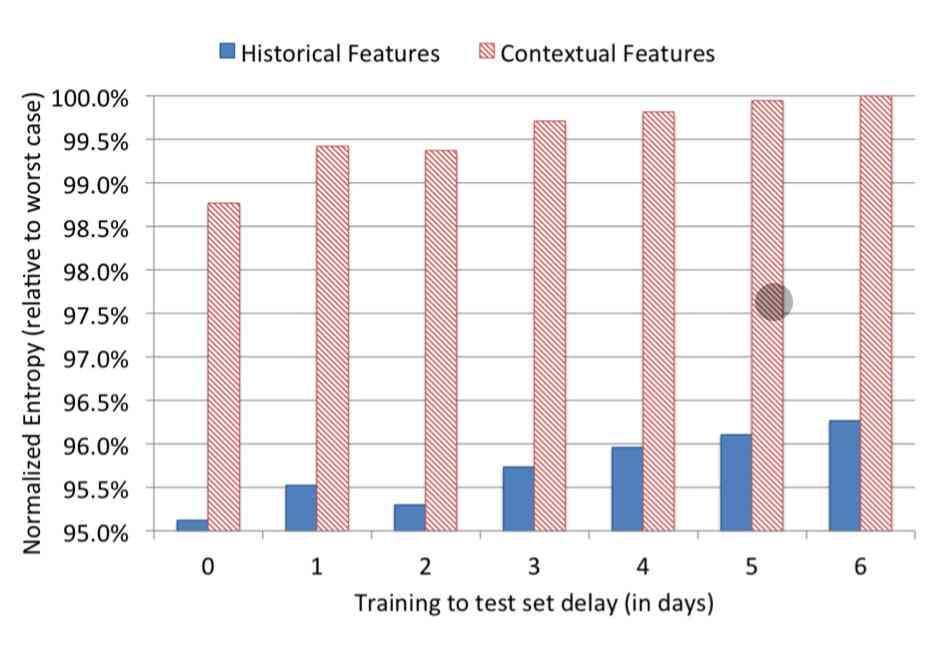
In the picture above, the red column shows the training results using only context features , Dark blue is the result of training using only user behavior characteristics . From this result, we can clearly see that , Models trained only with behavioral features perform better than those trained with contextual features, at least 3.5 A little bit , It's a very big gap . So we can also come to the conclusion , Compared to context features , User behavior characteristics are more useful .
besides ,paper It also discusses negative down sampling( Negative sampling ) and subsampling( Second sampling ) Impact on model performance . among The second sampling proves that the training data is directly proportional to the effect of the model , In other words, the larger the amount of training data , The better the model works . Negative sampling is also helpful to improve the effect of the model , It's also a common method in the current advertising and recommendation scenarios .
Today's article is here , I wish you every day something to gain . If you still like today's content , One, please Three companies support Well ~( give the thumbs-up 、 Focus on 、 forward )
Link to the original text , Ask for attention
This article USES the mdnice Typesetting