当前位置:网站首页>机器学习笔记 - 使用机器学习进行鸟类物种分类
机器学习笔记 - 使用机器学习进行鸟类物种分类
2022-07-06 20:48:00 【坐望云起】
一、问题概述
科学家们已经确定,一种已知的鸟类应该分为 3 个不同且独立的物种。这些物种是该国特定地区的特有物种,必须尽可能精确地跟踪和估计它们的种群。
因此,一个非营利性的保护协会承担了这项任务。他们需要能够根据现场官员在野外观察到的特征记录他们遇到的物种。
使用某些遗传特征和位置数据,您能预测已观察到的鸟类种类吗?
这是一个初学者级别的练习比赛,你的目标是根据属性或位置预测鸟类的种类。
二、数据集
数据已方便地拆分为训练和测试数据集。在每次训练和测试中,您都会获得位置 1 到 3 的鸟类数据。
数据集下载地址
链接:https://pan.baidu.com/s/1aalzQNr0IQLQc3X4JTu9nQ
提取码:xvy0
下面来看看前五行training_set.csv
| bill_depth | bill_length | wing_length | location | mass | sex | ID |
| 14.3 | 48.2 | 210 | loc_2 | 4600 | 0 | 284 |
| 14.4 | 48.4 | 203 | loc_2 | 4625 | 0 | 101 |
| 18.4 | NA | 200 | loc_3 | 3400 | 0 | 400 |
| 14.98211382 | 47.50487805 | NA | NA | 4800 | 0 | 98 |
| 18.98211382 | 38.25930705 | 217.1869919 | loc_3 | 5200 | 0 | 103 |
training_set和training_target可以根据‘id’列关联。
列的含义如下
species      : 动物种类 (A, B, C)
bill_length : 喙长 (mm)
bill_depth   : 喙深 (mm)
wing_length : 翼长 (mm)
mass         : 体重 (g)
location     : 岛型 (Location 1, 2, 3 )
性别         :动物性别(0:男性;1:女性;NA:未知)
三、编写代码
1、导入库
import pandas as pd

# plotting
import matplotlib
import matplotlib.pyplot as plt
import seaborn as sns
matplotlib.rcParams['figure.dpi'] = 100
sns.set(rc={'figure.figsize':(11.7,8.27)})
sns.set(style="whitegrid")
%matplotlib inline

# ml
from sklearn.metrics import ConfusionMatrixDisplay, classification_report
from sklearn.model_selection import train_test_split
from sklearn.impute import SimpleImputer
from sklearn.preprocessing import LabelEncoder
from sklearn.tree import DecisionTreeClassifier
from sklearn import tree
2、处理缺失值的方法
def missing_vals(df):
    """prints out columns with perc of missing values"""
    missing = [
        (df.columns[idx], perc)
        for idx, perc in enumerate(df.isna().mean() * 100)
        if perc > 0
    ]

    if len(missing) == 0:
        return "no missing values"


    # sort desc by perc
    missing.sort(key=lambda x: x[1], reverse=True)

    print(f"There are a total of {len(missing)} variables with missing values\n")

    for tup in missing:
        print(str.ljust(f"{tup[0]:<20} => {round(tup[1], 3)}%", 1))
3、加载数据
首先,我们使用 read_csv 函数加载训练和测试数据。
我们还将 training_set.csv(包含特征)与 training_target.csv(包含目标变量)合并并形成训练数据。
train = pd.read_csv("dataset/training_set/training_set.csv")
labels = pd.read_csv("dataset/training_set/training_target.csv")

# join target variable to training set
train = train.merge(labels, on="ID")

test = pd.read_csv("dataset/test_set/test_set.csv")
target_cols = "species"
num_cols = ["bill_depth", "bill_length", "wing_length", "mass"]
cat_cols = ["location", "sex"]
all_cols = num_cols + cat_cols + [target_cols]

train = train[all_cols]
4、探索性数据分析Exploratory Data Analysis (EDA)
这是我们研究数据趋势和模式的地方,包括数字和分类。
train.info()使用 info 函数,我们可以看到行数和数据类型。
<class 'pandas.core.frame.DataFrame'>
Int64Index: 435 entries, 0 to 434
Data columns (total 7 columns):
 #   Column       Non-Null Count  Dtype
---  ------       --------------  -----
 0   bill_depth   434 non-null    float64
 1   bill_length  295 non-null    float64
 2   wing_length  298 non-null    float64
 3   mass         433 non-null    float64
 4   location     405 non-null    object
 5   sex          379 non-null    float64
 6   species      435 non-null    object
dtypes: float64(5), object(2)
memory usage: 27.2+ KB
Numerical
让我们绘制数值变量的直方图。
train[num_cols].hist(figsize=(20, 14));
bill_depth 在 15 和 19 左右达到峰值
纸币长度在 39 和 47 左右达到峰值
翼长在 190 和 216 左右达到峰值
质量向右倾斜
Categorical
to_plot = cat_cols + [target_cols]
fig, axes = plt.subplots(1, 3, figsize=(20, 7), dpi=100)

for i, col_name in enumerate(train[to_plot].columns):
    sns.countplot(x = col_name, data = train, palette="Set1", ax=axes[i % 3])
    axes[i % 3].set_title(f"{col_name}", fontsize=13)
    plt.subplots_adjust(hspace=0.45)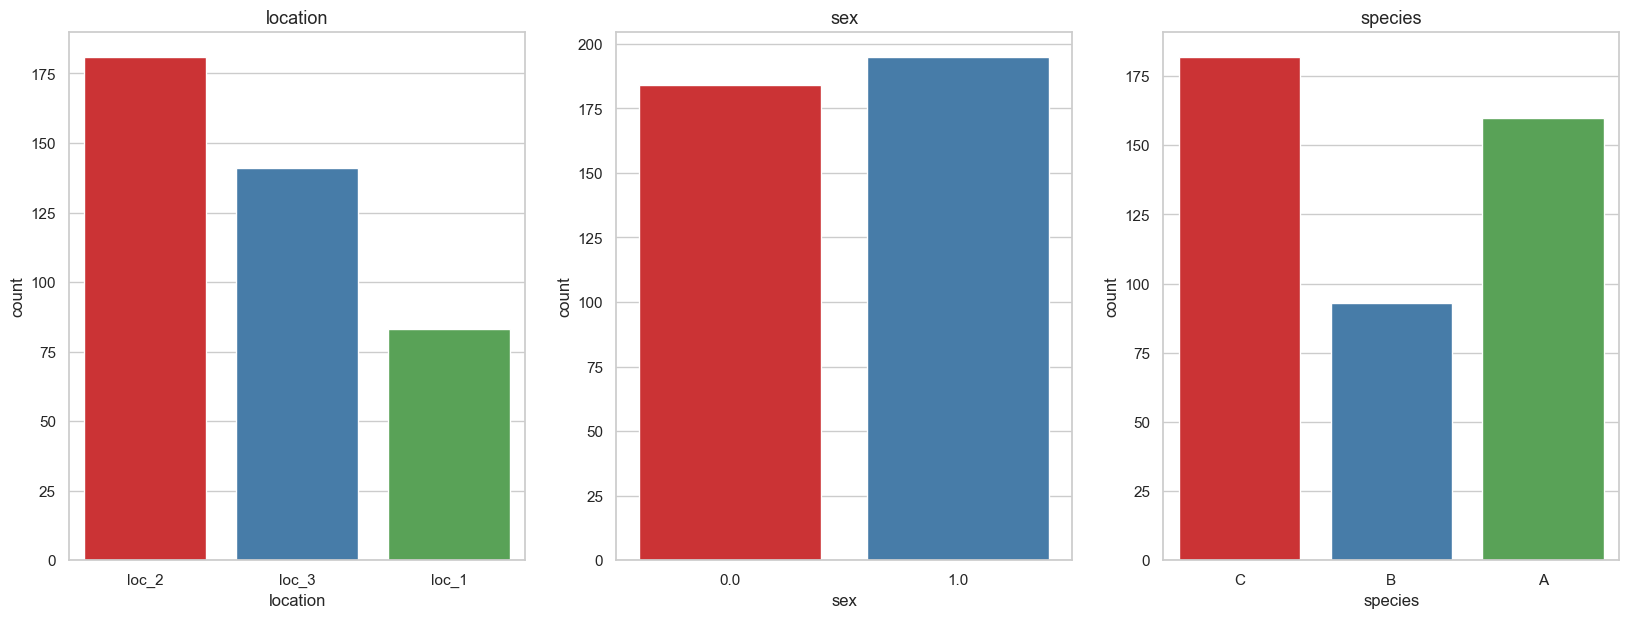
我们看到位置和物种似乎与它们各自的位置和物种相匹配(loc2 和物种 C、loc3 和物种 A)。 我们还看到雌性 (1) 鸟类比雄性鸟类略多。
train.species.value_counts()C 182
A 160
B 93
Name: species, dtype: int64仔细观察,我们发现目标变量是不平衡的,其中 B 类比 C 低近 100 个类,比 A 低大约 70 个。
不平衡类是一个问题,因为它使模型偏向于更重视具有更多样本的类,即。 C 比 B 更经常被预测。
5、缺失数据
缺失值的百分比
missing_vals(train)There are a total of 6 variables with missing values
bill_length => 32.184%
wing_length => 31.494%
sex => 12.874%
location => 6.897%
mass => 0.46%
bill_depth => 0.23%通过我们的辅助函数,我们发现 bill_length 和wing_length 有超过 30% 的缺失值
热图Heatplot
plt.figure(figsize=(10, 6))
sns.heatmap(train.isnull(), yticklabels=False, cmap='viridis', cbar=False);
我们还可以绘制热图以可视化缺失值并查看是否有任何模式。
估算分类列
让我们先看看我们的分类变量中有多少缺失变量
train.sex.value_counts(dropna=False)1.0 195
0.0 184
NaN 56
Name: sex, dtype: int64train.location.value_counts(dropna=False)loc_2 181
loc_3 141
loc_1 83
NaN 30
Name: location, dtype: int64让我们使用简单的 imputer 来处理它们,用最频繁的值替换它们。
cat_imp = SimpleImputer(strategy="most_frequent")

train[cat_cols] = cat_imp.fit_transform(train[cat_cols])
再次确认,已经没有缺失值了。如您所见,通过“最频繁”策略,缺失值被估算为 1.0,这是最频繁的。
train.sex.value_counts(dropna=False)1.0 251
0.0 184
Name: sex, dtype: int64估算数值列
让我们使用中值来估算我们的数值
num_imp = SimpleImputer(strategy="median")

train[num_cols] = num_imp.fit_transform(train[num_cols])missing_vals(train)'no missing values'6、特征工程
train.species.value_counts()C 182
A 160
B 93
Name: species, dtype: int64编码分类变量
使用标签编码器,我们可以将分类变量(和目标变量)编码为数值。 我们这样做是因为大多数 ML 模型不适用于字符串值。
le = LabelEncoder()
le.fit(train['species'])
le_name_map = dict(zip(le.classes_, le.transform(le.classes_)))
le_name_map
{'A': 0, 'B': 1, 'C': 2}我们可以先把编码器拟合到变量上,然后查看映射是什么样子的,这样以后我们就可以反转映射了
train['species'] = le.fit_transform(train['species'])对于其他具有字符串变量(非数字)的列,我们也进行相同的编码。
for col in cat_cols:
    if train[col].dtype == "object":
        train[col] = le.fit_transform(train[col])
train.head()
# Convert cat_features to pd.Categorical dtype
for col in cat_cols:
    train[col] = pd.Categorical(train[col])
我们还将分类特征转换为 pd.Categorical dtype
train.dtypesbill_depth float64
bill_length float64
wing_length float64
mass float64
location category
sex category
species int64
dtype: object7、创建新特征
train['b_depth_length_ratio'] = train['bill_depth'] / train['bill_length']
train['b_length_depth_ratio'] = train['bill_length'] / train['bill_depth']
train['w_length_mass_ratio'] = train['wing_length'] / train['mass']
在这里,我们创建一些具有除法的特征以形成变量的比率
train.head()
8、模型
训练测试拆分
现在是构建模型的时候了,我们首先将其拆分为 X(特征)和 y(目标变量),然后将其拆分为训练集和评估集。
训练是我们训练模型的地方,评估是我们在将模型拟合到测试集之前对其进行测试的地方。
X, y = train.drop(["species"], axis=1), train[["species"]].values.flatten()

X_train, X_eval, y_train, y_eval = train_test_split(
    X, y, test_size=0.25, random_state=0)
简单的决策树分类器
在这里,我们使用 max_depth = 2 的简单超参数拟合基线模型
dtree_model = DecisionTreeClassifier(max_depth = 2).fit(X_train, y_train)拟合数据后,我们可以使用它来进行预测
dtree_pred = dtree_model.predict(X_eval)9、模型性能
print(classification_report(dtree_pred, y_eval)) precision recall f1-score support
0 1.00 0.70 0.82 57
1 0.71 0.92 0.80 13
2 0.75 1.00 0.86 39
accuracy 0.83 109
macro avg 0.82 0.87 0.83 109
weighted avg 0.88 0.83 0.83 109分类报告向我们展示了分类器的有用指标。
例如,我们模型的 f1-score 为 0.83
10、混淆矩阵
我们还可以构建一个混淆矩阵来可视化我们的分类器在什么方面做得好/坏。
# save the target variable classes
class_names = le_name_map.keys()

titles_options = [
    ("Confusion matrix, without normalization", None),
    ("Normalized confusion matrix", "true"),
]
for title, normalize in titles_options:
    fig, ax = plt.subplots(figsize=(8, 8))

    disp = ConfusionMatrixDisplay.from_estimator(
        dtree_model,
        X_eval,
        y_eval,
        display_labels=class_names,
        cmap=plt.cm.Blues,
        normalize=normalize,
        ax = ax
    )
    disp.ax_.set_title(title)
    disp.ax_.grid(False)

    print(title)
    print(disp.confusion_matrix)
Confusion matrix, without normalization
[[40 0 0]
[ 5 12 0]
[12 1 39]]
Normalized confusion matrix
[[1. 0. 0. ]
[0.29411765 0.70588235 0. ]
[0.23076923 0.01923077 0.75 ]]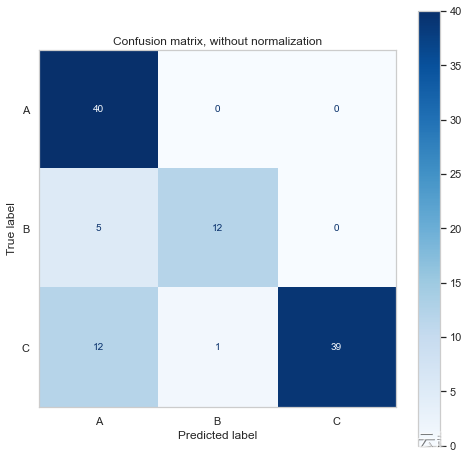
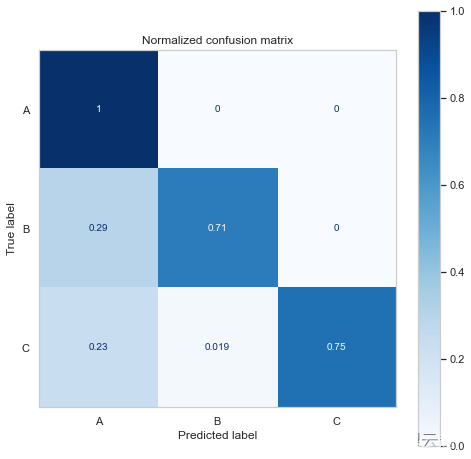
混淆矩阵向我们展示了它预测了更多的 A 类和 C 类,这并不奇怪,因为我们有更多的样本。
它还表明该模型在应该是 B/C 时预测了更多的 A 类。
11、特征重要性
feature_imp = pd.DataFrame(sorted(zip(dtree_model.feature_importances_,X.columns)), columns=['Value','Feature'])

plt.figure(figsize=(20, 15))
sns.barplot(x="Value", y="Feature", data=feature_imp.sort_values(by="Value", ascending=False))
plt.title('LightGBM Features')
plt.tight_layout()
# plt.savefig('lightgbm_fimp.png')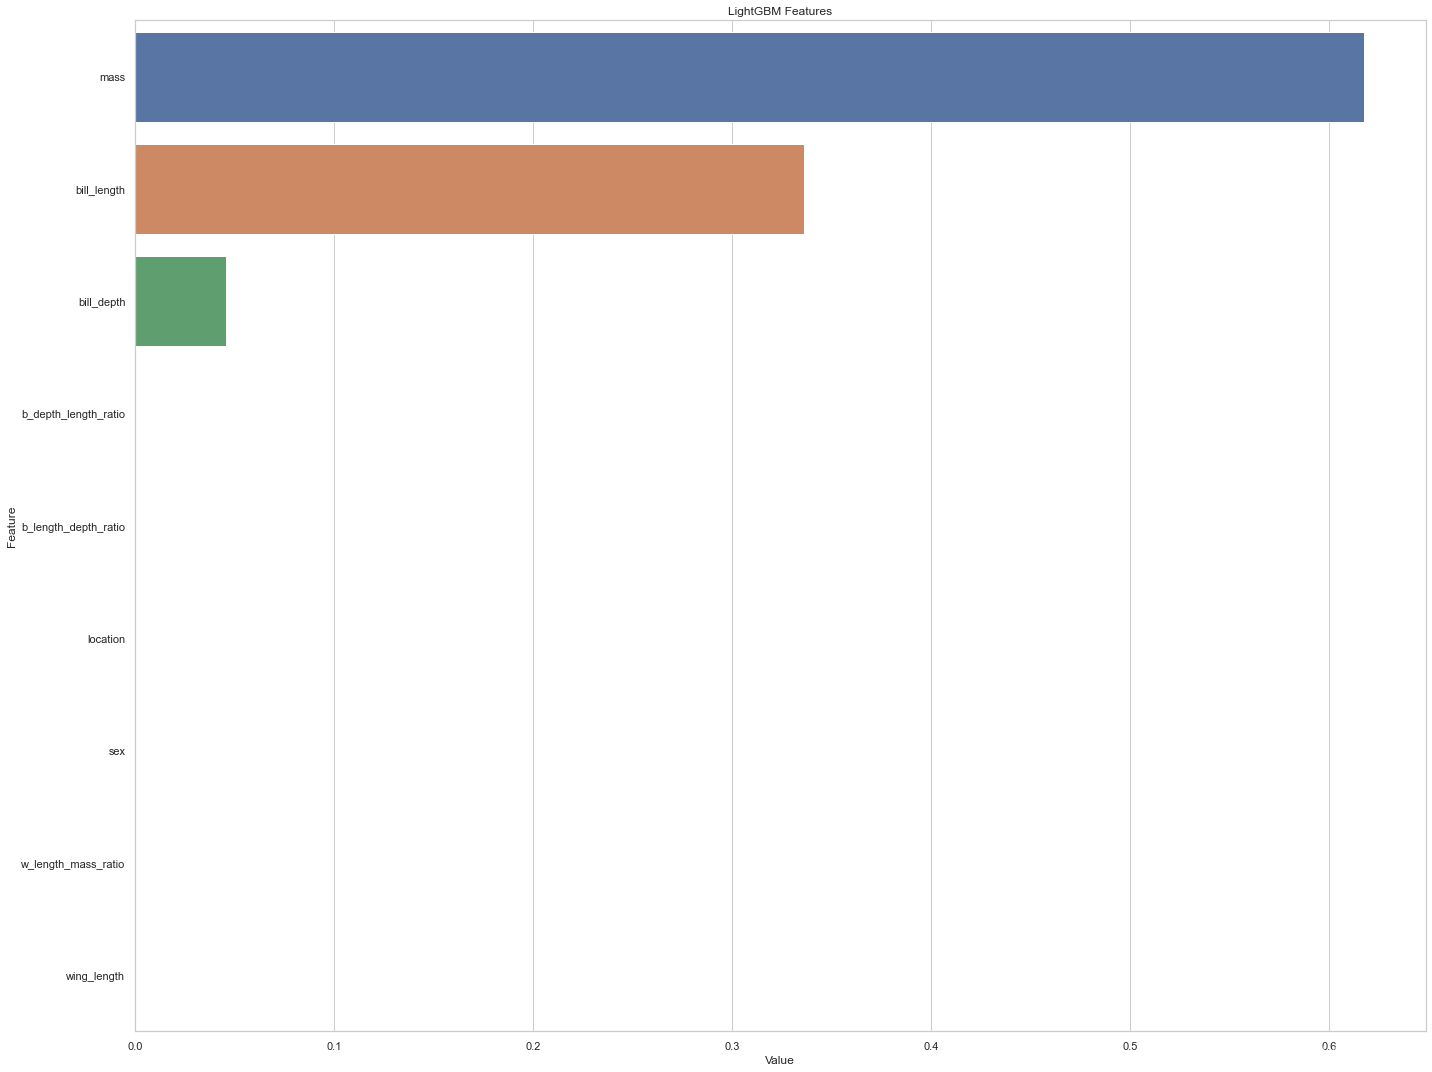
从特征重要性来看,似乎质量预测物种的能力最好,其次是喙长。 其他变量在分类器中的重要性似乎为零
fig = plt.figure(figsize=(25,20))
_ = tree.plot_tree(dtree_model,
                   feature_names=X.columns,
                   class_names=list(class_names),
                   filled=True)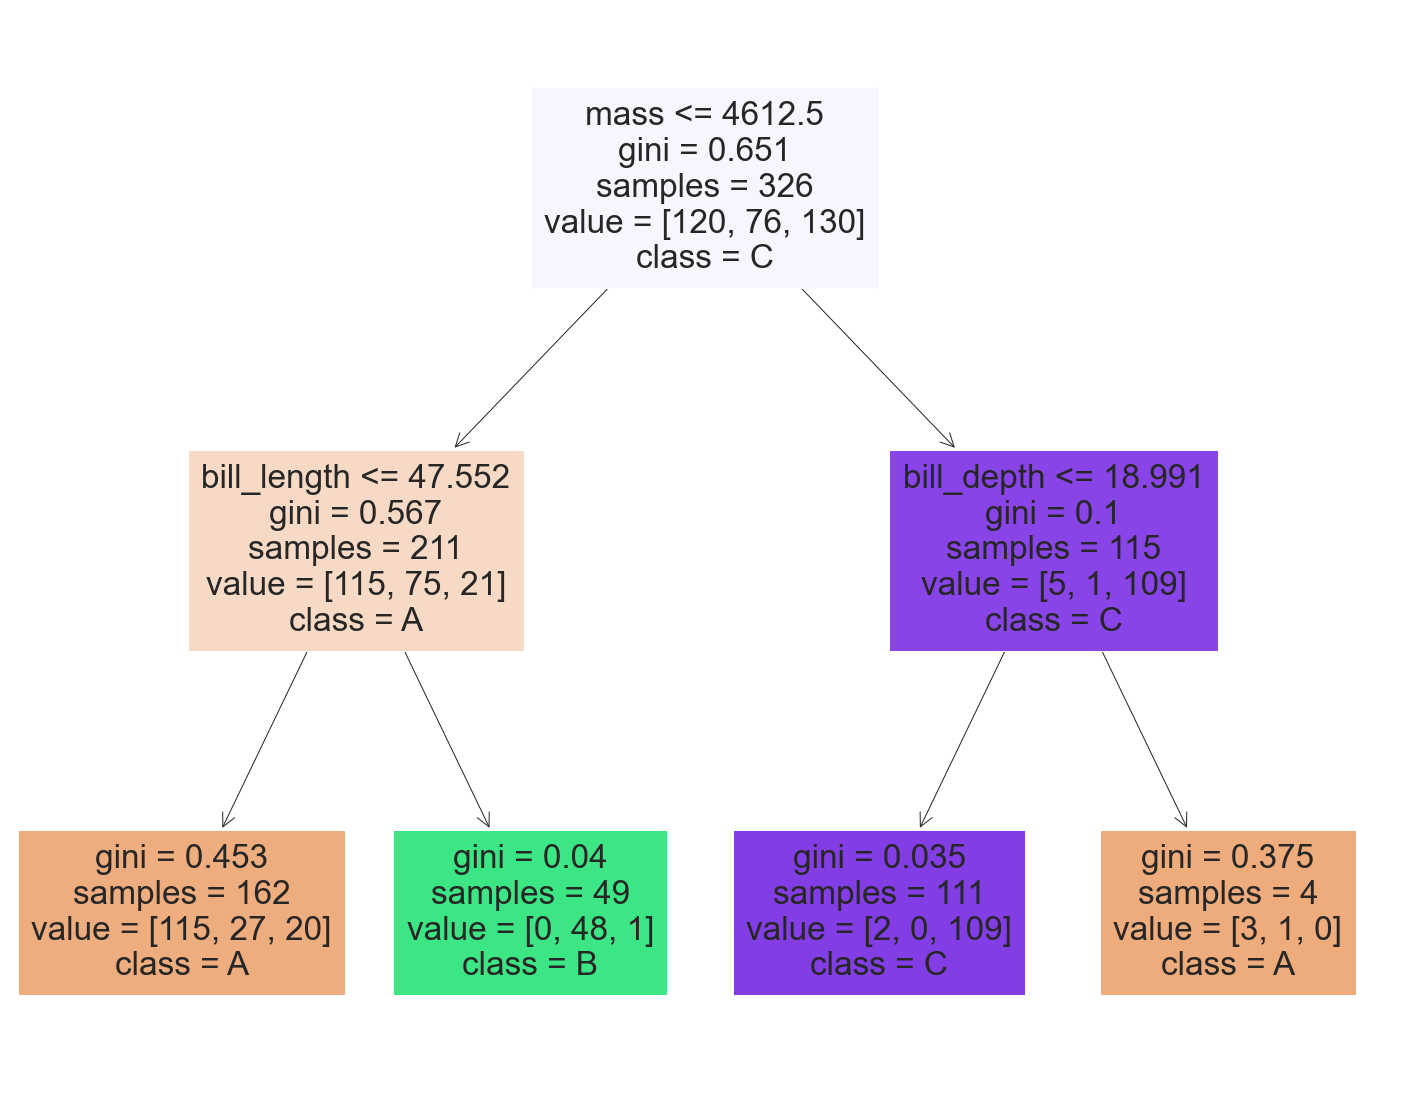
我们看到了在我们的决策树分类器的可视化中如何使用特征重要性。
在根节点中,如果质量低于 4600 左右,则检查 bill_length,否则检查 bill_depth,然后在叶处预测类别。
四、预测测试数据
现在是时候在我们将模型拟合到测试数据之前,对训练数据进行相同的特征预处理和工程了。
le = LabelEncoder()

cat_imp = SimpleImputer(strategy="most_frequent")
num_imp = SimpleImputer(strategy="median")

test[cat_cols] = cat_imp.fit_transform(test[cat_cols])
test[num_cols] = num_imp.fit_transform(test[num_cols])

for col in cat_cols:
    if test[col].dtype == "object":
        test[col] = le.fit_transform(test[col])

# Convert cat_features to pd.Categorical dtype
for col in cat_cols:
    test[col] = pd.Categorical(test[col])

# save ID column
test_id = test["ID"]

all_cols.remove('species')
test = test[all_cols]

test['b_depth_length_ratio'] = test['bill_depth'] / test['bill_length']
test['b_length_depth_ratio'] = test['bill_length'] / test['bill_depth']
test['w_length_mass_ratio'] = test['wing_length'] / test['mass']
test_preds = dtree_model.predict(test)
submission_df = pd.concat([test_id, pd.DataFrame(test_preds, columns=['species'])], axis=1)
submission_df.head()| ID | species | |
|---|---|---|
| 0 | 2 | 2 |
| 1 | 5 | 0 |
| 2 | 7 | 0 |
| 3 | 8 | 0 |
| 4 | 9 | 0 |
请注意,物种值是数字,我们必须将其转换回字符串值。 使用之前带有 fit 的标签编码器,我们可以这样做。
le_name_map{'A': 0, 'B': 1, 'C': 2}inv_map = {v: k for k, v in le_name_map.items()}
inv_map{0: 'A', 1: 'B', 2: 'C'}submission_df['species'] = submission_df['species'].map(inv_map)
submission_df.head()| ID | species | |
|---|---|---|
| 0 | 2 | C |
| 1 | 5 | A |
| 2 | 7 | A |
| 3 | 8 | A |
| 4 | 9 | A |
submission_df.to_csv('solution.csv', index=False)最后,我们将数据框写入 csv 文件。
边栏推荐
- 太方便了,钉钉上就可完成代码发布审批啦!
- Shangsilicon Valley JVM Chapter 1 class loading subsystem
- 数学归纳与递归
- Flink task exit process and failover mechanism
- 24. (ArcGIS API for JS) ArcGIS API for JS point modification point editing (sketchviewmodel)
- About Estimation Statistics
- 23.(arcgis api for js篇)arcgis api for js椭圆采集(SketchViewModel)
- How to replace the backbone of the model
- Do you know the five most prominent advantages of E-bidding?
- 20. (ArcGIS API for JS) ArcGIS API for JS surface collection (sketchviewmodel)
猜你喜欢

复杂因子计算优化案例:深度不平衡、买卖压力指标、波动率计算

24. (ArcGIS API for JS) ArcGIS API for JS point modification point editing (sketchviewmodel)

Search of linear table

R数据分析:cox模型如何做预测,高分文章复现
未来发展路线确认!数字经济、数字化转型、数据...这次会议很重要
【安全攻防】序列化与反序列,你了解多少?

Construction of Hisilicon universal platform: color space conversion YUV2RGB

树莓派设置静态ip

20. (ArcGIS API for JS) ArcGIS API for JS surface collection (sketchviewmodel)

编译常量、ClassLoader类、系统类加载器深度探析
随机推荐
QT 项目 表格新建列名称设置 需求练习(找数组消失的数字、最大值)
【达梦数据库】添加自动收集统计信息的任务
CMB's written test - quantitative relationship
Clock in during winter vacation
About Estimation Statistics
[untitled]
【C语言】 题集 of Ⅸ
C# Task拓展方法
Restcloud ETL Community Edition June featured Q & A
[security attack and Defense] how much do you know about serialization and deserialization?
编译常量、ClassLoader类、系统类加载器深度探析
Jericho is in non Bluetooth mode. Do not jump back to Bluetooth mode when connecting the mobile phone [chapter]
Depth analysis of compilation constants, classloader classes, and system class loaders
存储过程与函数(MySQL)
API data interface of A-share index component data
[safe office and productivity application] Shanghai daoning provides you with onlyoffice download, trial and tutorial
Can the applet run in its own app and realize live broadcast and connection?
HMS core machine learning service creates a new "sound" state of simultaneous interpreting translation, and AI makes international exchanges smoother
Under the tide of "going from virtual to real", Baidu AI Cloud is born from real
VHDL implementation of arbitrary size matrix addition operation