stay PHP-FPM Use in Xdebug There should be a lot of people , And in the Swoole Use in Xdebug There are still very few people , as a result of Swoole The extension explicitly states and Xdebug Expansion conflict
But it's awesome for our community members , Provides a Sdebug , Here we should thank @mabu233 and @huanghantao Compatible with , Give Way Xdebug Can be used for Swoole Environment break point 、 debugging
Before that Swoole The document added Sdebug Installation , alike Sdebug Of README It has also been modified to introduce how to install , But it's all about how to load the extension successfully , There is no detailed description of the configuration
Let's talk about how to install Sdebug
for fear of Swoole Detection of Xdebug Warning , So the name of the extended registration is Sdebug
git clone [email protected]:swoole/sdebug.git -b sdebug_2_9 --depth=1
cd sdebug
phpize
./configure
make clean
make
make install
The steps are simple , Namely clone Source code , Go into the directory and compile
If your PHP It's a universal installation , No modification of the default location, etc , You can also directly run the script under the directory :
./rebuild.sh If your phpize If it's not the default path , Please use absolute path ; alike php-config Need to use --with-php-config= Plus your absolute path
After the compilation is successful, you need to use php.ini Load extension
zend_extension=xdebug.soIt is generated after compiling so The filename is still xdebug
Check to see if the load is successful
php --ri sdebug Don't go , It's not over yet. , Some other configuration is needed , Otherwise you go to the breakpoint and you'll find it doesn't work
We still need to php.ini Add these configuration items to
xdebug.remote_enable=1
xdebug.remote_autostart=1
xdebug.remote_host=localhost
xdebug.remote_port=8000
xdebug.idekey="xdebug"
One configuration can defeat hero Han , Many people are using Sdebug When we meet the need for such a problem , It doesn't work , It's not easy to make complaints about it , Actually, it's your posture that's wrong , Configuration items are not added or added incorrectly
Need to cooperate with PhpStorm Words , It needs to be set up PhpStorm Configuration of
Preferences | Languages & Frameworks | PHP | Debug

1 It's for when we don't add breakpoints , The first line gives the breakpoint automatically
2 It's to modify the configuration remote_port port
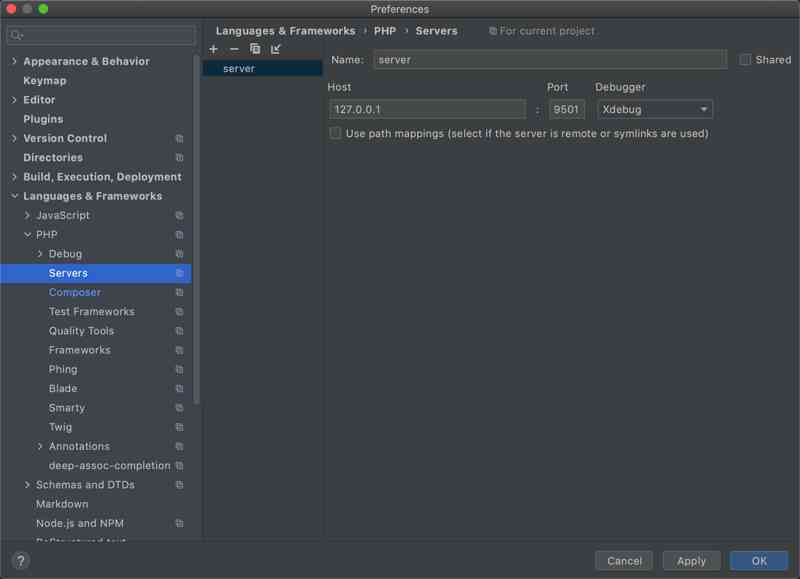
Preferences | Languages & Frameworks | PHP | Servers
Add a service

Then add a debug in the upper right corner , choice PHP Remote Debug

server Choose the one we just created server,IDE key Just fill us in php.ini Configured in xdebug
Then we'll try a wave of , Let's see if it works
Let's have a simple one first TCP Server
// establish Server object , monitor  127.0.0.1:9501  port
$server = new SwooleServer('127.0.0.1', 9501);
// Listen for connection entry events
$server->on('Connect', function ($server, $fd) {
 echo "Client: Connect.n";});
// Listen for data receiving events
$server->on('Receive', function ($server, $fd, $from_id, $data) {
 var_dump($data);
 $server->send($fd, "Server: " . $data);
});
// Listen for connection close events
$server->on('Close', function ($server, $fd) {
 echo "Client: Close.n";});
// Start the server
$server->start();
Click the green bug in the upper right corner to enter Debug state , Start our service , You'll find that it's automatically broken in the first place 4 Row creation Server Where the object is

And then the next step, the next step ...
start Then we use telnet Connect , Send a message , The breakpoint goes into Connect here , And then we'll take the next step , The terminal will output Connect
And then we'll get to var_dump The place of , You can see that $data The value of is 11111rn

And then there's one HTTP Server
$http = new SwooleHttpServer('0.0.0.0', 9501);
$http->on('request', function ($request, $response) {
 var_dump($request->server);
 $response->header("Content-Type", "text/html; charset=utf-8");
 $response->end("<h1>Hello Swoole. #".rand(1000, 9999)."</h1>");
});
$http->start();
Here we need to add a XDEBUG_SESSION_START Parameters may be in Cookie You can also add
Browser access http://127.0.0.1:9501/?XDEBUG_SESSION_START=xdebug
You can also debug breakpoints

The use of frameworks is the same , As for what else and docker Use it together and study it yourself ...
Here's a debug Hyperf The screenshots

One more Tips, Select the phone icon in the upper right corner as shown in the figure above , It will automatically start when the service is started from the command line Debug service
The original is published in Swoole Question and answer , Reprint please indicate the source .


![[paper reading notes] network embedding with attribute refinement](/img/71/760f29f8a13b366cf3bad4fb48bd63.jpg)
