当前位置:网站首页>长得很怪的箱图
长得很怪的箱图
2022-07-31 15:20:00 【Nashomon】
翻折的箱图
下面这个箱图(boxplot)有的箱体两端翻转,看起来有点怪,是不是有问题?
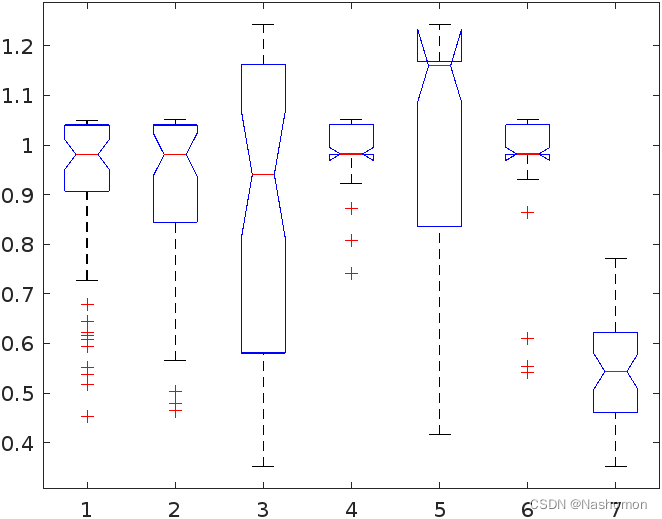
用matlab的boxplot函数画的图,Notch参数设为on时中间凹进,用python画结果一样。
% 打开excel文件,读入数据,共7列
Tbl = readtable('data.xlsx');
% table转换为矩阵
Dat = table2array(Tbl);
handle = figure();
boxplot(Dat, "Notch","on");
把Notch设为off,就是常见的箱图了。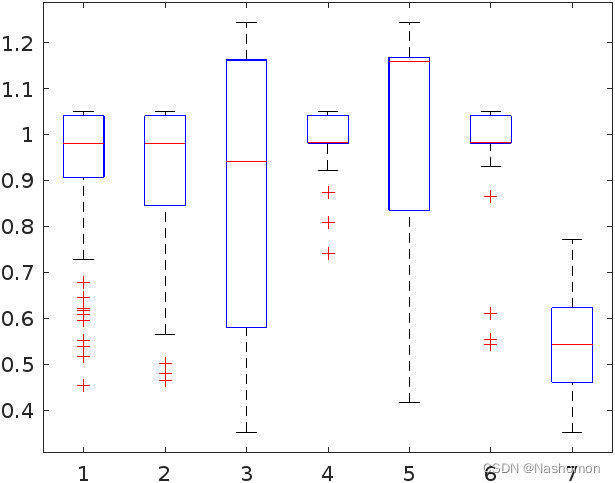
数据是这样,那画出的图也就没有问题。看着不太美观,其实更有内涵。这种图的凹进部分的高度不能改变,如果第1、3分位数低于或高于凹进区域的两端,就会出现翻叠。
SAS中的说明
SAS官方网站关于boxplot的文档中,有一个示意图边缘就是翻过来的。

凹进区域两端位置计算如下:
m e d i a n ± 1.58 ( I Q R ) n median\pm \frac{1.58(IQR)}{\sqrt{n}} median±n1.58(IQR)
其中 n n n 是样本(数据)个数。
关于这种情况,有一句说明:The medians (central lines) of the two boxes are significantly different at approximately the 0.05 level if the corresponding notches do not overlap.
边栏推荐
猜你喜欢

Getting started with UnityShader (1) - GPU and Shader

网银被盗?这篇文章告诉你如何安全使用网银
Introductory UnityShader learning (2) - the rendering pipeline

Getting started with UnityShader (3) - Unity's Shader

工程流体力学复习
《微信小程序-进阶篇》Lin-ui组件库源码分析-Icon组件

格林美瑞交所IPO:募资3.8亿美元 更多中国企业将赴欧洲上市
Grafana安装后web打开报错

The use of button controls

Synchronized and volatile interview brief summary
随机推荐
ES6 类
Deployment应用生命周期与Pod健康检查
使用 Chainlink Keepers 实现智能合约函数的自动化执行
QGIS 加载WMS数据,重新投影
border控件的使用
数据库的范式(第一范式,第二范式,第三范式,BCNF范式)「建议收藏」
TRACE32 - C source code association
mongo进入报错
自适应控制——仿真实验三 用超稳定性理论设计模型参考自适应系统
JVM参数解析 Xmx、Xms、Xmn、NewRatio、SurvivorRatio、PermSize、PrintGC「建议收藏」
How useful is four-quadrant time management?
Matlab矩阵基本操作(定义,运算)
Kubernetes原理剖析与实战应用手册,太全了
Tencent Cloud Deployment----DevOps
Linux查看redis版本(查看mongodb版本)
四象限时间管理有多好用?
力扣:738.单调递增的数字
ASP.NET Core 产生连续 Guid
国内市场上的BI软件,到底有啥区别
Use of radiobutton