当前位置:网站首页>全方位剖析Numpy中的np.diag源代码
全方位剖析Numpy中的np.diag源代码
2022-08-02 10:04:00 【舞雩.】
Numpy中内置的函数diag是一个变化莫测的函数。
这是np.diag函数的源代码:
def diag(v, k=0):
    v = asanyarray(v)
    s = v.shape
    if len(s) == 1:
        n = s[0]+abs(k)
        res = zeros((n, n), v.dtype)
        if k >= 0:
            i = k
        else:
            i = (-k) * n
        res[:n-k].flat[i::n+1] = v
        return res
    elif len(s) == 2:
        return diagonal(v, k)
    else:
        raise ValueError("Input must be 1- or 2-d.")
我们可以看出np.diag函数可以传入的参数有 v和 k。
对于v:
v是一个数组。(一维或者二维)
当v是一个一维数组时,结果形成一个以一维数组为对角线元素的矩阵;
当v是一个二维矩阵时,结果输出矩阵的对角线元素。
对于k:
k默认等于零,意味着取对角线,位置不偏移。
如果k > 0,那么取或者放对角线上面第k斜行。
如果k < 0,那么取或者放对角线下面第k斜行。
使用案例帮助理解:
假设现在有这样一个数组array:
>>> array
array([[1, 2, 3],
       [4, 5, 6],
       [7, 8, 9]])
v :二维数组,k:0
>>> np.diag(a)
array([1, 5, 9])
v:一维数组,k:0
# 把上面的array([1, 5, 9])作为输入, 即np.diag(array) = [1, 5, 9]
>>> np.diag(np.diag(a))
array([[1, 0, 0],
       [0, 2, 0],
       [0, 0, 3]])
v:二维数组,k:1
>>> np.diag(array, 1)
array([2, 6])
v:一维数组,k:1
# 把上面的array([1, 5, 9])作为输入, 即np.diag(array) = [1, 5, 9]
>>> np.diag(np.diag(array), 1)
array([0 1 0 0]
      [0 0 5 0]
      [0 0 0 9]
[0 0 0 0]])边栏推荐
- 李航《统计学习方法》笔记之感知机perceptron
- 如何封装微信小程序的 wx.request() 请求
- 基于列表的排队与叫号系统
- 未知内容监控
- Facebook自动化数据分析方案,广告投放省心省力
- 练习16-两道模拟题
- Naive Bayesian Method of Li Hang's "Statistical Learning Methods" Notes
- 牛客网项目2.7开发注册功能 报错This application has no explicit mapping for /error......
- R语言使用ggpubr包的ggtexttable函数可视化表格数据(直接绘制表格图或者在图像中添加表格数据)、设置theme主题参数自定义表格中表头内容的填充色(使用colnames.style参数)
- DirectX修复工具增强版「建议收藏」
猜你喜欢
你好,我的新名字叫“铜锁/Tongsuo”

享年94岁,图灵奖得主、计算复杂性理论先驱Juris Hartmanis逝世
周杰伦新歌发布,爬取《Mojito》MV弹幕,看看粉丝们都说的些啥!

The heavyweights are coming!Spoilers for the highlights of the Alibaba Cloud Life Science and Intelligent Computing Summit

用正向迭代器封装实现反向迭代器
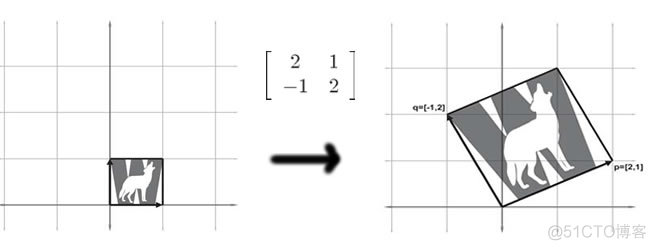
图形化矩阵,矩阵到底长什么样?

使用较广泛的安全测试工具有哪些?
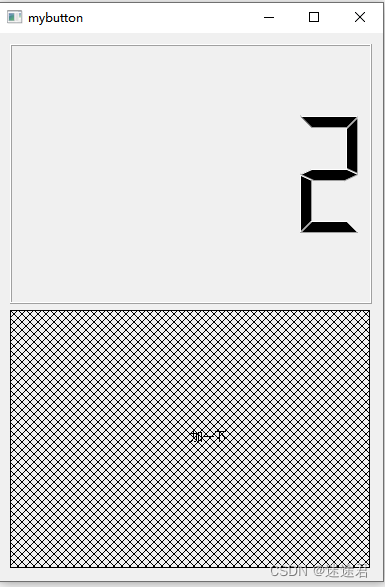
QT专题:自定义部件

List-based queuing and calling system
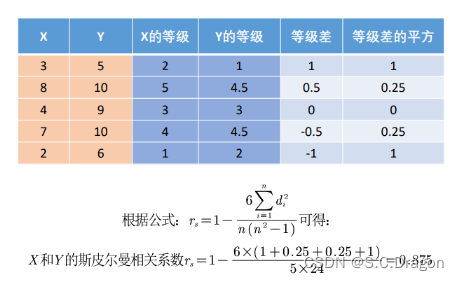
斯皮尔曼相关系数
随机推荐
3D激光slam:LeGO-LOAM---地面点提取方法及代码分析
神通数据库,批量插入数据的时候失败
R language time series data arithmetic operation: use the log function to log the time series data, and use the diff function to calculate the successive difference of the logarithmic time series data
第十五章 多线程
List-based queuing and calling system
LayaBox---TypeScript---命名空间和模块
一文带你了解推荐系统常用模型及框架
HikariCP数据库连接池,太快了!
R language ggplot2 visualization: based on the fill parameter and shape parameter in the aes function, custom draw a grouped line chart and add data points (scatter points), use the legend.position fu
STL中list实现
Smoothing of time series data in R language: smoothing time series data to remove noise using the dpill function and locpoly function of the KernSmooth package
8月份的.NET Conf 活动 专注于 .NET MAUI
leetcode 62. Unique Paths(独特的路径)
向量点积(Dot Product),向量叉积(Cross Product)
logo 图标(php图片加文字水印)
Rust 从入门到精通03-helloworld
LayaBox---TypeScript---Mixins
LayaBox---TypeScript---模块解析
The ggline function of the R language ggpubr package visualizes grouped line graphs, the add parameter is mean_se and dotplot to visualize line graphs of different level averages, and adds error bars
Unknown content monitoring