当前位置:网站首页>PyTorch中repeat、tile与repeat_interleave的区别
PyTorch中repeat、tile与repeat_interleave的区别
2022-07-02 09:41:00 【raelum】
torch.Tensor.repeat
repeat 可以形象地理解为将已有的张量多次重复以组成 “分块矩阵”。
import torch

""" Example 1 """
t = torch.arange(3)
print(t.repeat((2, )))
# tensor([0, 1, 2, 0, 1, 2])
print(t.repeat((2, 2)))
# tensor([[0, 1, 2, 0, 1, 2],
# [0, 1, 2, 0, 1, 2]])

""" Example 2 """
t = torch.arange(4).reshape(2, 2)
print(t.repeat((2, )))
# RuntimeError: Number of dimensions of repeat dims can not be smaller than number of dimensions of tensor
print(t.repeat((2, 2)))
# tensor([[0, 1, 0, 1],
# [2, 3, 2, 3],
# [0, 1, 0, 1],
# [2, 3, 2, 3]])
print(t.repeat((2, 3, 4)))
# tensor([[[0, 1, 0, 1, 0, 1, 0, 1],
# [2, 3, 2, 3, 2, 3, 2, 3],
# [0, 1, 0, 1, 0, 1, 0, 1],
# [2, 3, 2, 3, 2, 3, 2, 3],
# [0, 1, 0, 1, 0, 1, 0, 1],
# [2, 3, 2, 3, 2, 3, 2, 3]],
#
# [[0, 1, 0, 1, 0, 1, 0, 1],
# [2, 3, 2, 3, 2, 3, 2, 3],
# [0, 1, 0, 1, 0, 1, 0, 1],
# [2, 3, 2, 3, 2, 3, 2, 3],
# [0, 1, 0, 1, 0, 1, 0, 1],
# [2, 3, 2, 3, 2, 3, 2, 3]]])
可以看出要 repeat 的维度不能低于张量本身的维度。
torch.Tensor.tile
大部分情况下,tile 与 repeat 的作用相同,如下:
""" Example 1 """
t = torch.arange(3)
print(t.tile((2, )))
# tensor([0, 1, 2, 0, 1, 2])
print(t.tile((2, 2)))
# tensor([[0, 1, 2, 0, 1, 2],
# [0, 1, 2, 0, 1, 2]])

""" Example 2 """
t = torch.arange(4).reshape(2, 2)
print(t.tile((2, )))
# tensor([[0, 1, 0, 1],
# [2, 3, 2, 3]])
print(t.tile((2, 2)))
# tensor([[0, 1, 0, 1],
# [2, 3, 2, 3],
# [0, 1, 0, 1],
# [2, 3, 2, 3]])
print(t.tile((2, 3, 4)))
# tensor([[[0, 1, 0, 1, 0, 1, 0, 1],
# [2, 3, 2, 3, 2, 3, 2, 3],
# [0, 1, 0, 1, 0, 1, 0, 1],
# [2, 3, 2, 3, 2, 3, 2, 3],
# [0, 1, 0, 1, 0, 1, 0, 1],
# [2, 3, 2, 3, 2, 3, 2, 3]],
#
# [[0, 1, 0, 1, 0, 1, 0, 1],
# [2, 3, 2, 3, 2, 3, 2, 3],
# [0, 1, 0, 1, 0, 1, 0, 1],
# [2, 3, 2, 3, 2, 3, 2, 3],
# [0, 1, 0, 1, 0, 1, 0, 1],
# [2, 3, 2, 3, 2, 3, 2, 3]]])
与 repeat 不同的是,当要重复的维度低于张量的维度时,tile 也能够处理,此时 tile 会使用前置 1 1 1 自动补齐维度。
torch.Tensor.repeat_interleave
之前提到的 repeat 和 tile 都是重复整个张量,而这次的 repeat_interleave 则是重复张量中的元素。
参数如下:
torch.Tensor.repeat_interleave(repeats, dim=None)
repeats:代表张量中每个元素将要重复的次数。可以为整数或张量;dim:决定了沿哪一个轴去重复数字。默认情况下会将输入展平再进行重复,最后输出展平的张量。
""" Example 1 """
t = torch.arange(3)
print(t.repeat_interleave(repeats=3))
# tensor([0, 0, 0, 1, 1, 1, 2, 2, 2])

""" Example 2 """
t = torch.arange(4).reshape(2, 2)
print(t.repeat_interleave(repeats=3))
# tensor([0, 0, 0, 1, 1, 1, 2, 2, 2, 3, 3, 3])
print(t.repeat_interleave(repeats=3, dim=0))
# tensor([[0, 1],
# [0, 1],
# [0, 1],
# [2, 3],
# [2, 3],
# [2, 3]])
print(t.repeat_interleave(repeats=3, dim=1))
# tensor([[0, 0, 0, 1, 1, 1],
# [2, 2, 2, 3, 3, 3]])

""" Example 3 """
t = torch.arange(4).reshape(2, 2)
print(t.repeat_interleave(repeats=torch.tensor([2, 3]), dim=0))  # t的第一行重复2次,第2行重复3次
# tensor([[0, 1],
# [0, 1],
# [2, 3],
# [2, 3],
# [2, 3]])
print(t.repeat_interleave(repeats=torch.tensor([3, 2]), dim=1))  # t的第一列重复3次,第2列重复2次
# tensor([[0, 0, 0, 1, 1],
# [2, 2, 2, 3, 3]])
边栏推荐
- vant tabs组件选中第一个下划线位置异常
- How to Add P-Values onto Horizontal GGPLOTS
- 可昇級合約的原理-DelegateCall
- The position of the first underline selected by the vant tabs component is abnormal
- 时间格式化显示
- 微信小程序利用百度api达成植物识别
- php 二维、多维 数组打乱顺序,PHP_php打乱数组二维数组多维数组的简单实例,php中的shuffle函数只能打乱一维
- C#基于当前时间,获取唯一识别号(ID)的方法
- How to Create a Beautiful Plots in R with Summary Statistics Labels
- R HISTOGRAM EXAMPLE QUICK REFERENCE
猜你喜欢

vant tabs组件选中第一个下划线位置异常
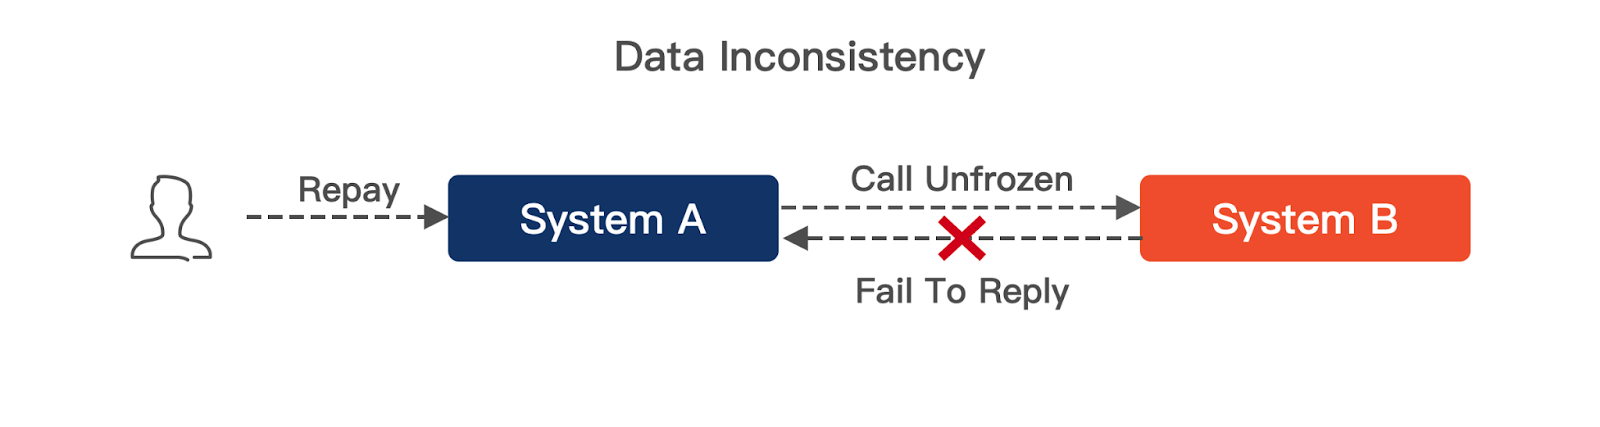
揭露数据不一致的利器 —— 实时核对系统
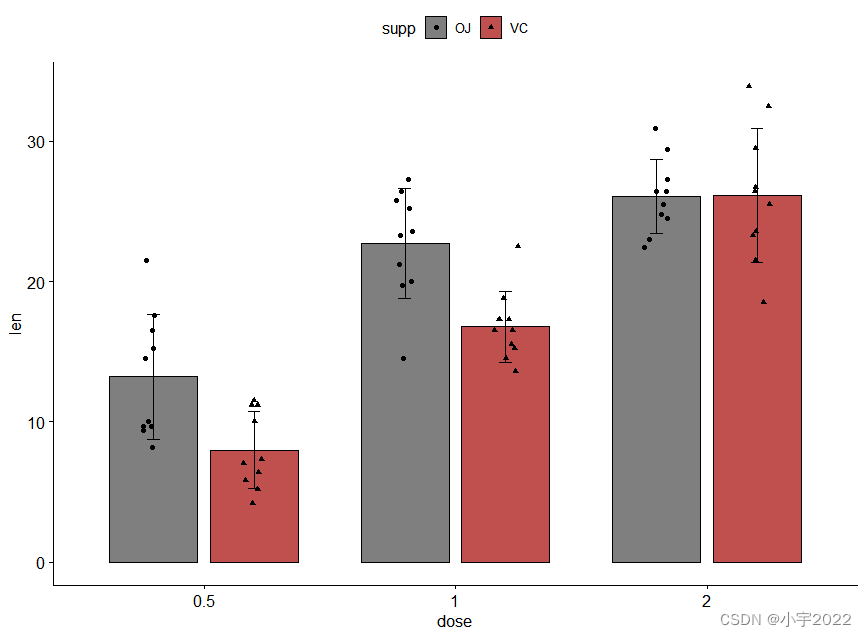
How to Easily Create Barplots with Error Bars in R
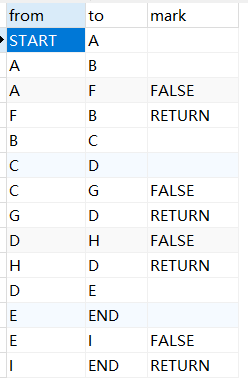
MySQL linked list data storage query sorting problem

What is the relationship between digital transformation of manufacturing industry and lean production

HOW TO ADD P-VALUES TO GGPLOT FACETS

可昇級合約的原理-DelegateCall

From scratch, develop a web office suite (3): mouse events
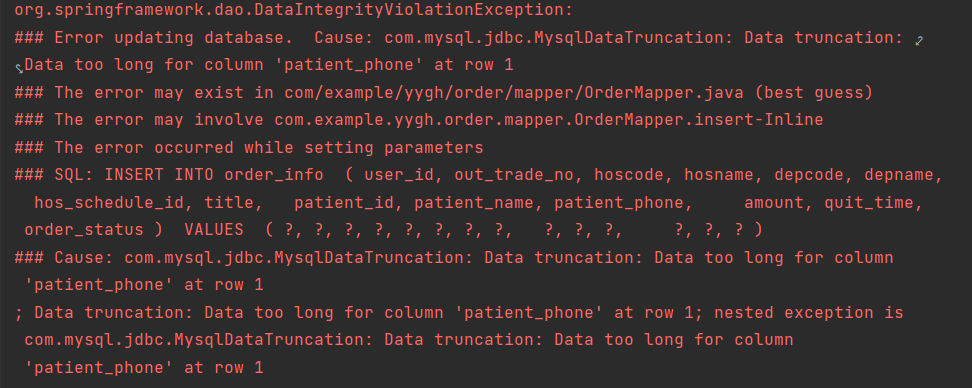
YYGH-BUG-04

How to Create a Beautiful Plots in R with Summary Statistics Labels
随机推荐
GGPlot Examples Best Reference
Enter the top six! Boyun's sales ranking in China's cloud management software market continues to rise
PHP query distance according to longitude and latitude
Amazon cloud technology community builder application window opens
行业的分析
vant tabs组件选中第一个下划线位置异常
How to Create a Beautiful Plots in R with Summary Statistics Labels
TDSQL|就业难?腾讯云数据库微认证来帮你
CTF record
行業的分析
Order by injection
The computer screen is black for no reason, and the brightness cannot be adjusted.
Is it safe to open a stock account online? I'm a novice, please guide me
[visual studio 2019] create MFC desktop program (install MFC development components | create MFC application | edit MFC application window | add click event for button | Modify button text | open appl
easyExcel和lombok注解以及swagger常用注解
How to Visualize Missing Data in R using a Heatmap
GGHIGHLIGHT: EASY WAY TO HIGHLIGHT A GGPLOT IN R
How to Visualize Missing Data in R using a Heatmap
How to Easily Create Barplots with Error Bars in R
FLESH-DECT(MedIA 2021)——一个material decomposition的观点