当前位置:网站首页>Deep learning convolutional neural network of machine learning to realize handwritten font recognition based on CNN network
Deep learning convolutional neural network of machine learning to realize handwritten font recognition based on CNN network
2022-06-28 15:40:00 【Hua Weiyun】
Implementation is based on CNN Handwritten font recognition on the Internet
First download the data 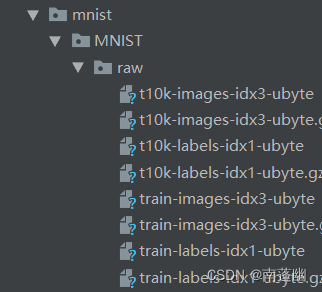
1、 build CNN A network model ;
class CNN(nn.Module): def __init__(self): super(CNN,self).__init__() ''' Generally speaking , The convolution network includes the following : 1. Convolution layer 2. neural network 3. Pooling layer ''' self.conv1=nn.Sequential( nn.Conv2d( #--> (1,28,28) in_channels=1, # The incoming image is several layers , Grey is 1 layer ,RGB It's three floors out_channels=16, # The output picture is several layers kernel_size=5, # The area points representing the scanning are 5*5 stride=1, # Just jump every few steps padding=2, # Border completion , Its calculation formula =(kernel_size-1)/2=(5-1)/2=2 ), # 2d Represents two-dimensional convolution --> (16,28,28) nn.ReLU(), # Nonlinear activation layer nn.MaxPool2d(kernel_size=2), # Set the scanning area here as 2*2, And remove the 2*2 Maximum of --> (16,14,14) ) self.conv2=nn.Sequential( nn.Conv2d( # --> (16,14,14) in_channels=16, # The input here is the output of the upper layer 16 layer out_channels=32, # Here we need to output it as 32 layer kernel_size=5, # The area points representing the scanning are 5*5 stride=1, # Just jump every few steps padding=2, # Border completion , Its calculation formula =(kernel_size-1)/2=(5-1)/2= ), # --> (32,14,14) nn.ReLU(), nn.MaxPool2d(kernel_size=2), # Set the scanning area here as 2*2, And remove the 2*2 Maximum of --> (32,7,7), Here is the 3D data ) self.out=nn.Linear(32*7*7,10) # Note that the data here is two-dimensional data def forward(self,x): x=self.conv1(x) x=self.conv2(x) #(batch,32,7,7) # Then proceed to expand and flatten , Convert 3D data to 2D data x=x.view(x.size(0),-1) #(batch ,32 * 7 * 7) output=self.out(x) return output2、 Design loss function , Select the optimization function ;
# Add optimization methods optimizer=torch.optim.Adam(cnn.parameters(),lr=LR)# Specifies that the loss function uses cross information entropy loss_fn=nn.CrossEntropyLoss()3、 Implement model training and testing .
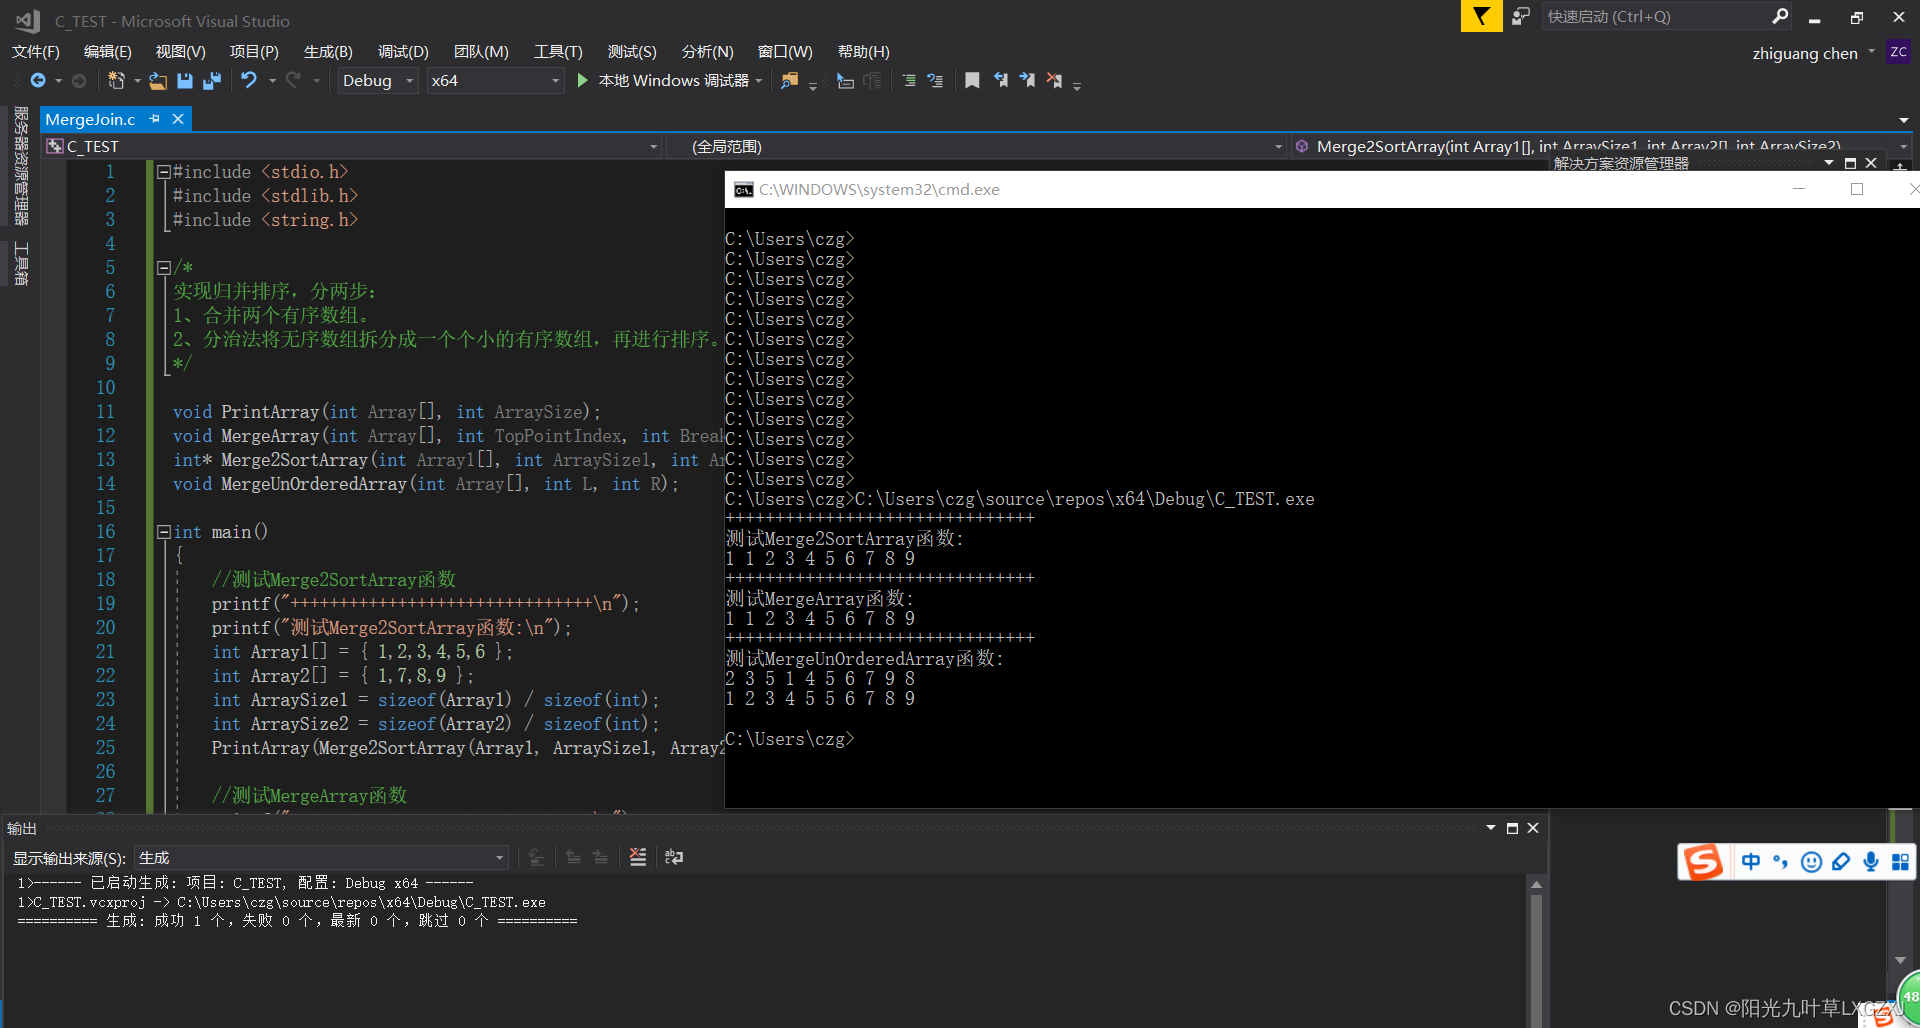
step=0for epoch in range(EPOCH): # Load training data for step,data in enumerate(train_loader): x,y=data # Get the training data respectively x and y The value of b_x=Variable(x) b_y=Variable(y) output=cnn(b_x) # Call the model to predict loss=loss_fn(output,b_y)# Calculate the loss value optimizer.zero_grad() # Before each cycle , Clear the gradient to zero loss.backward() # Back propagation optimizer.step() # gradient descent # Every execution 50 Time , Output the current epoch、loss、accuracy if (step%50==0): # Calculate the accuracy of the model prediction test_output=cnn(test_x) y_pred=torch.max(test_output,1)[1].data.squeeze() accuracy=sum(y_pred==test_y).item()/test_y.size(0) print('now epoch : ', epoch, ' | loss : %.4f ' % loss.item(), ' | accuracy : ' , accuracy)
Code :
import torchimport torch.nn as nnfrom torch.autograd import Variableimport torch.utils.data as Dataimport torchvision#Hyper prametersEPOCH=1BATCH_SIZE=50LR=0.001DOWNLOAD_MNIST=Falsetrain_data = torchvision.datasets.MNIST( root='./mnist', train=True, transform=torchvision.transforms.ToTensor(), # Convert the downloaded file into pytorch cognitive tensor type , And change the value of the picture from (0-255) Normalize to (0-1) download=DOWNLOAD_MNIST)train_loader=Data.DataLoader(dataset=train_data, batch_size=BATCH_SIZE, shuffle=True)test_data=torchvision.datasets.MNIST( root='./mnist', train=False,)with torch.no_grad(): test_x=Variable(torch.unsqueeze(test_data.data, dim=1)).type(torch.FloatTensor)[:2000]/255 # Just take the first twothousand data , Almost enough , And then normalize it . test_y=test_data.targets[:2000]''' Start building CNN The Internet '''class CNN(nn.Module): def __init__(self): super(CNN,self).__init__() ''' Generally speaking , The convolution network includes the following : 1. Convolution layer 2. neural network 3. Pooling layer ''' self.conv1=nn.Sequential( nn.Conv2d( #--> (1,28,28) in_channels=1, # The incoming image is several layers , Grey is 1 layer ,RGB It's three floors out_channels=16, # The output picture is several layers kernel_size=5, # The area points representing the scanning are 5*5 stride=1, # Just jump every few steps padding=2, # Border completion , Its calculation formula =(kernel_size-1)/2=(5-1)/2=2 ), # 2d Represents two-dimensional convolution --> (16,28,28) nn.ReLU(), # Nonlinear activation layer nn.MaxPool2d(kernel_size=2), # Set the scanning area here as 2*2, And remove the 2*2 Maximum of --> (16,14,14) ) self.conv2=nn.Sequential( nn.Conv2d( # --> (16,14,14) in_channels=16, # The input here is the output of the upper layer 16 layer out_channels=32, # Here we need to output it as 32 layer kernel_size=5, # The area points representing the scanning are 5*5 stride=1, # Just jump every few steps padding=2, # Border completion , Its calculation formula =(kernel_size-1)/2=(5-1)/2= ), # --> (32,14,14) nn.ReLU(), nn.MaxPool2d(kernel_size=2), # Set the scanning area here as 2*2, And remove the 2*2 Maximum of --> (32,7,7), Here is the 3D data ) self.out=nn.Linear(32*7*7,10) # Note that the data here is two-dimensional data def forward(self,x): x=self.conv1(x) x=self.conv2(x) #(batch,32,7,7) # Then proceed to expand and flatten , Convert 3D data to 2D data x=x.view(x.size(0),-1) #(batch ,32 * 7 * 7) output=self.out(x) return output cnn=CNN()# print(cnn)# Add optimization methods optimizer=torch.optim.Adam(cnn.parameters(),lr=LR)# Specifies that the loss function uses cross information entropy loss_fn=nn.CrossEntropyLoss()''' Start training our model '''step=0for epoch in range(EPOCH): # Load training data for step,data in enumerate(train_loader): x,y=data # Get the training data respectively x and y The value of b_x=Variable(x) b_y=Variable(y) output=cnn(b_x) # Call the model to predict loss=loss_fn(output,b_y)# Calculate the loss value optimizer.zero_grad() # Before each cycle , Clear the gradient to zero loss.backward() # Back propagation optimizer.step() # gradient descent # Every execution 50 Time , Output the current epoch、loss、accuracy if (step%50==0): # Calculate the accuracy of the model prediction test_output=cnn(test_x) y_pred=torch.max(test_output,1)[1].data.squeeze() accuracy=sum(y_pred==test_y).item()/test_y.size(0) print('now epoch : ', epoch, ' | loss : %.4f ' % loss.item(), ' | accuracy : ' , accuracy)''' Print the results of ten test sets '''test_output=cnn(test_x[:10])y_pred=torch.max(test_output,1)[1].data.squeeze() # Select the position of the most possible value print(y_pred.tolist(),'predecton Result')print(test_y[:10].tolist(),'Real Result')边栏推荐
- Fleet | "backstage exploration" issue 3: status management
- Web3.0时代来了,看天翼云存储资源盘活系统如何赋能新基建(上)
- What useful supplier management systems are available
- Opengauss kernel: analysis of SQL parsing process
- R language ggplot2 visualization: use the patchwork package (directly use the plus sign +) to horizontally combine a ggplot2 visualization result and a plot function visualization result to form a fin
- Facebook出手!自适应梯度打败人工调参
- Fleet |「后台探秘」第 3 期:状态管理
- 隐私计算 FATE - 离线预测
- VS2013 帮助文档中没有 win32/com
- MIPS assembly language learning-03-cycle
猜你喜欢

信创操作系统--麒麟Kylin桌面操作系统 (项目十 安全中心)
C语言学习-20-归并排序

论文解读(GCC)《Efficient Graph Convolution for Joint Node RepresentationLearning and Clustering》

Web3.0时代来了,看天翼云存储资源盘活系统如何赋能新基建(上)
DBMS in Oracle_ output. put_ Line output problem solving process

PostgreSQL 存储结构浅析

征文投稿丨使用轻量应用服务器搭建博客环境

Not being a meta universe now is like not buying a house 20 years ago!
GCC efficient graph revolution for joint node representationlearning and clustering

Opengauss kernel: analysis of SQL parsing process

随机推荐
Visual Studio 2010 配置和使用Qt5.6.3
R语言ggplot2可视化:使用patchwork包(直接使用加号+)将一个ggplot2可视化结果和数据表格横向组合起来形成最终结果图
What! One command to get the surveillance?
Expand Disk C (allocate the memory of disk d to Disk C)
论文解读(GCC)《Efficient Graph Convolution for Joint Node RepresentationLearning and Clustering》
spark sql 生成 json
深度学习基础汇总
R语言ggplot2可视化:使用patchwork包(直接使用加号+)将一个ggplot2可视化结果和一段文本内容横向组合起来形成最终结果图
Solution to JSON parsing problem using curl for Tron API signature broadcast and json Problem record of the loads method
The Web3.0 era is coming. See how Tianyi cloud storage resources invigorate the system to enable new infrastructure (Part 1)
数组中的第K大元素[堆排 + 建堆的实际时间复杂度]
C#/VB.NET 将PDF转为Excel
How to build a 100000 level QPS large flow and high concurrency coupon system from zero
The past and present life of distributed cap theorem
[leetcode] 13. Roman numeral to integer
Not being a meta universe now is like not buying a house 20 years ago!
隆重推出 Qodana:您最爱的 CI 的代码质量平台
Fleet | background Discovery issue 3: Status Management
ROS知识点——ROS创建工作空间
R language ggplot2 visualization: use the patchwork package to stack two ggplot2 visualization results vertically to form a composite diagram, and stack one visualization result on the other visualiza