当前位置:网站首页>WPF visifire.charts4.6.1 tutorial with source code
WPF visifire.charts4.6.1 tutorial with source code
2022-07-27 13:58:00 【coder i++】
Reprint :https://blog.csdn.net/jixiangsichuan/article/details/103906339
reason :
Some time ago , It's used in company projects Visifire.Charts4.5.6 Control , The animation effect can be controlled at any time in the project , Used for displaying on the large screen , It's cool .
The process :
But no Source code , So I wrote a method to use animation to control the dynamic growth of quantity , But the efficiency is too low , More instances Chart It's stuck until it explodes , give up .
No source code , What shall I do? , In desperation Decompile For a moment dll, Just started to use reflector Decompile , I found that most of the compiled ones are useless . And then use ILSpy Decompile , There are still errors in the generated code , But it is much less , So a little change , It's ready to compile .
The decompiled code can run , Half the battle , Then spent more than half a month debugging the source code , Add dynamic control animation method , Control the time of animation , Eventual success , There are effects and Demo.
The animation function is completed , But there are still some problems with the decompiled code , Some symbols produced by this decompilation cannot be recognized, resulting in an extra line in the running chart . This is very uncomfortable for me with obsessive-compulsive disorder , So it took several days to debug , All kinds of methods are exhausted, but we can't find the problem , Finally, I took out Visifire.Charts3.6.1 Compare the differences one by one , These two versions are quite different , I didn't get it out for a while , Finally, I found that decompilation will i++ Called many times, resulting in , After the modification , Exactly , Overjoyed , OCD is solved , perfect .
Be born :
In order to distinguish the original Visifire.Charts4.5.6, I will encapsulate the animation control , The newly compiled code is modified to WPFVisifire.Charts4.6.1.
Said so much , Post some usage codes , It's attached to the back Visifire.Charts3.6.1、Visifire.Charts4.5.6、WPFVisifire.Charts4.6.1
Example :
XAML:
-
<Window x:Class="VisifireDemo.MainWindow"
-
xmlns=
"http://schemas.microsoft.com/winfx/2006/xaml/presentation"
-
xmlns:x=
"http://schemas.microsoft.com/winfx/2006/xaml"
-
xmlns:vc=
"clr-namespace:Visifire.Charts;assembly=WPFVisifire.Charts"
-
Title=
"MainWindow"
Height=
"600"
Width=
"800"
WindowStartupLocation=
"CenterScreen"
Loaded=
"Window_Loaded">
-
<Grid x:Name="grid" Background="#1E1E1E">
-
<Grid.RowDefinitions>
-
<RowDefinition Height="50"/>
-
<RowDefinition/>
-
</Grid.RowDefinitions>
-
<WrapPanel x:Name="wrap" VerticalAlignment="Center">
-
<ComboBox x:Name="cbChartType" Width="120" Height="40" SelectionChanged="cbChartType_SelectionChanged"/>
-
<Button x:Name="btnChartSet" Width="100" Height="40" Content=" Graphic settings " Click="btnChartSet_Click"/>
-
<Button x:Name="btnTagSet" Width="100" Height="40" Content=" Label settings " Click="btnTagSet_Click"/>
-
<Button x:Name="btnRandomValue" Width="100" Height="40" Content=" Random value " Click="btnRandomValue_Click"/>
-
<Button x:Name="btnAnimated" Width="100" Height="40" Content=" Animation " Click="btnAnimated_Click"/>
-
</WrapPanel>
-
<vc:Chart x:Name="chart" Grid.Row="1"/>
-
</Grid>
-
</Window>
Descendant code :
-
using System;
-
using System.Collections.Generic;
-
using System.Linq;
-
using System.Text;
-
using System.Threading;
-
using System.Threading.Tasks;
-
using System.Windows;
-
using System.Windows.Controls;
-
using System.Windows.Data;
-
using System.Windows.Documents;
-
using System.Windows.Forms;
-
using System.Windows.Input;
-
using System.Windows.Media;
-
using System.Windows.Media.Animation;
-
using System.Windows.Media.Imaging;
-
using System.Windows.Navigation;
-
using System.Windows.Shapes;
-
using Visifire.Charts;
-
-
namespace
VisifireDemo
-
{
-
/// <summary>
-
/// MainWindow.xaml Interaction logic of
-
/// </summary>
-
public
partial
class
MainWindow :
Window
-
{
-
private Axis NewAxis()
-
{
-
var axisLabels =
new AxisLabels();
-
axisLabels.FontColor = Brushes.White;
-
var _axis =
new Axis { AxisLabels = axisLabels };
-
_axis.Grids.Add(
new ChartGrid());
-
return _axis;
-
}
-
-
/// <summary>
-
/// Initialize chart control
-
/// </summary>
-
private void InitChart()
-
{
-
this.chart.BorderBrush = Brushes.Transparent;
-
this.chart.Background = Brushes.Transparent;
-
this.chart.LightingEnabled =
false;
-
this.chart.ThemeEnabled =
false;
-
this.chart.ShadowEnabled =
false;
-
this.chart.View3D =
true;
-
this.chart.AnimationEnabled =
true;
// Loading animation
-
this.chart.AnimatedUpdate =
true;
// Update animation
-
this.chart.AnimationDuration =
5.0;
// Animation duration
-
-
var _axisX = NewAxis();
-
var _axisY = NewAxis();
-
_axisY.Suffix =
" Jin ";
-
_axisY.AxisMaximum =
200;
-
_axisY.AxisMinimum =
0;
-
-
this.chart.AxesX.Add(_axisX);
-
this.chart.AxesY.Add(_axisY);
-
-
this.chart.PlotArea =
new PlotArea()
-
{
-
Background = Brushes.Transparent,
-
ShadowEnabled =
false
-
};
-
}
-
-
/// <summary>
-
/// Data binding
-
/// </summary>
-
private void BindingData()
-
{
-
this.chart.Series.Clear();
-
this.chart.Titles.Clear();
-
this.chart.Titles.Add(
new Title() { Text =
" title ", FontColor = Brushes.Tomato, FontSize =
14 });
-
-
DataSeries dataSeries =
new DataSeries();
-
DataPointCollection list =
new DataPointCollection();
-
for (
int i =
0; i <
9; i++)
-
{
-
DataPoint dataPoint =
new DataPoint();
-
dataPoint.Enabled =
true;
-
dataPoint.Exploded =
false;
-
dataPoint.AxisXLabel =
"name" + i;
-
dataPoint.YValue = (i +
1) *
10;
-
dataPoint.Background = Brushes.Red;
-
dataPoint.MouseLeftButtonDown += (ss, ee) => { dataPoint.Exploded = !dataPoint.Exploded; };
-
list.Add(dataPoint);
-
}
-
dataSeries.DataPoints = list;
-
dataSeries.LabelFontColor = Brushes.White;
-
dataSeries.LabelAngle =
0;
-
dataSeries.RenderAs = RenderAs.Column;
-
dataSeries.LightingEnabled =
true;
-
dataSeries.LabelEnabled =
true;
-
this.chart.Series.Add(dataSeries);
-
}
-
-
/// <summary>
-
/// Load chart control type
-
/// </summary>
-
private void LoadChartType()
-
{
-
var es = Enum.GetNames(
typeof(RenderAs));
-
foreach (
var item
in es)
-
{
-
this.cbChartType.Items.Add(item);
-
}
-
}
-
-
public MainWindow()
-
{
-
InitializeComponent();
-
this.LoadChartType();
-
this.InitChart();
-
this.BindingData();
-
}
-
-
private void Window_Loaded(object sender, RoutedEventArgs e)
-
{
-
-
}
-
-
private void cbChartType_SelectionChanged(object sender, SelectionChangedEventArgs e)
-
{
-
this.chart.Series[
0].RenderAs = (RenderAs)Enum.Parse(
typeof(RenderAs),
this.cbChartType.SelectedItem.ToString());
-
}
-
-
private void btnChartSet_Click(object sender, RoutedEventArgs e)
-
{
-
var window =
new ChartSetWindow(
this.chart);
-
window.Owner =
this;
-
window.Show();
-
}
-
-
private void btnTagSet_Click(object sender, RoutedEventArgs e)
-
{
-
var window =
new TagSetWindow(
this.chart);
-
window.Owner =
this;
-
window.Show();
-
}
-
-
private void btnRandomValue_Click(object sender, RoutedEventArgs e)
-
{
-
foreach (
var item
in
this.chart.Series)
-
{
-
foreach (
var s
in item.DataPoints)
-
{
-
s.YValue =
new Random().Next(
0,
100);
-
Thread.Sleep(
20);
-
}
-
}
-
}
-
-
private void btnAnimated_Click(object sender, RoutedEventArgs e)
-
{
-
this.chart.RenderAnimate();
-
}
-
}
-
}
Running effect :


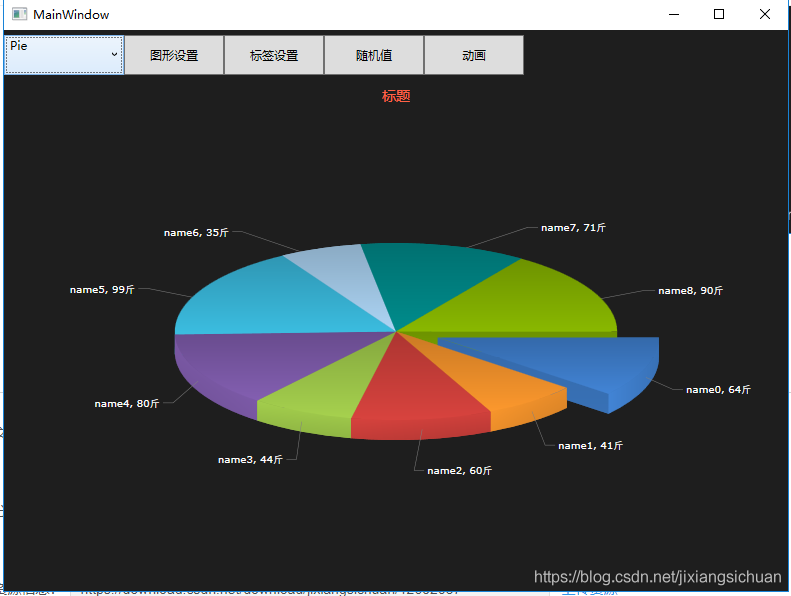

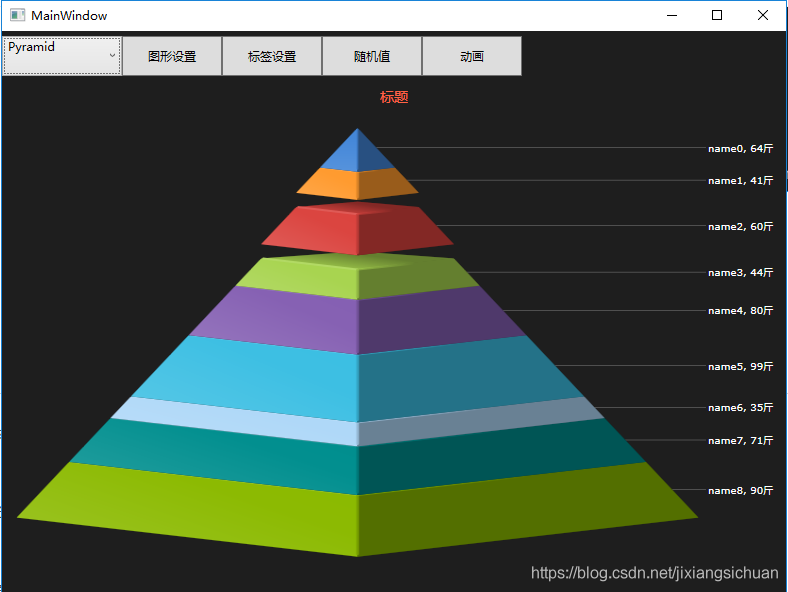

More effects , download Demo Run and see ! Continue to update more later WPF Style control , Welcome to pay attention !
Visifire.Charts3.6.1 Source code
边栏推荐
- Gains and losses of desensitization project
- 13. User web layer services (I)
- Keras deep learning practice - recommend system data coding
- SwiftUI 地图大全之 使用 MapKit 进行搜索
- In the "meta cosmic space", utonmos will open the digital world of the combination of virtual and real
- Product manager experience 100 (XI) - Strategic Product Manager: model and methodology
- Wechat campus laundry applet graduation design finished product of applet completion work (8) graduation design thesis template
- Wechat campus laundry applet graduation design finished product (5) assignment
- 2. Citrix virtual apps and desktops 2203 clipboard redirection policy
- Add index to the field of existing data (Damon database version)
猜你喜欢
Figure 8 shows you how to configure SNMP

Wechat campus laundry applet graduation design finished product (4) opening report

Accuracy improvement method: efficient visual transformer framework of adaptive tokens (open source)
![[C Advanced] pointer array vs array pointer](/img/1e/33f9cc9446dcad8cdb78babbb5a22c.jpg)
[C Advanced] pointer array vs array pointer

Summary of scaling and coding methods in Feature Engineering

Is it still time to take the PMP Exam in September?

Wechat campus laundry applet graduation design finished product (7) Interim inspection report

使用RecyclerView,实现列表左滑菜单

What are the benefits of taking NPDP

小程序毕设作品之微信校园洗衣小程序毕业设计成品(3)后台功能
随机推荐
Motion attitude control system of DOF pan tilt based on stm32
关于max做动画的一些关键信息(shift+v)
Meshlab farthest point sampling (FPS)
[C Advanced] pointer array vs array pointer
Gains and losses of desensitization project
Various ways to use new
opencv图像的缩放平移及旋转
Construction and application of industrial knowledge atlas (3): commodity knowledge fusion
Huiliang technology app is a good place to go to sea: after more than ten years of popularity, why should the United States still choose to go to sea for gold
Futures Commission Standard and margin ratio
Wechat campus laundry applet graduation design finished product (6) opening defense ppt
2022ACM夏季集训周报(四)
期货手续费标准和保证金比例
《C语言》函数栈帧的创建与销毁--(内功)
idea Gradle7.0+ :Could not find method compile()
基于C语言的LR1编译器设计
Data enhancement in image processing
13. User web layer services (I)
16 VMware horizon 2203 virtual desktop-win10 automatic desktop pool full clone dedicated (XVI)
2022acm summer training weekly report (IV)