当前位置:网站首页>Using powerful powerbi Sangji diagram to express complex operation business flow
Using powerful powerbi Sangji diagram to express complex operation business flow
2020-11-09 17:51:00 【Bi Zorro】

On Sankey graph , Last time, we talked about the general construction method of Sangji graph at any level . The question left is :
Scenarios where traffic is not necessarily equal
There are scenarios of cross layer flow
There are backflow scenarios
In a real business scenario , There is such a complex structure , This article is to realize .
Business scenario
Take the retail scene as an example ( It can be extended to many fields ), With AARRR For reference , There is probably such an effect :
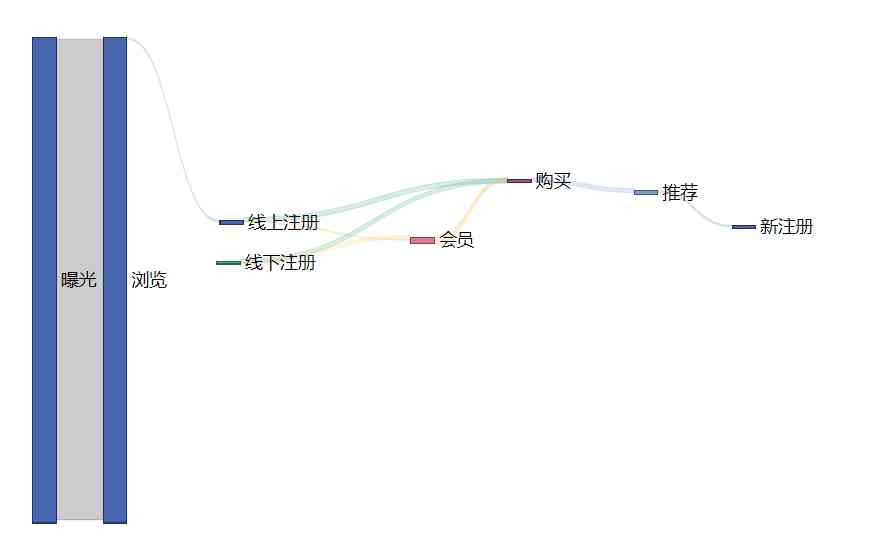
A lot of exposure on the line will spread the whole picture, causing other contents to be affected , Using logarithm to get :

The business implications are very clear :
Online exposure gets browsed ;
Browse to get online registration ;
There will also be registration offline ;
Sign up to become a member ;
Members generate purchases ;
Not registering as a member can also generate purchases ;
It may be converted into a member after purchase ;
You can also recommend after purchase ;
Recommend a new registration .
In this business scenario , It's about the most complex use of the Sankey diagram , At the same time, we need to deal with :
Scenarios where traffic is not necessarily equal
There are scenarios of cross layer flow
There are backflow scenarios
Then let's see how this is done .
data
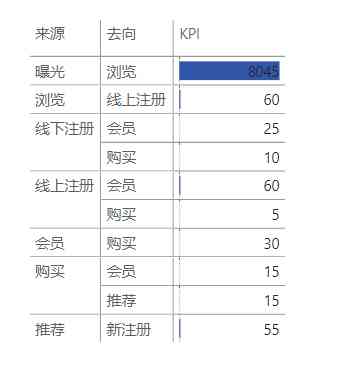
If you express this directly with data , You can roughly get :
stay PowerBI It is obviously more intuitive to use Sangji diagram in China .
Prepare dimensions
use PowerBI DAX The dimensions of preparation are as follows :
SanKey_Source_X_AARRRR =
SELECTCOLUMNS(
{
    ( "0.online_show" , " Exposure "),
    ( "0.online_view" , " Browse "),
    ( "1.online" , " Register online " ),
    ( "1.offline" , " Offline registration " ),
    ( "2.reg" , " members " ),
    ( "3.buy" , " Buy " ),
    ( "4.share" , " recommend " )
} , "SourceCode" , [Value1] , "SourceName" , [Value2] )
as well as :
SanKey_Dest_X_AARRR =
SELECTCOLUMNS(
{
    ( "0.online_view" , " Browse " ),
    ( "1.online" , " Register online " ),
    ( "1.offline" , " Offline registration " ),
    ( "2.reg" , " members " ),
    ( "3.buy" , " Buy " ),
    ( "4.share" , " recommend " ),
    ( "5.new" , " New registration " )

} , "DestCode" , [Value1] , "DestName" , [Value2] )
You can find , Here we use Code and Name In a way that will KEY Separate from the display content .
The main idea here is : Data as source and destination must be prepared in dimensions . Later, measures are used to control rationality and combination and calculation .
Implement the calculation
use PowerBI DAX The implementation measures are as follows :
SankeyX.AARRR =
VAR _source = SELECTEDVALUE( SanKey_Source_X_AARRRR[SourceCode] )
VAR _dest   = SELECTEDVALUE( SanKey_Dest_X_AARRR[DestCode] )
RETURN SWITCH( TRUE() ,
    _source = "0.online_show" && _dest = "0.online_view" , 8045 ,
    _source = "0.online_view" && _dest = "1.online" , 60 ,
    _source = "1.online" && _dest = "2.reg" , 60 ,
    _source = "1.online" && _dest = "3.buy" , 5 ,
    _source = "1.offline" && _dest = "2.reg" , 25 ,
    _source = "1.offline" && _dest = "3.buy" , 10 ,
    _source = "2.reg" && _dest = "3.buy" , 30 ,
    _source = "3.buy" && _dest = "2.reg" , 15 ,
    _source = "3.buy" && _dest = "4.share" , 15,
    _source = "4.share" && _dest = "5.new" , 55 ,
    BLANK()
)
In practice, , You can replace the constant values with more specific measures to achieve dynamic calculation .
Core business scenario
If you don't consider the exposure scene , The sanguingi map can be more refined , give the result as follows :

Combined with the actual operation scenario , Look at the picture like this :
about 100 Members , Yes 60 people From online registration , Yes 25 people From offline registration , also 15 people From the return conversion after purchase .
Does not include reflow conversion members , There will be 45 people ( Registered at 85 people ) Complete purchase .
among ,15 People will continue to recommend , Bring after recommendation 55 People are newly registered as members , The conversion ratio is approximately 3.
Suppose the model is stable , We can continue to periodically deduce the realization effect after any stage .
summary
This article uses free PowerBI Visual objects sangee map , Combined with the growth of hackers AARRR Model and actual business scenario simulation , More complex implementation and effect display are given .
thus , The implementation of a very complex sangee diagram and can be used for business expression , It includes :
It can be any level of flow ;
Scenarios where traffic is not necessarily equal ;
There are scenarios of cross layer flow ;
There are backflow scenarios .
Using the ideas of this paper , You can immediately implement your own business presentation , Try it .
After subscribing to BI Zorro taught 《BI In progress 》 Course area , In addition to downloading this case , You can also watch videos to explain .
Learn systematically PowerBI Please be ready to , There will be many course updates this month , We must pay attention to the official account .

Let data really be your power
Create value through simple and easy with fun by PowerBI
Excel BI | DAX Pro | DAX Authoritative guide | Offline VIP Study
Scan the code and PBI Elites learn together , Verification Code :data2020

PowerBI MVP Take you Correctly and efficiently Study PowerBI
Click on “ Read the original ”, Start immediately
This article is from WeChat official account. - PowerBI The comrades in arms Alliance (powerbichina).
If there is any infringement , Please contact the [email protected] Delete .
Participation of this paper “OSC Source creation plan ”, You are welcome to join us , share .
版权声明
本文为[Bi Zorro]所创,转载请带上原文链接,感谢
边栏推荐
- 数据库执行truncate table CM_CHECK_ITEM_HIS怎么恢复
- C#控制台调用FFMPEG推MP4视频文件至流媒体开源服务平台EasyDarwin过程
- DCL单例模式中的缺陷及单例模式的其他实现
- (3) ASP.NET Core3.1 Ocelot certification
- 如何使用RTSP推流组件EasyPusher将MP4文件推到EasyDarwin开源平台?
- Git + -- Code hosting in the history of version management
- Solve the problem that the page does not refresh after the wechat applet uses switchtab to jump
- Kubernetes-17:Kubernets包管理工具—>Helm介绍与使用
- 【云小课】版本管理发展史之Git+——代码托管
- Which industries are suitable for enterprises to develop wechat applet?
猜你喜欢

iOS下带小数点的数字键盘

Introduction to zero base little white Python

Analysis of h264nalu head
Toolkit Pro助力界面开发:缩短项目开发周期,快速实现具有现代功能区样式的GUI

Rabbitmq installation
Flink的安装部署
Kubernetes权限管理之RBAC (一)
RBAC of kubernetes authority management (1)
Openocd-jtag debugging

Gesture switch background, let live with goods more immersive
随机推荐
OpenOCD-JTAG调试
Revealing the logic of moving path selection in Summoner Canyon?
andorid实例-简单登录布局
Kubernetes权限管理之RBAC (一)
从硅谷到小米,崔宝秋的25年开源人生
超简单集成华为系统完整性检测,搞定设备安全防护
揭秘在召唤师峡谷中移动路径选择逻辑?
深入分析商淘多用户商城系统如何从搜索着手打造盈利点
Git + -- Code hosting in the history of version management
DCL单例模式中的缺陷及单例模式的其他实现
【邀你投票】谁是2020年这些开源大事件背后的关键推动者?
A great guide to curl
How to choose the development of Biao fan interactive interpretation program?
A practical chrome Gadget: xtrace
自定义室内地图在线工具
百亿级数据分表后怎么分页查询?
ABBYY FineReader 15新增编辑页面布局功能
Rookie gospel, 28 books step by step to make you a big bull! (a copy of learning syllabus attached)
揭秘在召唤师峡谷中移动路径选择逻辑?
SEO解决方案制定,如何脱离杯弓蛇影?