当前位置:网站首页>程序模拟感知机算法(梯度下降法、sklearn.linear_model中perception方法)
程序模拟感知机算法(梯度下降法、sklearn.linear_model中perception方法)
2020-11-09 16:06:00 【Allez_Levide】
第二章 感知机的原始形式模拟
- 我是小白一个;本文代码转载地址文末有注释;注释大部分自己书写,有问题请多指教。
- 通过梯度下降模拟感知机算法。数据来源于sklearn.datasets中经典数据集。
import numpy as np
import pandas as pd
# 导入数据集load_iris。
# 其中前四列为花萼长度,花萼宽度,花瓣长度,花瓣宽度等4个用于识别鸢尾花的属性,
from sklearn.datasets import load_iris
import matplotlib.pyplot as plot

# load data
iris = load_iris()

# 构造函数DataFrame(data,index,columns),data为数据,index为行索引,columns为列索引
# 构造数据结构
df = pd.DataFrame(data=iris.data, columns=iris.feature_names)

# 在df中加入了新的一列:列名label的数据是target,即类型
# 第5列为鸢尾花的类别(包括Setosa,Versicolour,Virginica三类)。
# 也即通过判定花萼长度,花萼宽度,花瓣长度,花瓣宽度的尺寸大小来识别鸢尾花的类别。
df['label'] = iris.target
df.columns = ['sepal length', 'sepal width', 'petal length', 'petal width', 'label']

# 打印出label列值对应的数量。以及列名称、类型
# print(df.label.value_counts())

# 创建数组,
# 第一个参数:100表示取0-99行,即前100行;同理100:表示后100行。
# 第二个参数,0,1表示第一列和第二列,-1表示最后一列
data = np.array(df.iloc[:100, [0, 1, -1]])

# 数组切割,X切除了最后一列;y仅切最后一列
X, y = data[:, :-1], data[:, -1]

# 数据整理,将y中非1的改为-1
y = np.array([1 if i == 1 else -1 for i in y])

# 数据线性可分,二分类数据
# 此处为一元一次线性方程
class Model:
    def __init__(self):
        # w初始为自变量个数相同的(1,1)阵
        self.w = np.ones(len(data[0]) - 1, dtype=np.float32)
        self.b = 0
        # 学习率设置为0.1
        self.l_rate = 0.1

    def sign(self, x, w, b):
        # dot函数为点乘,区别于*乘。
        # dot对矩阵运算的时候为矩阵乘法,一行乘一列。
        # *乘对矩阵运算的时候,是对应元素相乘
        y = np.dot(x, w) + b
        return y

    # 随机梯度下降法
    def fit(self, X_train, y_train):
        is_wrong = False
        while not is_wrong:
            # 记录当前的分类错误的点数,当分类错误的点数归零的时候,即分类结束
            wrong_count = 0
            # d从0-49遍历
            for d in range(len(X_train)):
                # 这里的X为一行两列数组
                X = X_train[d]
                y = y_train[d]
                if y * self.sign(X, self.w, self.b) <= 0:
                    self.w = self.w + self.l_rate * np.dot(y, X)
                    self.b = self.b + self.l_rate * y
                    wrong_count += 1
            if wrong_count == 0:
                is_wrong = True
        return 'Perceptron Model!'

    def score(self):
        pass

perceptron = Model()
# 对perception进行梯度下降
perceptron.fit(X, y)

print(perceptron.w)
x_points = np.linspace(4, 7, 10)
# 最后拟合的函数瑞如下:
# w1*x1 + w2*x2 + b = 0
# 其中x1就是下边的x_points,x2就是y_
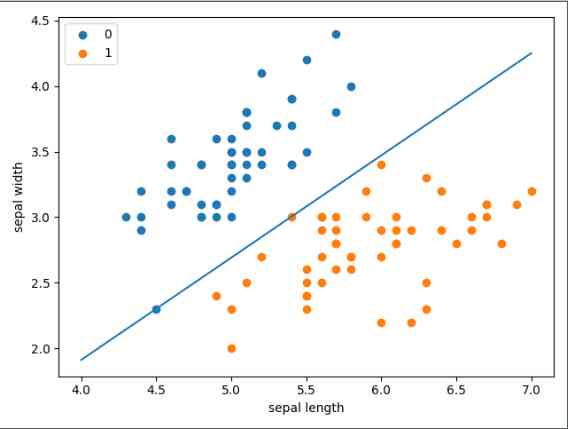
y_ = -(perceptron.w[0] * x_points + perceptron.b) / perceptron.w[1]
plot.plot(x_points, y_)

# scatter两个属性分别对应于x,y。
# 先画出了前50个点的花萼长度宽度,这时的花类型是0;
# 接着画50-100,这时花类型1
plot.scatter(df[:50]['sepal length'], df[:50]['sepal width'], label='0')
plot.scatter(df[50:100]['sepal length'], df[50:100]['sepal width'], label='1')
# 横坐标名称
plot.xlabel('sepal length')
# 纵坐标名称
plot.ylabel('sepal width')
plot.legend()
plot.show()
结果如图

2. sklearn中提供了现成的感知机方法,我们可以直接调用
import sklearn
import pandas as pd
import numpy as np
import matplotlib.pyplot as plt
from sklearn.datasets import load_iris
from sklearn.linear_model import Perceptron

iris = load_iris()
df = pd.DataFrame(iris.data, columns=iris.feature_names)
df['label'] = iris.target
# df.columns = [
#     'sepal length', 'sepal width', 'petal length', 'petal width', 'label'
# ]
data = np.array(df.iloc[:100, [0, 1, -1]])
X, y = data[:, :-1], data[:, -1]
y = np.array([1 if i == 1 else -1 for i in y])

clf = Perceptron(fit_intercept=True,  # true表示估计截距
                 max_iter=1000,  # 训练数据的最大次数
                 shuffle=True,  # 每次训练之后是否重新训练
                 tol=None)  # 如果不设置none那么迭代将在误差小于1e-3结束
clf.fit(X, y)

# 输出粘合之后的w
print(clf.coef_)
# 输出拟合之后的截距b
print(clf.intercept_)

# 画布大小
plt.figure(figsize=(10, 10))

# 中文标题
# plt.rcParams['font.sans-serif'] = ['SimHei']
# plt.rcParams['axes.unicode_minus'] = False
# plt.title('鸢尾花线性数据示例')

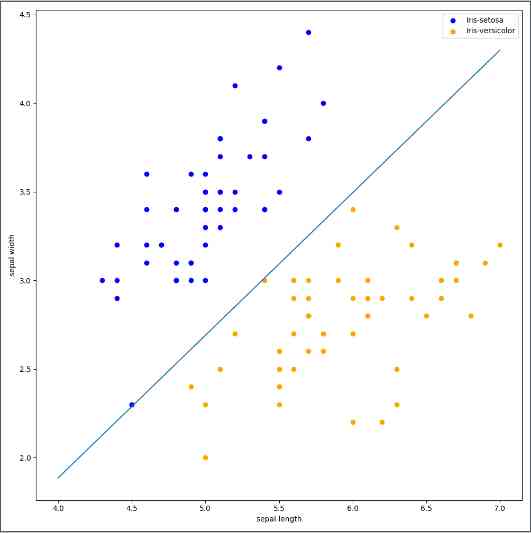
plt.scatter(data[:50, 0], data[:50, 1], c='b', label='Iris-setosa',)
plt.scatter(data[50:100, 0], data[50:100, 1], c='orange', label='Iris-versicolor')

# 画感知机的线
x_ponits = np.arange(4, 8)
y_ = -(clf.coef_[0][0]*x_ponits + clf.intercept_)/clf.coef_[0][1]
plt.plot(x_ponits, y_)

# 其他部分
plt.legend()  # 显示图例
plt.grid(False)  # 不显示网格
plt.xlabel('sepal length')
plt.ylabel('sepal width')
plt.legend()
plt.show()
结果如图

版权声明
本文为[Allez_Levide]所创,转载请带上原文链接,感谢
https://my.oschina.net/LevideGrowthHistory/blog/4710101
边栏推荐
- The way of a million year salary Architect: on the architecture design of application system
- 【分享】接口测试如何在post请求中传递文件
- 基于Chef InSpec的基础设施测试
- 堆重启_uaf_hacknote
- shell脚本快速入门----shell基本语法总结
- Arthas Install 快速安装文档
- 融云完成数亿人民币 D 轮融资,将持续打造全球云通信能力
- Service registration and discovery of go micro integration Nacos
- A quick start to Shell Scripting
- Why does it take more and more time to develop a software?
猜你喜欢

程序员过高工资导致加班?应该降低程序员工资?网友:放过其他苦逼的程序员吧

Full link stress testing of moral integrity -- the evolution of corpus intelligence

What kind of experience does a doctor have when he turns his secret love brother into a husband?

同事笔记-小程序入坑点

Chinese programmer vs Japanese programmer, full screen shame!

使用基于GAN的过采样技术提高非平衡COVID-19死亡率预测的模型准确性

Cad2016 download autocad2016 download installation detailed tutorial CAD Download

The technology masters who ride the wind and waves gather again | Tencent cloud TVP continues to sail

Service registration and discovery of go micro integration Nacos

我叫Mongo,收了「查询基础篇」,值得你拥有
随机推荐
Explain three different authentication protocols in detail
5分钟GET我使用Github 5 年总结的这些骚操作!
深入分析商淘多用户商城系统如何从搜索着手打造盈利点
The worst hacker in history: stealing $1 billion of bitcoin without spending it for seven years, and finally being seized by the Department of justice
微服务框架 Go-Micro 集成 Nacos 实战之服务注册与发现
5 minutes get I use GitHub's 5-year summary of these operations!
[share] interface tests how to transfer files in post request
同事笔记-小程序入坑点
要我说,多线程事务它必须就是个伪命题!
I do digital transformation in traditional industries (1)
MES system is different from traditional management in industry application
深入探索 Android Gradle 插件的缓存配置
Help enterprises to get rid of difficulties, famous enterprises return home Engineers: success depends on it!
要我说,多线程事务它必须就是个伪命题!
Put method of immutablemap
用微信表情翻译表白,程序员的小浪漫,赶紧Get起来!
干货推荐:关于网络安全技术的专业术语,你知道多少?
A quick start to Shell Scripting
International top journal radiology published the latest joint results of Huawei cloud, AI assisted detection of cerebral aneurysms
Chinese programmer vs Japanese programmer, full screen shame!