summary
occasionally , Cluster resources have been deleted or modified for no reason , It may be human error , It could be an app bug Or malware calls apiserver Interface causes , Need to find out " Murderers ". Now , We need to start auditing for clusters , Record apiserver Call the interface of , Then search and analyze the audit log according to the conditions to find the reason .
About TKE A brief introduction and basic operation of cluster audit , Please refer to the official documentation Cluster audit . Because the data of cluster audit is stored in the log service , So we need to search and analyze the audit results in the log service console , Please refer to Log retrieval syntax and rules , To do the analysis, you need to write the log service supported SQL sentence , Please refer to Introduction to log service analysis .
notes : This article only applies to TKE colony
Examples of scenarios
Here are some examples of cluster audit usage scenarios and queries .
Find out who did the operation
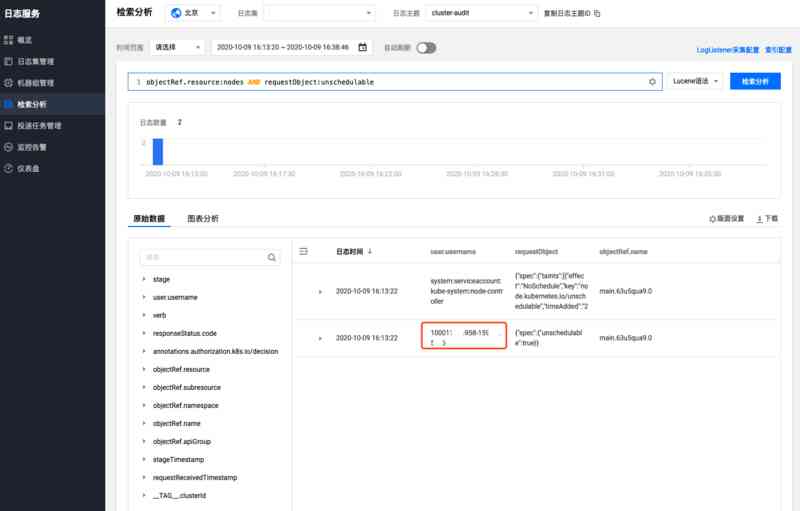
If the node is blocked , I don't know which application or human operation it is , We need to find out , After the cluster audit is enabled , Use the following statement to retrieve :
objectRef.resource:nodes AND requestObject:unschedulable Layout settings can be set to display user.username, requestObject and objectRef.name Three fields , The user who does the operation 、 Request content and node name :

As can be seen from the above figure , yes 10001****958 This sub account is in 2020-10-09 16:13:22 The time is right main.63u5qua9.0 This node is blocked , We are Access management - user - User list According to the account number ID Find out more about this sub account .
If a workload is deleted , Want to know who deleted , Here we use deployments/nginx For example, to query :
objectRef.resource:deployments AND objectRef.name:"nginx" AND verb:"delete"Query results :

Finding out leads to apiserver The real killer of frequency limit
apiserver There will be default request frequency limit protection , Avoid malware or bug Cause to be right apiserver Request frequency is too high , bring apiserver/etcd Overload , Affect normal requests . If frequency limiting occurs , We can audit to find out who is making a lot of requests .
If we pass userAgent To analyze the client side of the request , First, you need to modify the key value index of the log topic , by userAgent Field open statistics :

By SQL Statement to count each client request apiserver Of QPS size :
* | SELECT CAST((__TIMESTAMP_US__ /1000-__TIMESTAMP_US__ /1000%1000) as TIMESTAMP) AS time, COUNT(1) AS qps,userAgent GROUP BY time,userAgent ORDER BY timeSwitch to icon analysis , Select line chart ,X For shaft time,Y For shaft qps, Aggregate columns use userAgent:

You can see the data , But there may be too many results , The small panel can't show , Click Add to dashboard , Zoom in :

In this case, we can see that kube-state-metrics This client is right apiserver Request frequency is much higher than other clients , That's where we find " Murderers " yes kube-state-metrics, Look at the log and you can see that it's because RBAC The problem of power leads to kube-state-metrics Keep asking apiserver retry , Triggered apiserver Frequency limit of :
I1009 13:13:09.760767       1 request.go:538] Throttling request took 1.393921018s, request: GET:https://172.16.252.1:443/api/v1/endpoints?limit=500&resourceVersion=1029843735
E1009 13:13:09.766106       1 reflector.go:156] pkg/mod/k8s.io/[email protected]/tools/cache/reflector.go:108: Failed to list *v1.Endpoints: endpoints is forbidden: User "system:serviceaccount:monitoring:kube-state-metrics" cannot list resource "endpoints" in API group "" at the cluster scope
Empathy , If you want to use other fields to distinguish the clients to be counted , It can be flexibly modified according to requirements SQL, For example, use user.username To distinguish between ,SQL Write it like this :
* | SELECT CAST((__TIMESTAMP_US__ /1000-__TIMESTAMP_US__ /1000%1000) as TIMESTAMP) AS time, COUNT(1) AS qps,user.username GROUP BY time,user.username ORDER BY timeAccording to the effect :

Summary
This article introduces how to use TKE To assist us in troubleshooting , Some practical examples are given .
Reference material
- Cluster auditor website document : https://cloud.tencent.com/doc...
- Syntax rules for log service retrieval : https://cloud.tencent.com/doc...
- Introduction to log service analysis : https://cloud.tencent.com/doc...
【 Tencent cloud native 】 Cloud said new products 、 Cloud research new technology 、 Travel new life 、 Cloud View information , Scan code is concerned about the official account number of the same name , Get more dry goods in time !!


