当前位置:网站首页>Brief description of grafana of # yyds dry goods inventory # Prometheus
Brief description of grafana of # yyds dry goods inventory # Prometheus
2022-07-02 01:15:00 【key_ 3_ feng】
Grafana Support many different types of time series databases ( Data sources ), Each data source has a specific query editor , The editor customizes the features and functions exposed by specific data sources ,Grafana It can well support the characteristics of each data source .Grafana There are several data sources officially supported :Graphite、InfluxDB、OpenTSDB、Prometheus、Elasticsearch、CloudWatch. Each data source has different query languages and functions . Users can combine data from multiple data sources into a single dashboard (Dashboard) On , But each panel (Panel) Are bound to specific data sources belonging to specific organizations .
Grafana Support multiple organizations , To support various deployment models , Including the use of a single Grafana Instances serve multiple organizations that may not be trusted . in many instances ,Grafana Will be deployed in an organization . Each organization can have one or more data sources . All dashboards are owned by specific organizations . It should be noted that , Most monitoring indicator databases do not provide any type of user series authentication . therefore , stay Grafana in , Data sources and dashboards are available to all users in a particular organization .
User is Grafana User account specified in . A user can belong to one or more organizations , You can assign different levels of permissions to them through roles . in addition ,Grafana Support various user authentication methods , For users to authenticate .
The panel is Grafana The most basic visualization module . Each panel provides a query editor ( Depends on the data source selected in the panel ), You can use the query editor to create a perfect display chart .Grafana The default panels used include Graph、Singlestat、Table、Heatmap、Alert list、Dashboard list and Text.
Line is Grafana Logical partition in the dashboard interface , Used to integrate multiple panels (Panel) Together for management . OK, generally 12 individual “ Company ” Width . The width of the drawing unit is Grafana A strategy adopted to support automatic scaling on screens of different resolutions , Control the relative width of the panel in the row by setting a specific width .
Query Editor It can be understood as statement management , Each panel is provided with a Query Editor, You can write statements to effectively control the panel to display different charts in real time .Grafana Reference the query through the row in the query editor .
The dashboard is Grafana Used to show the core of the chart , It is composed of one or more panels and arranged in one or more rows , So as to realize various panels . The dashboard can also enable users to dynamically and interactively choose to display data through templates . It also supports sharing in many different ways , For example, support login Grafana Users of share links ; Use the snapshot function to encode all the data currently being viewed as static and interactive JSON file .
边栏推荐
- Global and Chinese market of collaborative applications 2022-2028: Research Report on technology, participants, trends, market size and share
- Global and Chinese markets for supply chain strategy and operation consulting 2022-2028: Research Report on technology, participants, trends, market size and share
- How does schedulerx help users solve the problem of distributed task scheduling?
- gradle
- 8.8.4-PointersOnC-20220215
- Global and Chinese markets for the application of artificial intelligence in security, public security and national security 2022-2028: Research Report on technology, participants, trends, market size
- 程序员该如何更好的规划自己的职业发展?
- Sql--- related transactions
- Geek DIY open source solution sharing - digital amplitude frequency equalization power amplifier design (practical embedded electronic design works, comprehensive practice of software and hardware)
- 学习笔记25--多传感器前融合技术
猜你喜欢

Datawhale 社区黑板报(第1期)
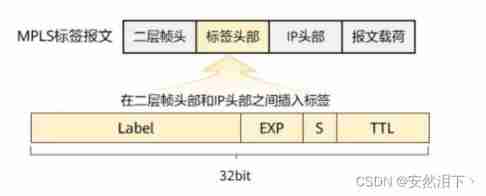
Hcip day 14 (MPLS protocol)
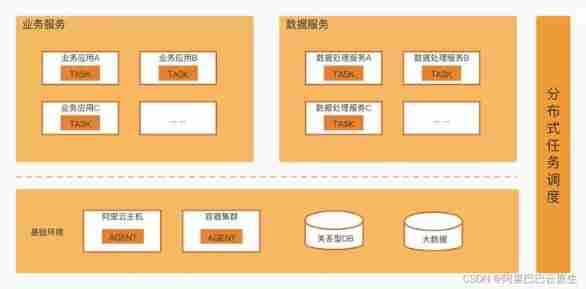
How does schedulerx help users solve the problem of distributed task scheduling?
![[conference resources] the Third International Conference on Automation Science and Engineering in 2022 (jcase 2022)](/img/a6/a2afdf9e18255c9171f61bf074998b.png)
[conference resources] the Third International Conference on Automation Science and Engineering in 2022 (jcase 2022)

【疾病检测】基于BP神经网络实现肺癌检测系统含GUI界面

Based on Simulink and FlightGear, the dynamic control of multi rotor UAV in equilibrium is modeled and simulated
工作中非常重要的测试策略,你大概没注意过吧

Infiltration records of CFS shooting range in the fourth phase of the western regions' Dadu Mansion

Sql--- related transactions
![[eight sorting ③] quick sorting (dynamic graph deduction Hoare method, digging method, front and back pointer method)](/img/c2/7ebc67e9b886e3baf3c98489bf9bce.png)
[eight sorting ③] quick sorting (dynamic graph deduction Hoare method, digging method, front and back pointer method)
随机推荐
AIX存储管理之总结篇
Load and domcontentloaded in JS
ECS project deployment
Based on Simulink and FlightGear, the dynamic control of multi rotor UAV in equilibrium is modeled and simulated
Develop a simple login logic based on SSM
Exclusive delivery of secret script move disassembly (the first time)
【疾病检测】基于BP神经网络实现肺癌检测系统含GUI界面
Principle of finding combinatorial number and template code
学习笔记2--高精度地图定义及价值
Evolution of Himalayan self-developed gateway architecture
No converter found for return value of type: class
Circular statements in shell programming
Zak's latest "neural information transmission", with slides and videos
Picture puzzle wechat applet source code_ Support multi template production and traffic master
什么是商业养老保险?商业养老保险安全靠谱吗?
SAP ui5 beginner tutorial XXI - trial version of custom formatter of SAP ui5
AIX存储管理之卷组的创建(一)
Two TVs
[image enhancement] vascular image enhancement based on frangi filter with matlab code
Design and control of multi rotor aircraft (VII) -- sensor calibration and measurement model