当前位置:网站首页>prometheus monitoring mysql_galera cluster
prometheus monitoring mysql_galera cluster
2022-08-02 08:23:00 【Daxinxin Dahaohao】
prometheus监控mysql_galera集群
Record it and open itprometheus-mysql-galera监控的方式.
This article records thatmysql_galera集群的监控,The main difference from a single point isdashboard的选择上.Some clusters need to be addedmetric显示
我这里使用的是service形式,不是使用的docker形式,Because it feels so much moredocker,Fear of the risk of miscalculation when something goes wrong.
环境列表
- mysql版本:10.5.11-MariaDB
- mysql数据库端口:3306
- 数据库IP:192.168.0.1,192.168.0.2,192.168.0.3
- prometheus版本:2.37.0
- granafa版本:9.0.4
- mysql-dashboard-ID:11329,Fine-tuned based on this template
Preparation within the database
数据库内增加expoterUser used and empowered
- 新建用户:mysqlexpoter
- 密码:prometheus
- 权限:*.* TO ‘mysqlexpoter’@‘%’
CREATE USER 'mysqlexpoter'@'%' IDENTIFIED BY 'prometheus' WITH MAX_USER_CONNECTIONS 3;
GRANT ALL PRIVILEGES ON *.* TO 'mysqlexpoter'@'%' IDENTIFIED BY 'prometheus';
flush privileges;
expoter准备
直接从git上下载即可
wget https://github.com/prometheus/mysqld_exporter/releases/download/v0.14.0/mysqld_exporter-0.14.0.linux-amd64.tar.gz
tar -xvf mysqld_exporter-0.14.0.linux-amd64.tar.gz
cp mysqld_exporter-0.14.0.linux-amd64/mysqld_exporter /usr/local/bin/
配置文件准备
注意,It must be executed once on each node,for each nodeexpoter提供配置文件
/usr/local/bin/mysqldexpoter.my.cnf
cat << EOF > /usr/local/bin/mysqldexpoter.my.cnf [client] user=mysqlexpoter password=prometheus host=192.168.xx.xx port=3306 EOF
service文件准备
注意,It must be executed once on each database node,Equivalent to starting on each nodeexpoter服务
这里使用serviceThe form can improve the convenience of use,Consistent with other existing services
The executable path used is :/usr/local/bin/mysqld_exporter
配置文件路径为:/usr/local/bin/mysqldexpoter.my.cnf
端口为:9104
cat << EOF > /usr/lib/systemd/system/mysqld_exporter.service [Unit] Description=mysqld_exporter Documentation=https://prometheus.io Wants=network-online.target After=network.target [Service] Type=simple User=root ExecStart=/usr/local/bin/mysqld_exporter --config.my-cnf /usr/local/bin/mysqldexpoter.my.cnf --web.listen-address=0.0.0.0:9104 \ --collect.slave_status \ --collect.binlog_size \ --collect.info_schema.processlist \ --collect.info_schema.innodb_metrics \ --collect.engine_innodb_status \ --collect.perf_schema.file_events Restart=on-failure [Install] WantedBy=multi-user.target EOF
服务启动
systemctl daemon-reload
systemctl start mysqld_exporter
systemctl enable mysqld_exporter
systemctl status mysqld_exporter
prometheus-job配置
targetThe information of all nodes in the cluster is configured here,This is also different from a single pointmysqlMonitoring configuration differences
  - job_name: 'mysql-galera'
    static_configs:
    - targets:
        - '192.168.0.1:9104'
        - '192.168.0.2:9104'
        - '192.168.0.3:9104'
granafa-dashboard数据展示
我这里使用的dashboard是基于11329改造的,删除了DB的Variables,Added cluster status display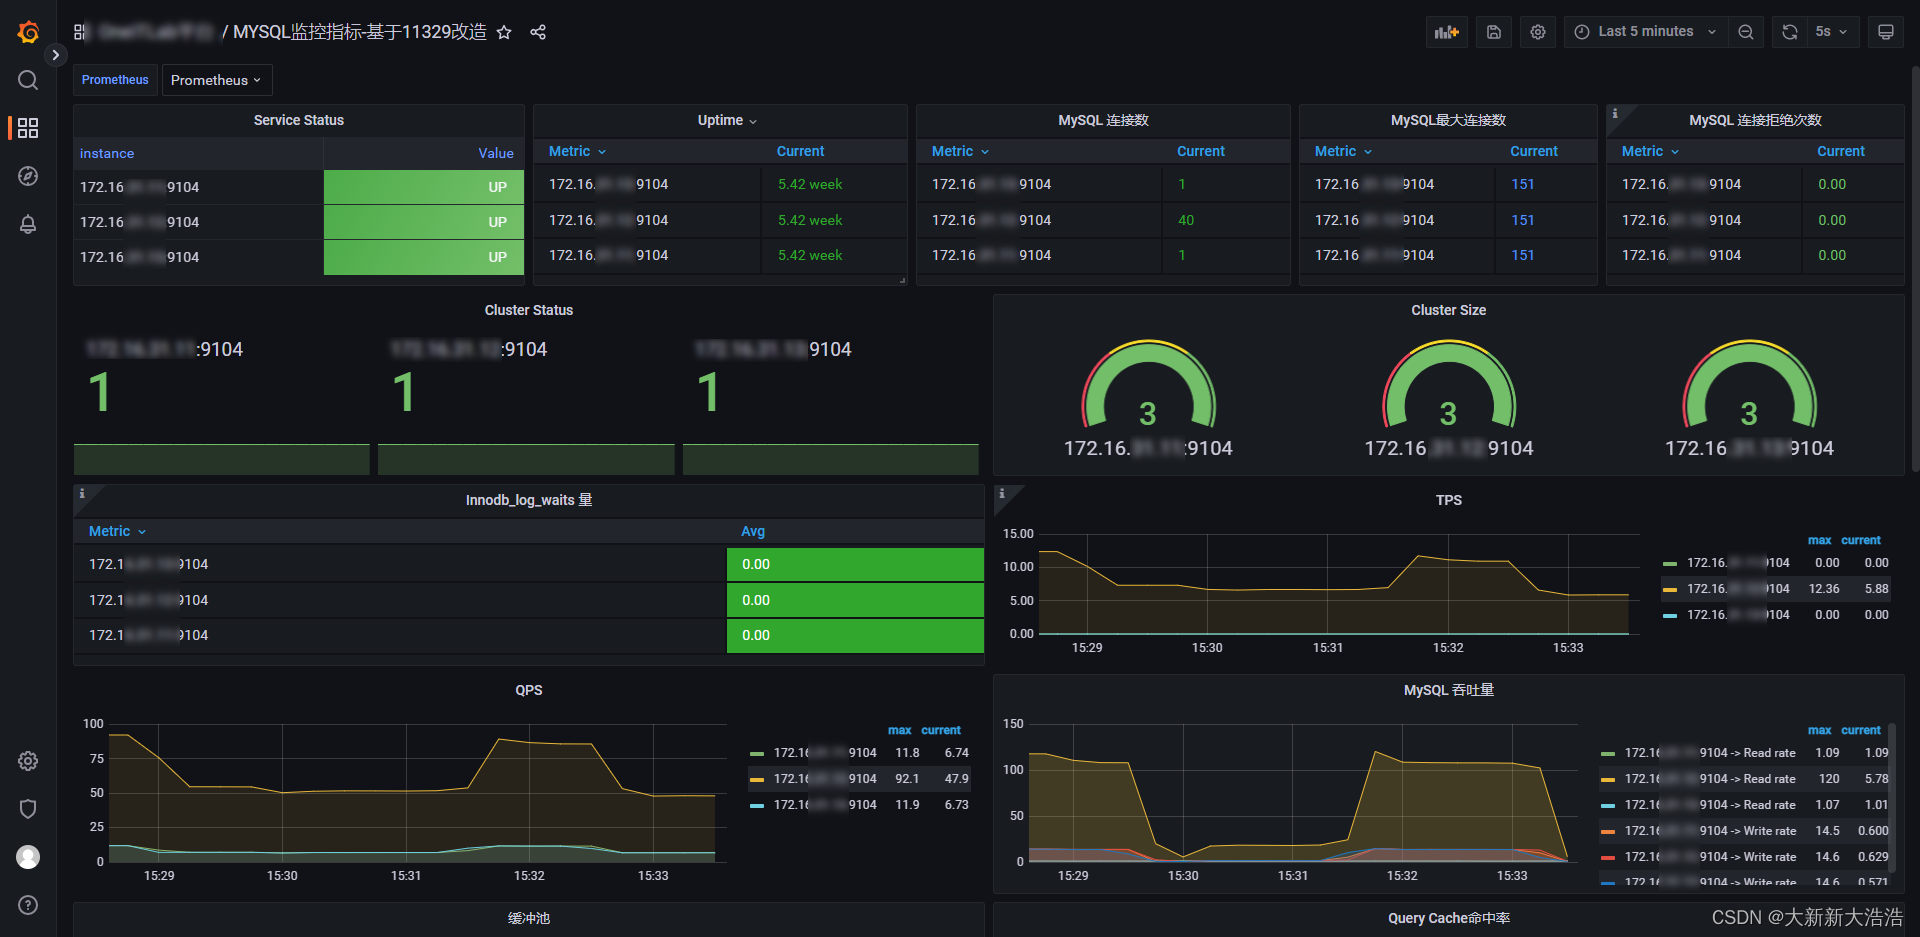
dashboard的json信息,需要的可以参考下
{
"annotations": {
"list": [
{
"builtIn": 1,
"datasource": {
"type": "datasource",
"uid": "grafana"
},
"enable": true,
"hide": true,
"iconColor": "rgba(0, 211, 255, 1)",
"name": "Annotations & Alerts",
"target": {
"limit": 100,
"matchAny": false,
"tags": [],
"type": "dashboard"
},
"type": "dashboard"
}
]
},
"description": "Mysql-exporter监控",
"editable": true,
"fiscalYearStartMonth": 0,
"gnetId": 11329,
"graphTooltip": 0,
"id": 14,
"links": [],
"liveNow": false,
"panels": [
{
"datasource": {
"type": "prometheus",
"uid": "5KkZmIzVz"
},
"description": "",
"fieldConfig": {
"defaults": {
"custom": {
"align": "auto",
"displayMode": "auto",
"filterable": false,
"inspect": false
},
"mappings": [
{
"options": {
"0": {
"text": "DOWN"
},
"1": {
"text": "UP"
}
},
"type": "value"
}
],
"thresholds": {
"mode": "absolute",
"steps": [
{
"color": "green",
"value": null
},
{
"color": "red",
"value": 0
}
]
}
},
"overrides": [
{
"matcher": {
"id": "byType",
"options": "number"
},
"properties": [
{
"id": "custom.displayMode",
"value": "color-background"
},
{
"id": "thresholds",
"value": {
"mode": "absolute",
"steps": [
{
"color": "red",
"value": null
},
{
"color": "green",
"value": 1
}
]
}
},
{
"id": "custom.width",
"value": 200
}
]
}
]
},
"gridPos": {
"h": 5,
"w": 6,
"x": 0,
"y": 0
},
"id": 32,
"options": {
"footer": {
"fields": "",
"reducer": [
"sum"
],
"show": false
},
"showHeader": true,
"sortBy": []
},
"pluginVersion": "9.0.5",
"targets": [
{
"datasource": {
"type": "prometheus",
"uid": "5KkZmIzVz"
},
"expr": "mysql_up",
"format": "table",
"instant": true,
"interval": "",
"intervalFactor": 1,
"legendFormat": "",
"refId": "A"
}
],
"title": "Service Status",
"transformations": [
{
"id": "filterFieldsByName",
"options": {
"include": {
"names": [
"instance",
"Value"
]
}
}
}
],
"type": "table"
},
{
"columns": [
{
"$$hashKey": "object:714",
"text": "Current",
"value": "current"
}
],
"datasource": {
"type": "prometheus",
"uid": "$Prometheus"
},
"fontSize": "100%",
"gridPos": {
"h": 5,
"w": 5,
"x": 6,
"y": 0
},
"id": 16,
"links": [],
"pluginVersion": "6.1.4",
"scroll": true,
"showHeader": true,
"sort": {
"col": 0,
"desc": true
},
"styles": [
{
"alias": "Time",
"align": "auto",
"dateFormat": "YYYY-MM-DD HH:mm:ss",
"pattern": "Time",
"type": "date"
},
{
"alias": "",
"align": "auto",
"colorMode": "value",
"colors": [
"rgba(245, 54, 54, 0.9)",
"rgba(237, 129, 40, 0.89)",
"rgba(50, 172, 45, 0.97)"
],
"decimals": 2,
"pattern": "/.*/",
"thresholds": [
"1",
"100"
],
"type": "number",
"unit": "s"
}
],
"targets": [
{
"datasource": {
"uid": "$Prometheus"
},
"expr": "mysql_global_status_uptime",
"format": "time_series",
"intervalFactor": 1,
"legendFormat": "{
{instance}}",
"refId": "A"
}
],
"title": "Uptime",
"transform": "timeseries_aggregations",
"type": "table-old"
},
{
"columns": [
{
"$$hashKey": "object:127",
"text": "Current",
"value": "current"
}
],
"datasource": {
"type": "prometheus",
"uid": "$Prometheus"
},
"fontSize": "100%",
"gridPos": {
"h": 5,
"w": 5,
"x": 11,
"y": 0
},
"id": 6,
"links": [],
"pluginVersion": "6.1.4",
"scroll": true,
"showHeader": true,
"sort": {
"col": 0,
"desc": true
},
"styles": [
{
"alias": "Time",
"align": "auto",
"dateFormat": "YYYY-MM-DD HH:mm:ss",
"pattern": "Time",
"type": "date"
},
{
"alias": "",
"align": "auto",
"colorMode": "value",
"colors": [
"rgba(50, 172, 45, 0.97)",
"rgba(237, 129, 40, 0.89)",
"rgba(245, 54, 54, 0.9)"
],
"decimals": 0,
"pattern": "/.*/",
"thresholds": [
"100",
"800"
],
"type": "number",
"unit": "short"
}
],
"targets": [
{
"datasource": {
"uid": "$Prometheus"
},
"expr": "mysql_global_status_threads_connected",
"format": "time_series",
"intervalFactor": 1,
"legendFormat": "{
{instance}}",
"refId": "A"
}
],
"title": "MySQL 连接数",
"transform": "timeseries_aggregations",
"type": "table-old"
},
{
"columns": [
{
"$$hashKey": "object:181",
"text": "Current",
"value": "current"
}
],
"datasource": {
"type": "prometheus",
"uid": "$Prometheus"
},
"fontSize": "100%",
"gridPos": {
"h": 5,
"w": 4,
"x": 16,
"y": 0
},
"id": 17,
"links": [],
"pluginVersion": "6.1.4",
"scroll": true,
"showHeader": true,
"sort": {
"col": 0,
"desc": true
},
"styles": [
{
"alias": "Time",
"align": "auto",
"dateFormat": "YYYY-MM-DD HH:mm:ss",
"pattern": "Time",
"type": "date"
},
{
"alias": "",
"align": "auto",
"colorMode": "value",
"colors": [
"#5794F2",
"#5794F2",
"rgb(54, 121, 224)"
],
"decimals": 0,
"pattern": "/.*/",
"thresholds": [
""
],
"type": "number",
"unit": "none"
}
],
"targets": [
{
"datasource": {
"uid": "$Prometheus"
},
"expr": "mysql_global_variables_max_connections",
"format": "time_series",
"intervalFactor": 1,
"legendFormat": "{
{instance}}",
"refId": "A"
}
],
"title": "MySQL最大连接数",
"transform": "timeseries_aggregations",
"type": "table-old"
},
{
"columns": [
{
"$$hashKey": "object:228",
"text": "Current",
"value": "current"
}
],
"datasource": {
"type": "prometheus",
"uid": "$Prometheus"
},
"description": "每秒的次数",
"fontSize": "100%",
"gridPos": {
"h": 5,
"w": 4,
"x": 20,
"y": 0
},
"id": 8,
"links": [],
"pluginVersion": "6.1.4",
"scroll": true,
"showHeader": true,
"sort": {
"col": 0,
"desc": true
},
"styles": [
{
"alias": "Time",
"align": "auto",
"dateFormat": "YYYY-MM-DD HH:mm:ss",
"pattern": "Time",
"type": "date"
},
{
"alias": "",
"align": "auto",
"colorMode": "value",
"colors": [
"#73BF69",
"#FF9830",
"#F2495C"
],
"decimals": 2,
"pattern": "/.*/",
"thresholds": [
"1",
"3"
],
"type": "number",
"unit": "short"
}
],
"targets": [
{
"datasource": {
"uid": "$Prometheus"
},
"expr": "rate(mysql_global_status_aborted_connects[2m])",
"format": "time_series",
"intervalFactor": 1,
"legendFormat": "{
{instance}}",
"refId": "A"
}
],
"title": "MySQL Number of connection rejections",
"transform": "timeseries_aggregations",
"type": "table-old"
},
{
"datasource": {
"type": "prometheus",
"uid": "5KkZmIzVz"
},
"fieldConfig": {
"defaults": {
"mappings": [],
"thresholds": {
"mode": "absolute",
"steps": [
{
"color": "red",
"value": null
},
{
"color": "green",
"value": 1
}
]
}
},
"overrides": []
},
"gridPos": {
"h": 5,
"w": 12,
"x": 0,
"y": 5
},
"id": 34,
"options": {
"colorMode": "value",
"graphMode": "area",
"justifyMode": "auto",
"orientation": "auto",
"reduceOptions": {
"calcs": [
"mean"
],
"fields": "",
"values": false
},
"textMode": "auto"
},
"pluginVersion": "9.0.5",
"targets": [
{
"datasource": {
"type": "prometheus",
"uid": "5KkZmIzVz"
},
"expr": "mysql_global_status_wsrep_cluster_status",
"instant": false,
"interval": "",
"legendFormat": "",
"refId": "A"
}
],
"title": "Cluster Status",
"transformations": [
{
"id": "labelsToFields",
"options": {
"valueLabel": "instance"
}
},
{
"id": "merge",
"options": {
}
}
],
"transparent": true,
"type": "stat"
},
{
"datasource": {
"type": "prometheus",
"uid": "5KkZmIzVz"
},
"fieldConfig": {
"defaults": {
"mappings": [],
"max": 3,
"min": 0,
"thresholds": {
"mode": "absolute",
"steps": [
{
"color": "red",
"value": null
},
{
"color": "yellow",
"value": 1.0001
},
{
"color": "green",
"value": 2.0001
}
]
}
},
"overrides": []
},
"gridPos": {
"h": 5,
"w": 12,
"x": 12,
"y": 5
},
"id": 36,
"options": {
"orientation": "auto",
"reduceOptions": {
"calcs": [
"last"
],
"fields": "",
"values": false
},
"showThresholdLabels": false,
"showThresholdMarkers": true
},
"pluginVersion": "9.0.5",
"targets": [
{
"datasource": {
"type": "prometheus",
"uid": "5KkZmIzVz"
},
"expr": "mysql_global_status_wsrep_cluster_size",
"format": "time_series",
"instant": false,
"interval": "",
"legendFormat": "",
"refId": "A"
}
],
"title": "Cluster Size",
"transformations": [
{
"id": "labelsToFields",
"options": {
"valueLabel": "instance"
}
},
{
"id": "merge",
"options": {
}
}
],
"type": "gauge"
},
{
"columns": [
{
"$$hashKey": "object:310",
"text": "Avg",
"value": "avg"
}
],
"datasource": {
"type": "prometheus",
"uid": "$Prometheus"
},
"description": "Innodb_log_waits值不等于0的话,表明 innodb log buffer 因为空间不足而等待 ",
"fontSize": "100%",
"gridPos": {
"h": 5,
"w": 12,
"x": 0,
"y": 10
},
"id": 30,
"links": [],
"scroll": true,
"showHeader": true,
"sort": {
"col": 0,
"desc": true
},
"styles": [
{
"alias": "Time",
"align": "auto",
"dateFormat": "YYYY-MM-DD HH:mm:ss",
"pattern": "Time",
"type": "date"
},
{
"alias": "",
"align": "auto",
"colorMode": "cell",
"colors": [
"rgba(50, 172, 45, 0.97)",
"#F2495C",
"rgba(245, 54, 54, 0.9)"
],
"decimals": 2,
"pattern": "/.*/",
"thresholds": [
"1",
"2"
],
"type": "number",
"unit": "short"
}
],
"targets": [
{
"datasource": {
"uid": "$Prometheus"
},
"expr": "mysql_global_status_innodb_log_waits",
"format": "time_series",
"intervalFactor": 1,
"legendFormat": "{
{instance}}",
"refId": "A"
}
],
"title": "Innodb_log_waits 量 ",
"transform": "timeseries_aggregations",
"type": "table-old"
},
{
"aliasColors": {
"172.27.83.231:9104": "dark-blue"
},
"bars": false,
"dashLength": 10,
"dashes": false,
"datasource": {
"type": "prometheus",
"uid": "$Prometheus"
},
"decimals": 2,
"description": "5range in minutes for comparison",
"fill": 1,
"fillGradient": 0,
"gridPos": {
"h": 5,
"w": 12,
"x": 12,
"y": 10
},
"hiddenSeries": false,
"id": 18,
"interval": "",
"legend": {
"alignAsTable": true,
"avg": false,
"current": true,
"hideEmpty": false,
"max": true,
"min": false,
"rightSide": true,
"show": true,
"total": false,
"values": true
},
"lines": true,
"linewidth": 1,
"links": [],
"nullPointMode": "null",
"options": {
"alertThreshold": true
},
"percentage": false,
"pluginVersion": "9.0.5",
"pointradius": 2,
"points": false,
"renderer": "flot",
"seriesOverrides": [],
"spaceLength": 10,
"stack": false,
"steppedLine": false,
"targets": [
{
"datasource": {
"uid": "$Prometheus"
},
"expr": "sum(rate(mysql_global_status_commands_total{command=\"commit\"}[5m]))by(instance)+sum(rate(mysql_global_status_commands_total{command=\"rollback\"}[5m]))by(instance)",
"format": "time_series",
"instant": false,
"intervalFactor": 1,
"legendFormat": "{
{instance}}",
"refId": "A"
}
],
"thresholds": [],
"timeRegions": [],
"title": "TPS",
"tooltip": {
"shared": true,
"sort": 0,
"value_type": "individual"
},
"transparent": true,
"type": "graph",
"xaxis": {
"mode": "time",
"show": true,
"values": []
},
"yaxes": [
{
"decimals": 2,
"format": "short",
"label": "",
"logBase": 1,
"show": true
},
{
"format": "short",
"logBase": 1,
"show": true
}
],
"yaxis": {
"align": false
}
},
{
"aliasColors": {
"172.27.83.231:9104": "blue"
},
"bars": false,
"dashLength": 10,
"dashes": false,
"datasource": {
"type": "prometheus",
"uid": "$Prometheus"
},
"fill": 1,
"fillGradient": 0,
"gridPos": {
"h": 6,
"w": 12,
"x": 0,
"y": 15
},
"hiddenSeries": false,
"id": 14,
"interval": "",
"legend": {
"alignAsTable": true,
"avg": false,
"current": true,
"max": true,
"min": false,
"rightSide": true,
"show": true,
"total": false,
"values": true
},
"lines": true,
"linewidth": 1,
"links": [],
"nullPointMode": "null",
"options": {
"alertThreshold": true
},
"percentage": false,
"pluginVersion": "9.0.5",
"pointradius": 2,
"points": false,
"renderer": "flot",
"seriesOverrides": [],
"spaceLength": 10,
"stack": false,
"steppedLine": false,
"targets": [
{
"datasource": {
"uid": "$Prometheus"
},
"expr": "rate(mysql_global_status_queries[5m]) or irate(mysql_global_status_queries[5m])",
"format": "time_series",
"instant": false,
"intervalFactor": 1,
"legendFormat": "{
{instance}}",
"refId": "A"
}
],
"thresholds": [],
"timeRegions": [],
"title": "QPS",
"tooltip": {
"shared": true,
"sort": 0,
"value_type": "individual"
},
"transparent": true,
"type": "graph",
"xaxis": {
"mode": "time",
"show": true,
"values": []
},
"yaxes": [
{
"format": "short",
"logBase": 1,
"show": true
},
{
"format": "short",
"logBase": 1,
"show": true
}
],
"yaxis": {
"align": false
}
},
{
"aliasColors": {
"172.27.83.231:9104 -> Read rate": "blue",
"172.27.83.231:9104 -> Write rate": "green",
"Read rate": "rgb(55, 117, 36)",
"Write rate": "rgb(139, 134, 217)",
"select": "blue"
},
"bars": false,
"dashLength": 10,
"dashes": false,
"datasource": {
"type": "prometheus",
"uid": "$Prometheus"
},
"fill": 2,
"fillGradient": 0,
"gridPos": {
"h": 6,
"w": 12,
"x": 12,
"y": 15
},
"hiddenSeries": false,
"id": 2,
"interval": "",
"legend": {
"alignAsTable": true,
"avg": false,
"current": true,
"max": true,
"min": false,
"rightSide": true,
"show": true,
"total": false,
"values": true
},
"lines": true,
"linewidth": 1,
"links": [],
"nullPointMode": "null",
"options": {
"alertThreshold": true
},
"percentage": false,
"pluginVersion": "9.0.5",
"pointradius": 2,
"points": false,
"renderer": "flot",
"seriesOverrides": [],
"spaceLength": 10,
"stack": false,
"steppedLine": false,
"targets": [
{
"datasource": {
"uid": "$Prometheus"
},
"expr": "rate(mysql_global_status_questions[2m])",
"format": "time_series",
"intervalFactor": 1,
"legendFormat": "{
{instance}} -> Read rate",
"refId": "A"
},
{
"datasource": {
"uid": "$Prometheus"
},
"expr": "sum(rate(mysql_global_status_commands_total{command=~\"insert|update|delete\"}[2m])) without (command)",
"format": "time_series",
"intervalFactor": 1,
"legendFormat": "{
{instance}} -> Write rate",
"refId": "B"
}
],
"thresholds": [],
"timeRegions": [],
"title": "MySQL 吞吐量",
"tooltip": {
"shared": true,
"sort": 0,
"value_type": "individual"
},
"type": "graph",
"xaxis": {
"mode": "time",
"show": true,
"values": []
},
"yaxes": [
{
"format": "none",
"logBase": 1,
"show": true
},
{
"format": "none",
"logBase": 1,
"show": true
}
],
"yaxis": {
"align": false
}
},
{
"aliasColors": {
"172.27.83.226:9104 -> Disk Growth ": "blue",
"172.27.83.231:9104 -> Disk Growth ": "purple",
"172.27.83.231:9104 -> 缓冲池 Utilization ": "light-yellow",
"Disk growth rate": "light-red",
"缓冲池 Utilization ratio": "rgb(14, 122, 101)"
},
"bars": false,
"dashLength": 10,
"dashes": false,
"datasource": {
"uid": "$Prometheus"
},
"fill": 1,
"fillGradient": 0,
"gridPos": {
"h": 7,
"w": 12,
"x": 0,
"y": 21
},
"hiddenSeries": false,
"id": 10,
"legend": {
"alignAsTable": true,
"avg": false,
"current": true,
"max": false,
"min": false,
"rightSide": true,
"show": true,
"total": false,
"values": true
},
"lines": true,
"linewidth": 1,
"links": [],
"nullPointMode": "null",
"options": {
"alertThreshold": true
},
"percentage": false,
"pluginVersion": "9.0.5",
"pointradius": 2,
"points": false,
"renderer": "flot",
"seriesOverrides": [],
"spaceLength": 10,
"stack": false,
"steppedLine": false,
"targets": [
{
"datasource": {
"uid": "$Prometheus"
},
"expr": "((sum(mysql_global_status_buffer_pool_pages) by (instance) - sum(mysql_global_status_buffer_pool_pages{state=\"free\"}) by (instance)) / sum(mysql_global_status_buffer_pool_pages) by (instance))*100",
"format": "time_series",
"intervalFactor": 1,
"legendFormat": "{
{instance}} -> 缓冲池 Utilization ",
"refId": "A"
},
{
"datasource": {
"uid": "$Prometheus"
},
"expr": "rate(mysql_global_status_innodb_buffer_pool_reads[2m])",
"format": "time_series",
"intervalFactor": 1,
"legendFormat": "{
{instance}} -> Disk Growth ",
"refId": "B"
}
],
"thresholds": [],
"timeRegions": [],
"title": "缓冲池",
"tooltip": {
"shared": true,
"sort": 0,
"value_type": "individual"
},
"type": "graph",
"xaxis": {
"mode": "time",
"show": true,
"values": []
},
"yaxes": [
{
"format": "percent",
"logBase": 1,
"show": true
},
{
"format": "short",
"logBase": 1,
"show": true
}
],
"yaxis": {
"align": false
}
},
{
"aliasColors": {
"172.27.83.231:9104": "blue"
},
"bars": false,
"dashLength": 10,
"dashes": false,
"datasource": {
"type": "prometheus",
"uid": "$Prometheus"
},
"fill": 1,
"fillGradient": 0,
"gridPos": {
"h": 7,
"w": 12,
"x": 12,
"y": 21
},
"hiddenSeries": false,
"id": 22,
"legend": {
"alignAsTable": true,
"avg": false,
"current": true,
"max": false,
"min": false,
"rightSide": true,
"show": true,
"total": false,
"values": true
},
"lines": true,
"linewidth": 1,
"links": [],
"nullPointMode": "null",
"options": {
"alertThreshold": true
},
"percentage": false,
"pluginVersion": "9.0.5",
"pointradius": 2,
"points": false,
"renderer": "flot",
"seriesOverrides": [],
"spaceLength": 10,
"stack": false,
"steppedLine": false,
"targets": [
{
"datasource": {
"uid": "$Prometheus"
},
"expr": "mysql_global_status_qcache_hits/(mysql_global_status_qcache_hits+mysql_global_status_qcache_inserts)",
"format": "time_series",
"intervalFactor": 1,
"legendFormat": "{
{instance}}",
"refId": "A"
}
],
"thresholds": [],
"timeRegions": [],
"title": "Query Cache命中率 ",
"tooltip": {
"shared": true,
"sort": 0,
"value_type": "individual"
},
"type": "graph",
"xaxis": {
"mode": "time",
"show": true,
"values": []
},
"yaxes": [
{
"format": "percentunit",
"label": "",
"logBase": 1,
"max": "1",
"min": "0",
"show": true
},
{
"format": "percentunit",
"logBase": 1,
"show": true
}
],
"yaxis": {
"align": false
}
},
{
"aliasColors": {
"172.27.83.231:9104": "dark-blue"
},
"bars": false,
"dashLength": 10,
"dashes": false,
"datasource": {
"type": "prometheus",
"uid": "$Prometheus"
},
"fill": 1,
"fillGradient": 0,
"gridPos": {
"h": 5,
"w": 12,
"x": 0,
"y": 28
},
"hiddenSeries": false,
"id": 20,
"legend": {
"alignAsTable": true,
"avg": false,
"current": true,
"max": false,
"min": false,
"rightSide": true,
"show": true,
"total": false,
"values": true
},
"lines": true,
"linewidth": 1,
"links": [],
"nullPointMode": "null",
"options": {
"alertThreshold": true
},
"percentage": false,
"pluginVersion": "9.0.5",
"pointradius": 2,
"points": false,
"renderer": "flot",
"seriesOverrides": [],
"spaceLength": 10,
"stack": false,
"steppedLine": false,
"targets": [
{
"datasource": {
"uid": "$Prometheus"
},
"expr": "1-(mysql_global_status_key_reads/mysql_global_status_key_read_requests)",
"format": "time_series",
"intervalFactor": 1,
"legendFormat": "{
{instance}}",
"refId": "A"
}
],
"thresholds": [],
"timeRegions": [],
"title": "key Buffer 命中率 ",
"tooltip": {
"shared": true,
"sort": 0,
"value_type": "individual"
},
"type": "graph",
"xaxis": {
"mode": "time",
"show": true,
"values": []
},
"yaxes": [
{
"format": "percentunit",
"label": "",
"logBase": 1,
"max": "1",
"min": "0",
"show": true
},
{
"format": "percentunit",
"logBase": 1,
"show": true
}
],
"yaxis": {
"align": false
}
},
{
"aliasColors": {
"172.27.83.231:9104": "light-blue"
},
"bars": false,
"dashLength": 10,
"dashes": false,
"datasource": {
"type": "prometheus",
"uid": "$Prometheus"
},
"fill": 1,
"fillGradient": 0,
"gridPos": {
"h": 5,
"w": 12,
"x": 12,
"y": 28
},
"hiddenSeries": false,
"id": 23,
"legend": {
"alignAsTable": true,
"avg": false,
"current": true,
"max": false,
"min": false,
"rightSide": true,
"show": true,
"total": false,
"values": true
},
"lines": true,
"linewidth": 1,
"links": [],
"nullPointMode": "null",
"options": {
"alertThreshold": true
},
"percentage": false,
"pluginVersion": "9.0.5",
"pointradius": 2,
"points": false,
"renderer": "flot",
"seriesOverrides": [],
"spaceLength": 10,
"stack": false,
"steppedLine": false,
"targets": [
{
"datasource": {
"uid": "$Prometheus"
},
"expr": "mysql_global_status_open_tables/mysql_global_status_opened_tables",
"format": "time_series",
"intervalFactor": 1,
"legendFormat": "{
{instance}}",
"refId": "A"
}
],
"thresholds": [],
"timeRegions": [],
"title": "Table Cache状态量 ",
"tooltip": {
"shared": true,
"sort": 0,
"value_type": "individual"
},
"type": "graph",
"xaxis": {
"mode": "time",
"show": true,
"values": []
},
"yaxes": [
{
"format": "percentunit",
"label": "",
"logBase": 1,
"max": "1",
"min": "0",
"show": true
},
{
"format": "percentunit",
"logBase": 1,
"show": true
}
],
"yaxis": {
"align": false
}
},
{
"aliasColors": {
"172.27.83.231:9104": "rgb(47, 117, 219)"
},
"bars": false,
"dashLength": 10,
"dashes": false,
"datasource": {
"type": "prometheus",
"uid": "$Prometheus"
},
"fill": 1,
"fillGradient": 0,
"gridPos": {
"h": 5,
"w": 12,
"x": 0,
"y": 33
},
"hiddenSeries": false,
"id": 21,
"legend": {
"alignAsTable": true,
"avg": false,
"current": true,
"max": false,
"min": false,
"rightSide": true,
"show": true,
"total": false,
"values": true
},
"lines": true,
"linewidth": 1,
"links": [],
"nullPointMode": "null",
"options": {
"alertThreshold": true
},
"percentage": false,
"pluginVersion": "9.0.5",
"pointradius": 2,
"points": false,
"renderer": "flot",
"seriesOverrides": [],
"spaceLength": 10,
"stack": false,
"steppedLine": false,
"targets": [
{
"datasource": {
"uid": "$Prometheus"
},
"expr": "1-mysql_global_status_innodb_buffer_pool_reads/mysql_global_status_innodb_buffer_pool_read_requests",
"format": "time_series",
"intervalFactor": 1,
"legendFormat": "{
{instance}}",
"refId": "A"
}
],
"thresholds": [],
"timeRegions": [],
"title": "InnoDB Buffer命中率 ",
"tooltip": {
"shared": true,
"sort": 0,
"value_type": "individual"
},
"type": "graph",
"xaxis": {
"mode": "time",
"show": true,
"values": []
},
"yaxes": [
{
"format": "percentunit",
"label": "",
"logBase": 1,
"max": "1",
"min": "0",
"show": true
},
{
"format": "percentunit",
"logBase": 1,
"show": true
}
],
"yaxis": {
"align": false
}
},
{
"aliasColors": {
"172.27.83.231:9104": "red"
},
"bars": false,
"dashLength": 10,
"dashes": false,
"datasource": {
"uid": "$Prometheus"
},
"description": "table blocking degree,Larger numbers are problematic",
"fill": 1,
"fillGradient": 0,
"gridPos": {
"h": 5,
"w": 12,
"x": 12,
"y": 33
},
"hiddenSeries": false,
"id": 25,
"legend": {
"alignAsTable": true,
"avg": false,
"current": true,
"max": false,
"min": false,
"rightSide": true,
"show": true,
"total": false,
"values": true
},
"lines": true,
"linewidth": 1,
"links": [],
"nullPointMode": "null",
"options": {
"alertThreshold": true
},
"percentage": false,
"pluginVersion": "9.0.5",
"pointradius": 2,
"points": false,
"renderer": "flot",
"seriesOverrides": [],
"spaceLength": 10,
"stack": false,
"steppedLine": false,
"targets": [
{
"datasource": {
"uid": "$Prometheus"
},
"expr": "mysql_global_status_table_locks_waited/mysql_global_status_table_locks_immediate",
"format": "time_series",
"intervalFactor": 1,
"legendFormat": "{
{instance}}",
"refId": "A"
}
],
"thresholds": [],
"timeRegions": [],
"title": "Table blocked state",
"tooltip": {
"shared": true,
"sort": 0,
"value_type": "individual"
},
"type": "graph",
"xaxis": {
"mode": "time",
"show": true,
"values": []
},
"yaxes": [
{
"format": "percentunit",
"label": "",
"logBase": 1,
"max": "1",
"min": "0",
"show": true
},
{
"format": "percentunit",
"logBase": 1,
"show": true
}
],
"yaxis": {
"align": false
}
},
{
"aliasColors": {
"172.27.83.226:9104": "dark-orange",
"172.27.83.231:9104": "dark-yellow"
},
"bars": false,
"dashLength": 10,
"dashes": false,
"datasource": {
"uid": "$Prometheus"
},
"fill": 1,
"fillGradient": 0,
"gridPos": {
"h": 5,
"w": 12,
"x": 0,
"y": 38
},
"hiddenSeries": false,
"id": 12,
"legend": {
"alignAsTable": true,
"avg": false,
"current": true,
"max": true,
"min": false,
"rightSide": true,
"show": true,
"total": false,
"values": true
},
"lines": true,
"linewidth": 1,
"links": [],
"nullPointMode": "null",
"options": {
"alertThreshold": true
},
"percentage": false,
"pluginVersion": "9.0.5",
"pointradius": 2,
"points": false,
"renderer": "flot",
"seriesOverrides": [],
"spaceLength": 10,
"stack": false,
"steppedLine": false,
"targets": [
{
"datasource": {
"uid": "$Prometheus"
},
"expr": "rate(mysql_global_status_slow_queries[2m])",
"format": "time_series",
"intervalFactor": 1,
"legendFormat": "{
{instance}}",
"refId": "A"
}
],
"thresholds": [],
"timeRegions": [],
"title": "Slow_queries的增长率",
"tooltip": {
"shared": true,
"sort": 0,
"value_type": "individual"
},
"transparent": true,
"type": "graph",
"xaxis": {
"mode": "time",
"show": true,
"values": []
},
"yaxes": [
{
"format": "percent",
"logBase": 1,
"min": "0",
"show": true
},
{
"format": "short",
"logBase": 1,
"show": true
}
],
"yaxis": {
"align": false
}
},
{
"aliasColors": {
"172.27.83.231:9104": "rgb(8, 90, 209)"
},
"bars": false,
"dashLength": 10,
"dashes": false,
"datasource": {
"type": "prometheus",
"uid": "$Prometheus"
},
"description": "Disk/Memory",
"fill": 1,
"fillGradient": 0,
"gridPos": {
"h": 5,
"w": 12,
"x": 12,
"y": 38
},
"hiddenSeries": false,
"id": 28,
"legend": {
"alignAsTable": true,
"avg": false,
"current": true,
"max": false,
"min": false,
"rightSide": true,
"show": true,
"total": false,
"values": true
},
"lines": true,
"linewidth": 1,
"links": [],
"nullPointMode": "null",
"options": {
"alertThreshold": true
},
"percentage": false,
"pluginVersion": "9.0.5",
"pointradius": 2,
"points": false,
"renderer": "flot",
"seriesOverrides": [],
"spaceLength": 10,
"stack": false,
"steppedLine": false,
"targets": [
{
"datasource": {
"uid": "$Prometheus"
},
"expr": "mysql_global_status_created_tmp_disk_tables/mysql_global_status_created_tmp_tables",
"format": "time_series",
"intervalFactor": 1,
"legendFormat": "{
{instance}}",
"refId": "A"
}
],
"thresholds": [],
"timeRegions": [],
"title": "Tmp Table Ratio ",
"tooltip": {
"shared": true,
"sort": 0,
"value_type": "individual"
},
"type": "graph",
"xaxis": {
"mode": "time",
"show": true,
"values": []
},
"yaxes": [
{
"format": "percentunit",
"label": "",
"logBase": 1,
"max": "1",
"min": "0",
"show": true
},
{
"format": "percentunit",
"logBase": 1,
"show": true
}
],
"yaxis": {
"align": false
}
},
{
"aliasColors": {
"172.27.83.231:9104": "rgb(8, 90, 209)"
},
"bars": false,
"dashLength": 10,
"dashes": false,
"datasource": {
"type": "prometheus",
"uid": "$Prometheus"
},
"fill": 1,
"fillGradient": 0,
"gridPos": {
"h": 5,
"w": 12,
"x": 0,
"y": 43
},
"hiddenSeries": false,
"id": 24,
"legend": {
"alignAsTable": true,
"avg": false,
"current": true,
"max": false,
"min": false,
"rightSide": true,
"show": true,
"total": false,
"values": true
},
"lines": true,
"linewidth": 1,
"links": [],
"nullPointMode": "null",
"options": {
"alertThreshold": true
},
"percentage": false,
"pluginVersion": "9.0.5",
"pointradius": 2,
"points": false,
"renderer": "flot",
"seriesOverrides": [],
"spaceLength": 10,
"stack": false,
"steppedLine": false,
"targets": [
{
"datasource": {
"uid": "$Prometheus"
},
"expr": "1- mysql_global_status_threads_created/mysql_global_status_connections",
"format": "time_series",
"intervalFactor": 1,
"legendFormat": "{
{instance}}",
"refId": "A"
}
],
"thresholds": [],
"timeRegions": [],
"title": "Thread Cache 命中率 ",
"tooltip": {
"shared": true,
"sort": 0,
"value_type": "individual"
},
"type": "graph",
"xaxis": {
"mode": "time",
"show": true,
"values": []
},
"yaxes": [
{
"format": "percentunit",
"label": "",
"logBase": 1,
"max": "1",
"min": "0",
"show": true
},
{
"format": "percentunit",
"logBase": 1,
"show": true
}
],
"yaxis": {
"align": false
}
},
{
"aliasColors": {
"172.27.83.231:9104": "rgb(8, 90, 209)"
},
"bars": false,
"dashLength": 10,
"dashes": false,
"datasource": {
"type": "prometheus",
"uid": "$Prometheus"
},
"description": "不为0 ,可能需要调大 binlog_cache_size大小 ",
"fill": 1,
"fillGradient": 0,
"gridPos": {
"h": 5,
"w": 12,
"x": 12,
"y": 43
},
"hiddenSeries": false,
"id": 29,
"legend": {
"alignAsTable": true,
"avg": false,
"current": true,
"max": false,
"min": false,
"rightSide": true,
"show": true,
"total": false,
"values": true
},
"lines": true,
"linewidth": 1,
"links": [],
"nullPointMode": "null",
"options": {
"alertThreshold": true
},
"percentage": false,
"pluginVersion": "9.0.5",
"pointradius": 2,
"points": false,
"renderer": "flot",
"seriesOverrides": [],
"spaceLength": 10,
"stack": false,
"steppedLine": false,
"targets": [
{
"datasource": {
"uid": "$Prometheus"
},
"expr": "mysql_global_status_binlog_cache_disk_use",
"format": "time_series",
"intervalFactor": 1,
"legendFormat": "{
{instance}}",
"refId": "A"
}
],
"thresholds": [],
"timeRegions": [],
"title": "Binlog Cache 使用状况",
"tooltip": {
"shared": true,
"sort": 0,
"value_type": "individual"
},
"type": "graph",
"xaxis": {
"mode": "time",
"show": true,
"values": []
},
"yaxes": [
{
"format": "short",
"label": "",
"logBase": 1,
"max": "1",
"min": "0",
"show": true
},
{
"format": "short",
"logBase": 1,
"show": true
}
],
"yaxis": {
"align": false
}
}
],
"refresh": "5s",
"schemaVersion": 36,
"style": "dark",
"tags": [
"数据库",
"应用服务"
],
"templating": {
"list": [
{
"current": {
"selected": false,
"text": "Prometheus",
"value": "Prometheus"
},
"hide": 0,
"includeAll": false,
"multi": false,
"name": "Prometheus",
"options": [],
"query": "prometheus",
"queryValue": "",
"refresh": 1,
"regex": "",
"skipUrlSync": false,
"type": "datasource"
}
]
},
"time": {
"from": "now-5m",
"to": "now"
},
"timepicker": {
"refresh_intervals": [
"5s",
"10s",
"30s",
"1m",
"5m",
"15m",
"30m",
"1h",
"2h",
"1d"
],
"time_options": [
"5m",
"15m",
"1h",
"6h",
"12h",
"24h",
"2d",
"7d",
"30d"
]
},
"timezone": "",
"title": "MYSQL监控指标-基于11329改造",
"uid": "DAgEW-JZk",
"version": 32,
"weekStart": ""
}
边栏推荐
猜你喜欢
![52. [Bool type input any non-0 value is not 1 version reason]](/img/73/c4e0048c504e0df073a6d07cfec3ab.png)


随机推荐
I.MX6U-ALPHA开发板(定时器按键消抖)
Visual Analysis of DeadLock
mysql如何从某一行检索到最后
MySQL常见索引类型
redis高阶使用之Redisson分布式锁源码解析
nodejs 简介
IO process thread -> process -> day4
小说里的编程 【连载之二十五】元宇宙里月亮弯弯
数据表格化打印输出
传递泛型给JSX元素
【Unity3D】初学加密技巧(反破解)
如何将项目部署到服务器上(全套教程)
小说里的编程 【连载之二十二】元宇宙里月亮弯弯
Thesis understanding: "Cross-Scale Residual Network: A GeneralFramework for Image Super-Resolution, Denoising, and "
高仿【华为消费者业务官网】和精彩动画剖析:练习在低代码平台中嵌入JS代码
The crawler video crawl tools you get
解决IDEA安装安装插件慢问题
Control 'ContentPlaceHolder1_ddlDepartment' of type 'DropDownList' must be placed inside a form tag with runat=server.
Kind of weird!Access the destination URL, the host can container but not
postgres groupby merge strings