当前位置:网站首页>JVM series - stack and heap, method area day1-2
JVM series - stack and heap, method area day1-2
2022-07-04 13:44:00 【Concise programming】
JVM series —— Stack and heap 、 Method area
Stack
Java Virtual Machine Stacks (Java Virtual machine stack )
The memory space required for the thread to run , Multiple threads, multiple stacks
The structure of the stack
The stack contains multiple stack frames [Frame]( Chain call ), Stack frame is the memory needed by each method when it runs
Each method needs to occupy memory when executing ( Parameters 、 local variable 、 The return value needs to allocate memory )
When each method needs to be executed , The stack frame will be pushed into the stack , Until the method is executed , The stack frame will come out
Be careful !: Each thread can only have one active stack frame , Corresponding to the method being executed
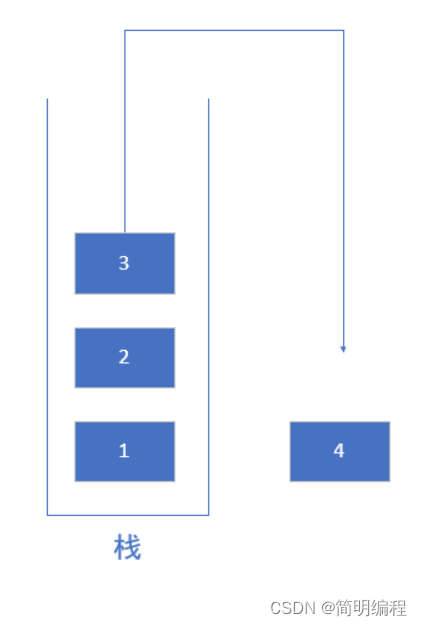
First in, then out
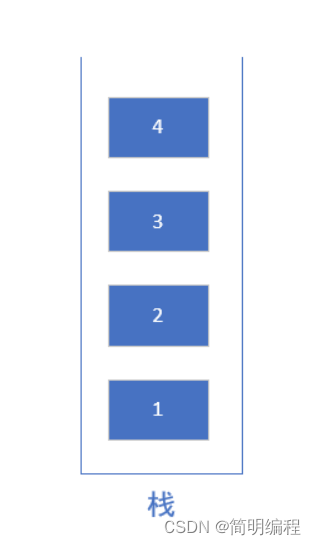
Push
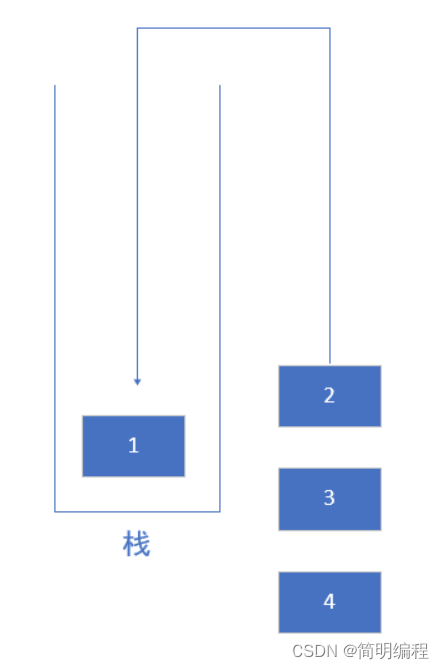
Out of the stack
Stack demonstration
package stack;

public class StackTest {


    public static void do1(int a) {

        do2(a, 2);
    }

    public static int do2(int a, int b) {

        return a * b;
    }

    public static void main(String[] args) {

        do1(2);
    }
}
Enter the code break point into the debug view
How to be in IDEA View specific debugging information in

Stack structure view
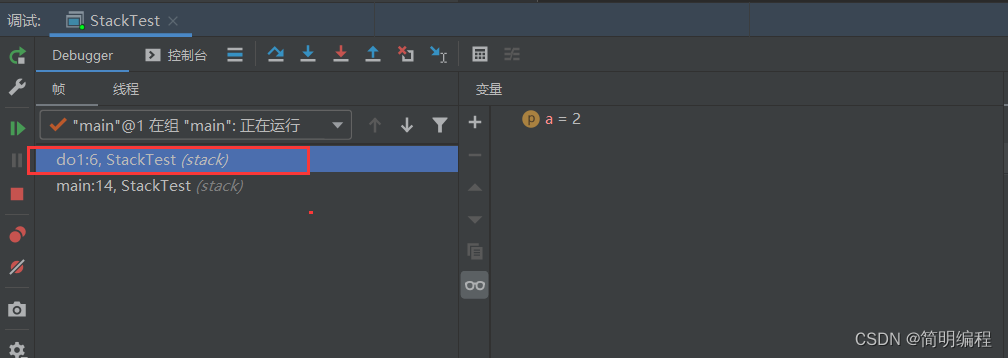
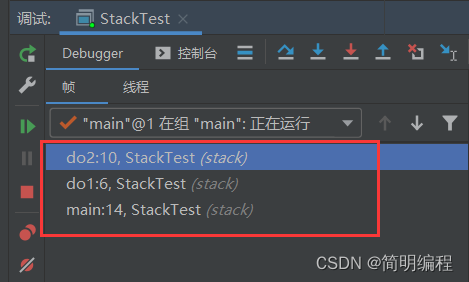
Here we see that the whole stack structure is :main The method is at the bottom , And then there was do1, And finally do2, Next, execute the stack 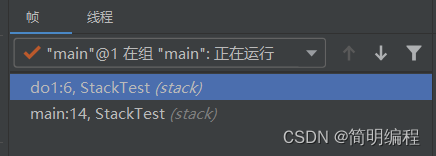
notice do2 The method disappeared first , Explain the last execution do2 Methods are first pushed out of the stack , If you look at the next variable window , You can see the memory usage of variables
We can also see in the method : There is a number after the number
This is the code line of the corresponding program ( Program counter function !!!), According to this address information, the execution order can be locked
The characteristics of the stack
- The stack does not require a garbage collection mechanism !
- The memory of the stack is not as large as possible ! By default, the default size of the stack is 1024KB(windows The system depends on the size of the virtual space ), The larger the memory of the stack, the less the number of threads , Instead, the operation efficiency becomes lower
- If the local variables in the method are not out of the scope of the method, then thread safety , Otherwise, the thread is not safe
Stack overflow problem (StackOverflowError)
Also known as stack memory overflow
The cause of the spill
1. Too many stack frames lead to , When a method makes a recursive call , Failure to set the correct termination condition leads to overflow ), It may also be caused by the cyclic dependency of the program
2. Memory overflow caused by too large stack frame , We can imagine this scenario , When making recursive calls , Our method uses variable length parameters , As a result, there are so many parameter variables that the stack frame exceeds the stack memory , But in fact, it's almost impossible to see
IDEA Customize stack memory size
Select edit configuration 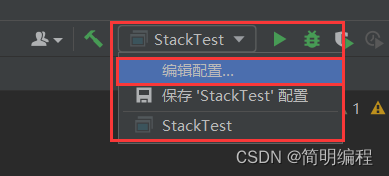
Select Modify options –> add to VM Options 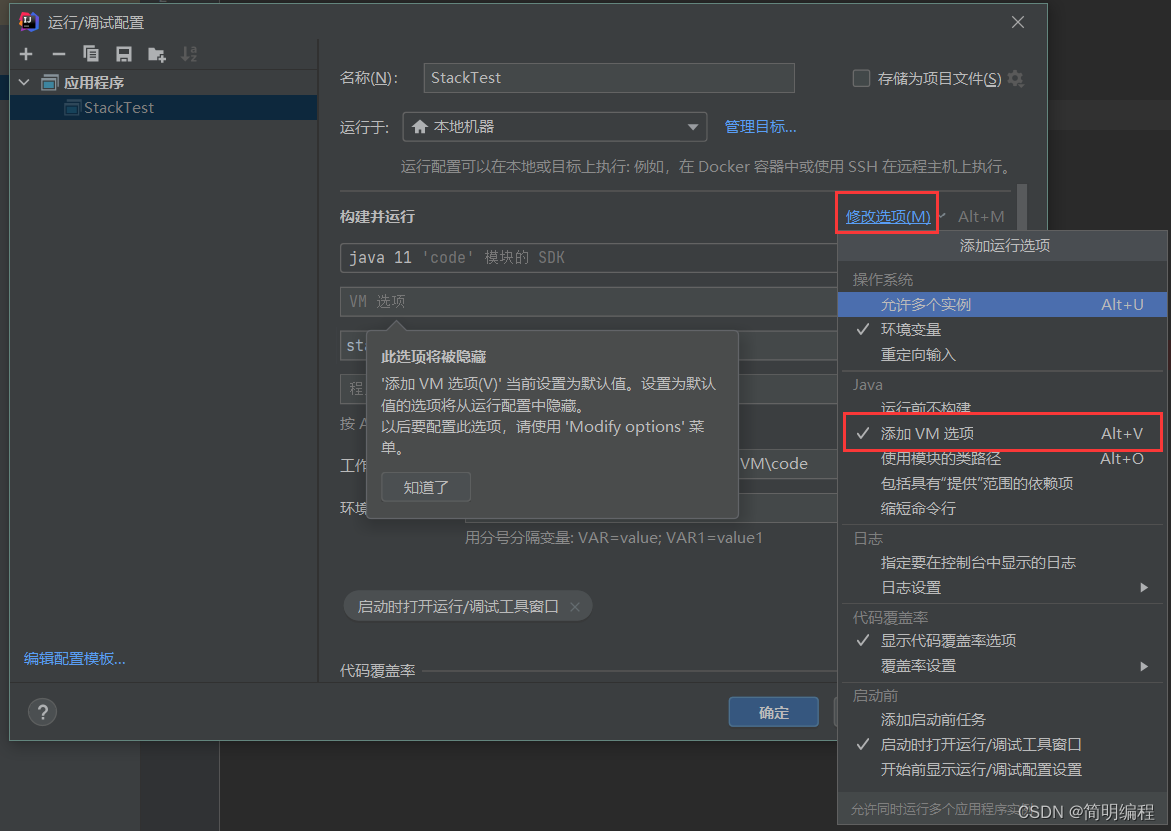
Input -Xss128k It can be changed to 128k The size of 
Thread running diagnostics (linux)
stay linux In the environment , We can use ps View Thread occupancy ,top You can view the process occupancy
ps H -eo pid,tid,%cpu | grep process id
By using jstack Command to diagnose the process , List threads , We will thread id Convert to 16 You can know the problem caused by a specific thread by locking it (nid)
jstack process id
It is recommended to use jconsole or jvisualvm
Native Method Stack
Native Method Stacks
When the local method interface is called , The local method stack provides memory space for it
Pile up
Heap
We use new The object created by keyword will use heap memory
Characteristics of reactor
- Thread sharing , Thread safety needs to be considered
- There is a garbage sharing mechanism in the heap
Heap overflow problem (OutOfMemoryError)
When our program constantly generates new variables , But these variables will be generated when they are used all the time , Because the garbage collection mechanism does not take effect at this time ,
IDEA Custom heap size
The same way as stack , As long as it is set to :-Xmx Heap size that will do
Heap memory diagnostics
1. jps
It is used to view what are in the current system Java process
jps
2. jmap
Used to view the occupancy of the heap ( Some time )
jmap -heap Process number
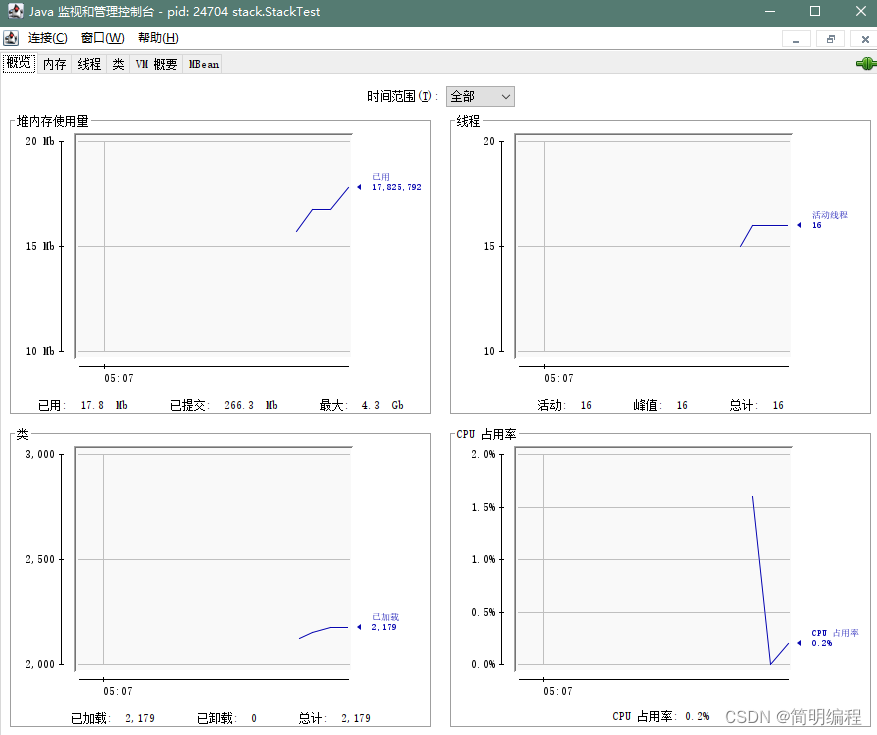
3. jconsole
For continuous monitoring , contain GUI, It is a multifunctional monitoring tool !
jconsole
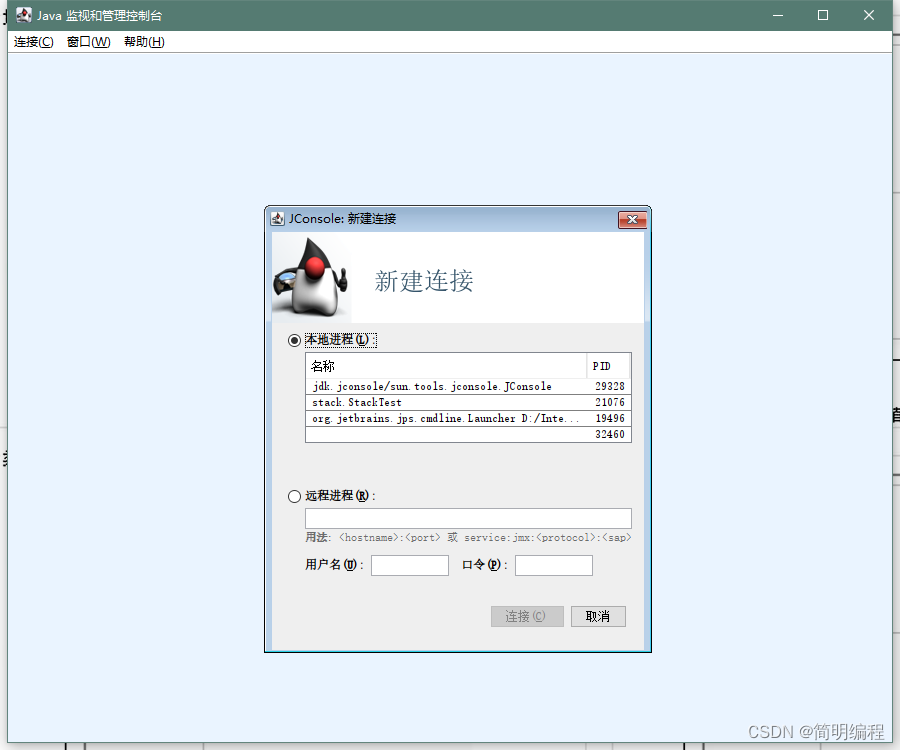
Select the process you want to monitor 
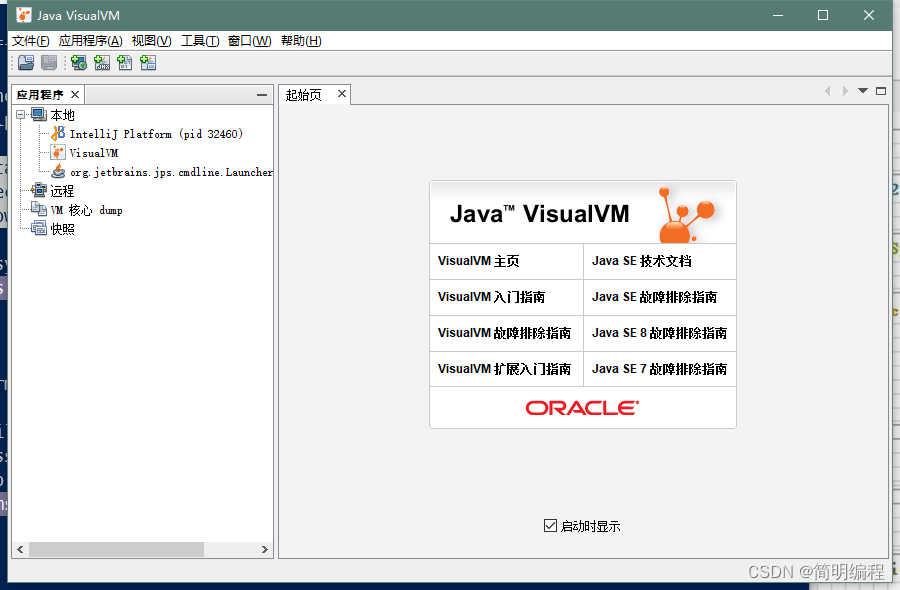
4.jvisualvm
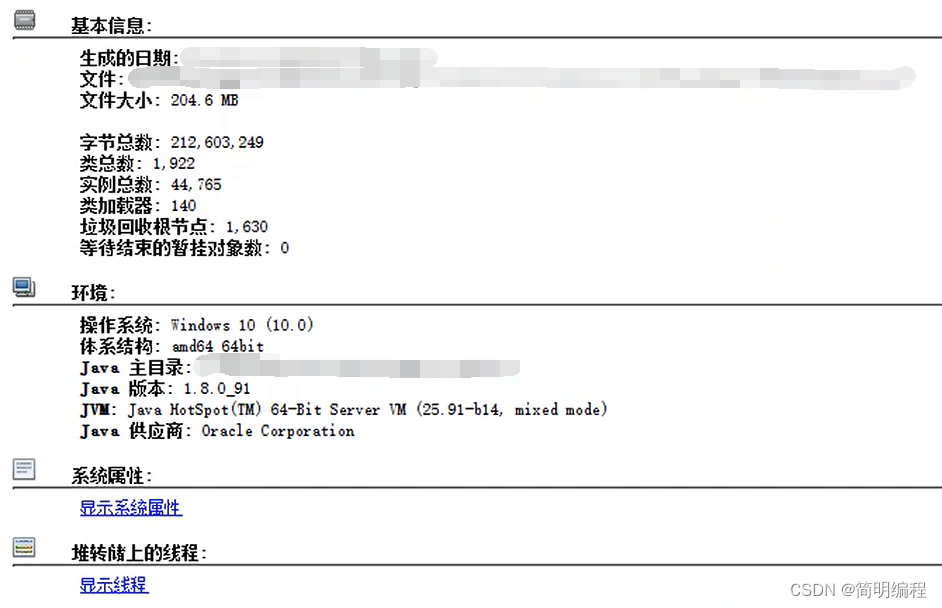
Heap dump dump: Monitor the complete heap details 
Select search in the check to view class information
Method area (jdk1.8 Move back to local memory )
Logically part of the heap , Do not force position , It's a norm
The memory structure of the method area. The information saved by the method area includes :
- Type information : It includes JVM Load type ( class class、 Interface interface、 enumeration enum、 annotation annotation) Full valid name of ( Package name + Class name )、 The full and valid name of its immediate parent 、 Type modifier 、 List of interfaces directly inherited .
- Domain ( Member variables ) Information : Information about all member variables of type and the declaration order of member variables .
- Methods information : Include the name of the member method of the type 、 Return type 、 parameter list 、 Modifier 、 Bytecode 、 The stack of operands 、 Local variable table 、 Exception table, etc .
- Static variables :non-final Static class variables and global constants . The difference is that global constants are assigned values by the compiler , Static class variables are assigned initial values in the preparation stage of loading , In the initialization phase, specify the value .
- JIT Code cache : Code cache generated by instant compilation , Compile the hotspot code into machine code related to the local platform , And save it to memory .
- Runtime constant pool : Various literal quantities and pair types 、 Symbolic references to fields and methods .
Similarly, there will be memory overflow in the method area , And throw it like a heap OutOfMemoryError It's abnormal ( Proved the logical definition )
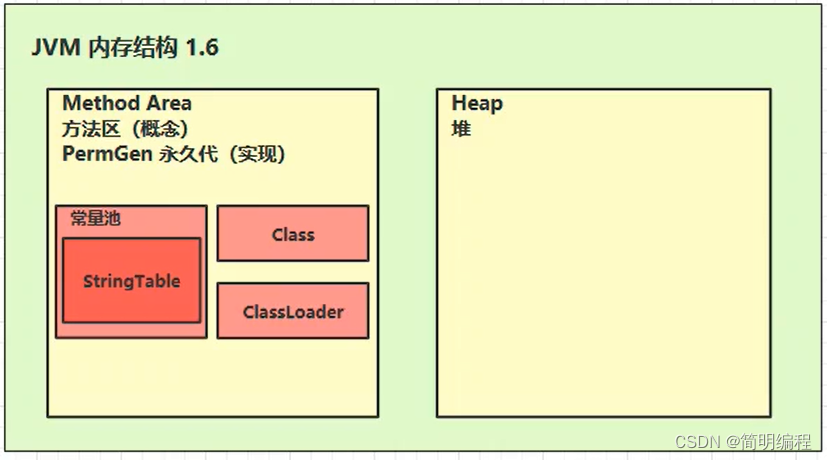
because StringTable It will be widely used in the program , If placed in the method area ,StringTable Low recycling efficiency will lead to insufficient memory in the permanent generation , So from 1.7 rise StringTable Move into the pile
Constant pool
A table used to view binary bytecode after compilation
The virtual machine instruction finds the class name to execute according to this constant table 、 Method name 、 Parameter type 、 Literal quantity and other information
Runtime constant pool
The constant pool is *.class In the document , When the class is loaded , Its constant pool information will be put into the runtime constant pool , And change the symbolic address into the real address
StringTable
yes hashtable Structure , It can't be expanded
When our program runs , The information in the constant pool will enter the runtime constant pool , The symbol in the constant pool does not change to Java String object , Until the program executes the corresponding statement, it will enter StringTable in
characteristic
- Strings in the constant pool are just symbols , When it is used for the first time, it becomes an object using the mechanism of string pool , To avoid creating string objects repeatedly
- The principle of string variable splicing is StringBuilder (jdk1.8)
- The principle of string constant splicing is compile time optimization
- have access to intern Method , Take the initiative to put string objects that are not in the string pool into the string pool , If there is one, it will not put , If not, put it into the string pool , Will return the objects in the string pool (jdk1.8)
When string variables are spliced
use new StringBuilder.append("str1").append("str2")....toString() Equivalent to direct new String("str")
(str = str1+str2…)
( reason : Results can only be determined during operation )
When string constants are spliced
Directly merge the results , And add StringTable in ( reason : The results are directly determined during compilation )
StringTable The garbage collection of
Set up VM Options : -Xmx8m -XX:+PrintStringTableStatistics -XX:+PrintGCDetails -verbose:gc
-Xmx8m : Set heap to 8mb
-XX:+PrintStringTableStatistics: Set up printing StringTable Statistics
-Xlog:gc* : Set print garbage collection details
// Set up VM Options : -Xmx8m -XX:+PrintStringTableStatistics -Xlog:gc* -verbose:gc
//-Xmx8m :  Set heap to 8mb
//-XX:+PrintStringTableStatistics: Set up printing StringTable Statistics
//-Xlog:gc* : Set print garbage collection details
public class StringTableGC {

    public static void main(String[] args) {

        int i = 0;
        for (int j = 0; j < 100000; j++) {

            // Join in StringTable in
            String.valueOf(j).intern();
            i++;
        }
        System.out.println(i);
    }
}
loop 100 Time 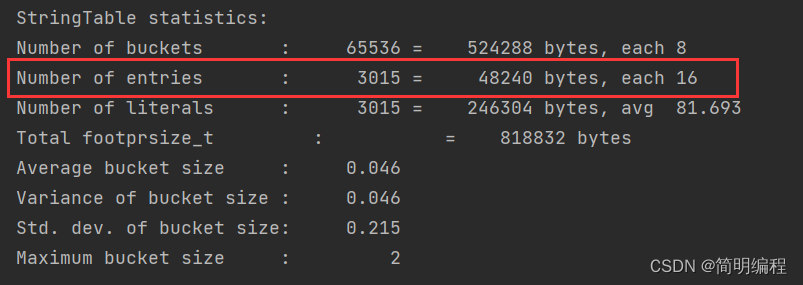
loop 10w Time
You can see here that a lot of garbage collection is triggered
After reading, I found that there are 4 Time 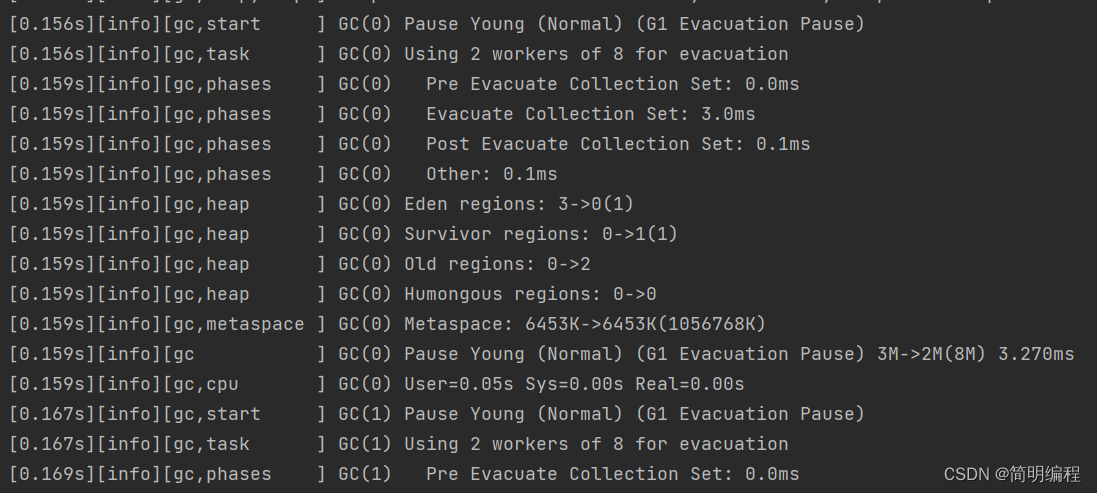
StringTable performance tuning
- Mainly adjustment hashTable Number of barrels in ( At least 1009 individual )
-Xms500m -Xmx500m -XX:+PrintStringTableStatistics -XX:StringTableSize=1010
- Adopt string pooling operation to greatly reduce repeated strings
String.intern()
边栏推荐
- After the game starts, you will be prompted to install HMS core. Click Cancel, and you will not be prompted to install HMS core again (initialization failure returns 907135003)
- Apache server access log access Log settings
- 比量子化学方法快六个数量级,一种基于绝热状态的绝热人工神经网络方法,可加速对偶氮苯衍生物及此类分子的模拟
- SQL language
- Building intelligent gray-scale data system from 0 to 1: Taking vivo game center as an example
- Introduction to XML I
- Web知识补充
- MySQL three-level distribution agent relationship storage
- Comprehensive evaluation of modular note taking software: craft, notation, flowus
- C basic supplement
猜你喜欢

2022KDD预讲 | 11位一作学者带你提前解锁优秀论文

It is six orders of magnitude faster than the quantum chemical method. An adiabatic artificial neural network method based on adiabatic state can accelerate the simulation of dual nitrogen benzene der

Practice: fabric user certificate revocation operation process

Database lock table? Don't panic, this article teaches you how to solve it

比量子化学方法快六个数量级,一种基于绝热状态的绝热人工神经网络方法,可加速对偶氮苯衍生物及此类分子的模拟

Xue Jing, director of insight technology solutions: Federal learning helps secure the flow of data elements
![[AI system frontier dynamics, issue 40] Hinton: my deep learning career and research mind method; Google refutes rumors and gives up tensorflow; The apotheosis framework is officially open source](/img/2c/b1d6277c1b23a6a77f90d5b2874759.png)
[AI system frontier dynamics, issue 40] Hinton: my deep learning career and research mind method; Google refutes rumors and gives up tensorflow; The apotheosis framework is officially open source
提高MySQL深分页查询效率的三种方案
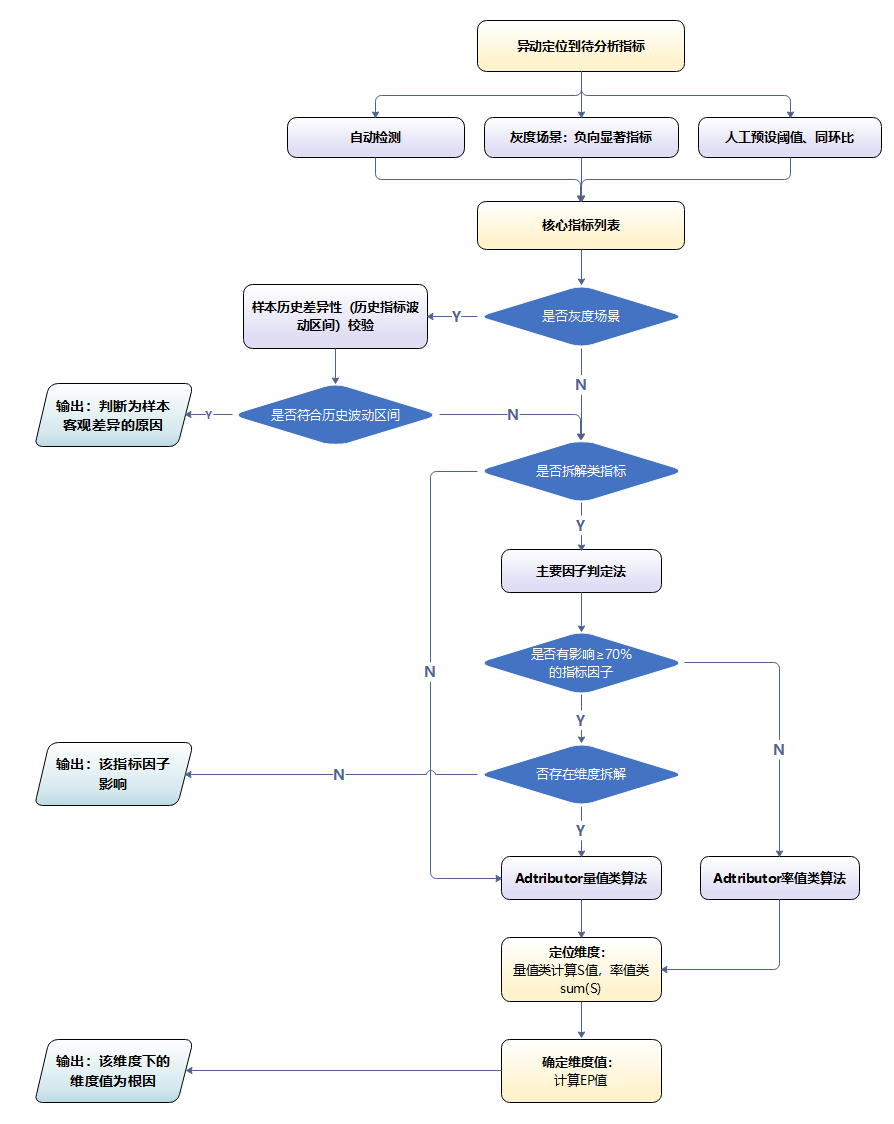
Building intelligent gray-scale data system from 0 to 1: Taking vivo game center as an example

Samsung's mass production of 3nm products has attracted the attention of Taiwan media: whether it can improve the input-output rate in the short term is the key to compete with TSMC
随机推荐
Practice: fabric user certificate revocation operation process
eclipse链接数据库中测试SQL语句删除出现SQL语句语法错误
Etcd storage, watch and expiration mechanism
三星量产3纳米产品引台媒关注:能否短期提高投入产出率是与台积电竞争关键
用fail2ban阻止密码尝试攻
C语言职工管理系统
Efficient! Build FTP working environment with virtual users
Introduction to XML I
Rsyslog配置及使用教程
Excuse me, have you encountered this situation? CDC 1.4 cannot use timestamp when connecting to MySQL 5.7
使用Scrcpy投屏
Backgroundworker usage example
c#数组补充
C#基础补充
Dgraph: large scale dynamic graph dataset
C语言程序设计选题参考
Zhongang Mining: in order to ensure sufficient supply of fluorite, it is imperative to open source and save flow
WPF double slider control and forced capture of mouse event focus
The old-fashioned synchronized lock optimization will make it clear to you at once!
C language dormitory management query software


