当前位置:网站首页>Jstat of JVM command: View JVM statistics
Jstat of JVM command: View JVM statistics
2022-07-07 06:00:00 【Zhang Junjie 1994】
Study Silicon Valley Song Hongkang JVM From entry to mastery Learning notes of
summary
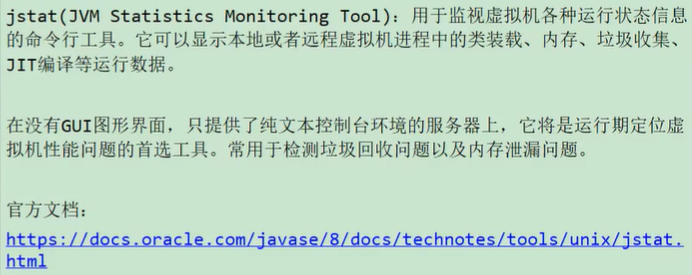
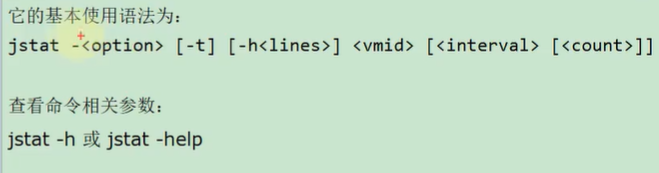
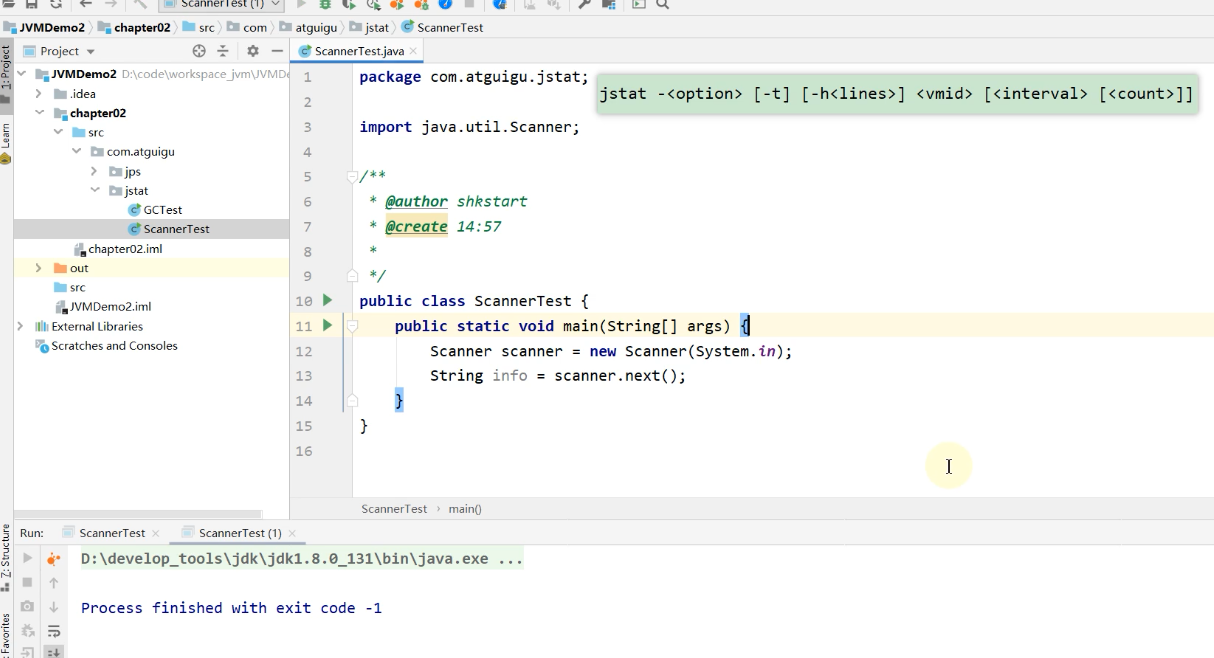
Basic grammar
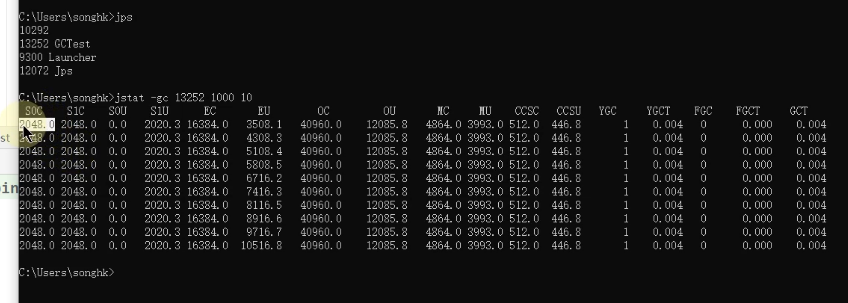
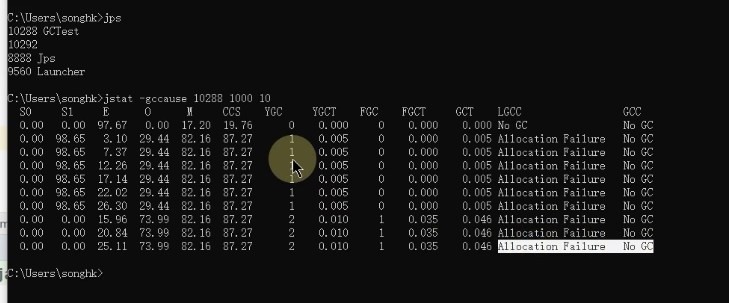
among vmid Is a process id Number , That is to say jps And then you see the number in front of you , as follows :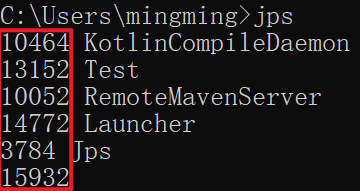
option Parameters
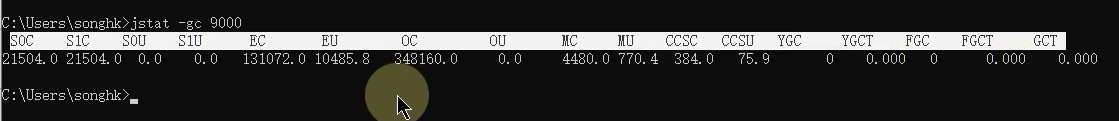
-gc
Cenozoic related
S0C It's the size of the first survivor zone ( byte )
S1C It's the size of the second survivor zone ( byte )
S0U It's the size of the first survivor zone used ( byte )
S1U Is the size of the second survivor zone that has been used ( byte )
EC yes Eden The size of the space ( byte )
EU yes Eden Space used size ( byte )
Older generation related
OC It's the size of the old days ( byte )
OU It's the size used in the old days ( byte )
Method area ( Meta space ) relevant
MC It's the size of the method area
MU Is the used size of the method area
CCSC Is the size of the compressed class space
CCSU Is the used size of the compressed class space
other
YGC From application startup to sampling young gc The number of times
YGCT It's from the start of the application to the time of sampling young gc Elapsed time ( second )
FGC From application startup to sampling full gc The number of times
FGCT From application startup to sampling full gc Time consuming ( second )
GCT From application startup to sampling gc The total time of
interval Parameters
Used to specify the period of output statistics , The unit is millisecond . namely : Query interval
count Parameters
Used to specify the total number of queries
-t Parameters
You can add a... Before the output Timestamp Column , Display the running time of the program . Company : second
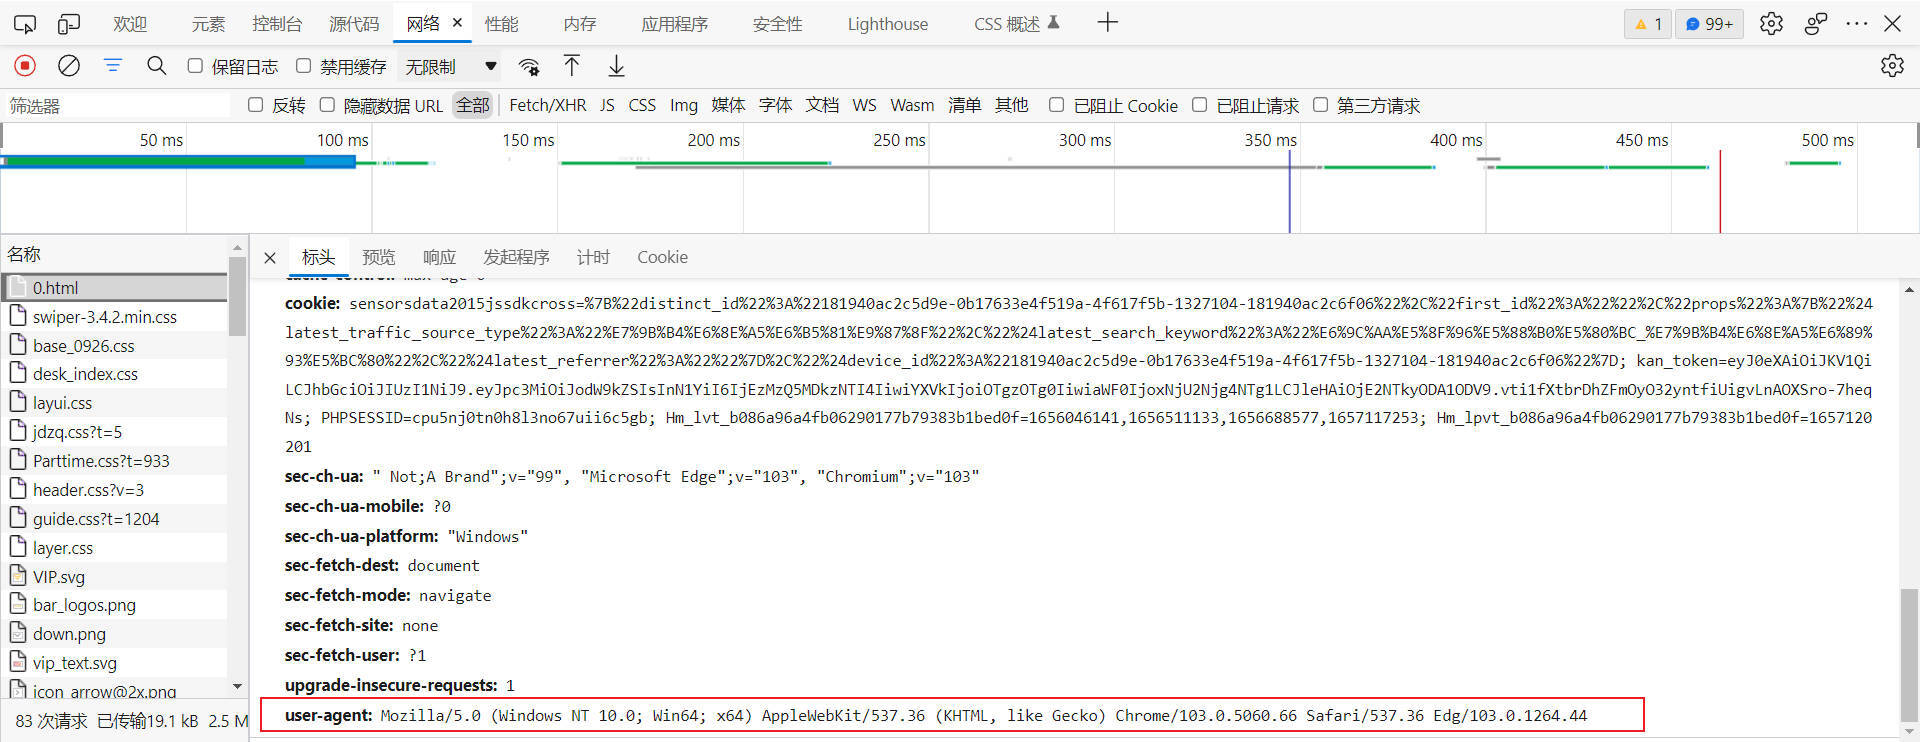
We execute jstat -gc -t 13152 1000 10, This represents 1 Seconds to print out 1 That's ok , altogether 10 That's ok ,-t The representative prints out Timestamp Total operation time , The results are shown below :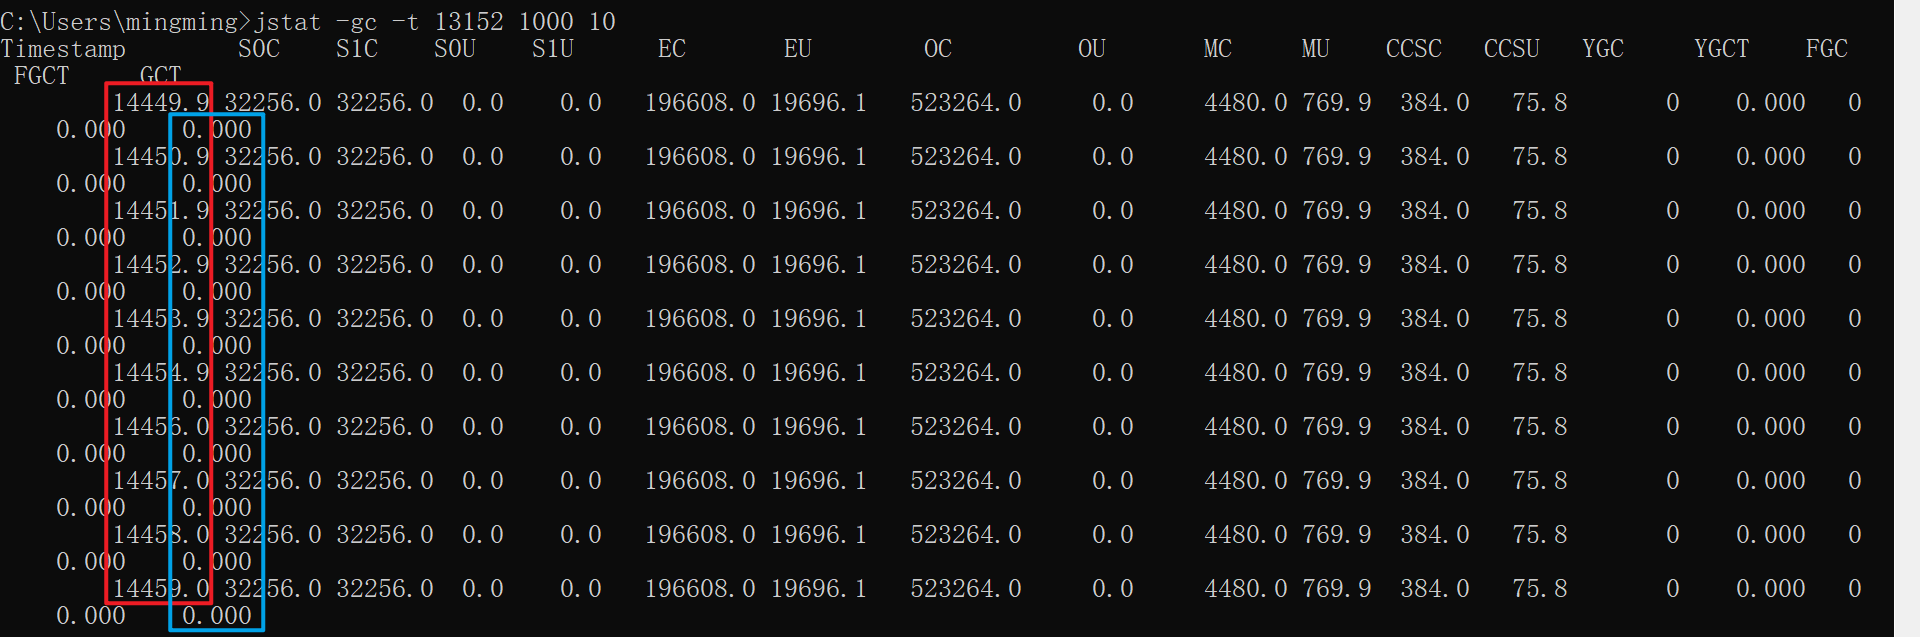
The red box above represents Timestamp, The blue box represents the garbage collection time , The units are seconds , If you subtract two values in the red box , Suppose this value is num1, Then subtract the other two values in the blue box of the corresponding row , Suppose this value is num2, Then let num2/num1, The difference obtained is the above GC Time as a percentage of running time
Although this method is cumbersome , But after the project is deployed, you need to use the command line to see , There is no visual interface , So this way should also
-h Parameters
When periodic data is output , How many lines of data to output and then output a header information
demonstration
Start the above program
Enter the following command 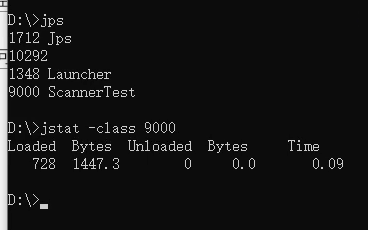
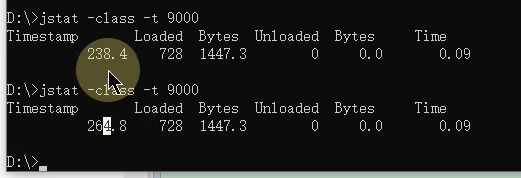
Loaded Is the number of loaded classes
first Bytes Is the number of bytes occupied by the loaded class
Unloaded Is the number of unloaded classes
the second Bytes Is the number of bytes occupied by the unloaded class
Time Is the time spent loading classes
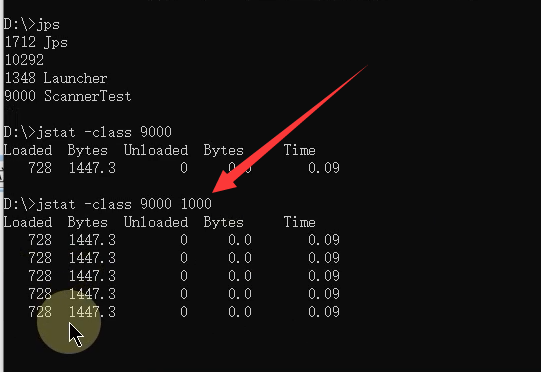
The parameters of the arrow are interval Parameters ,
The arrow means 1 Print every second , For our continuous monitoring . Will always print , It won't print until the program is over .
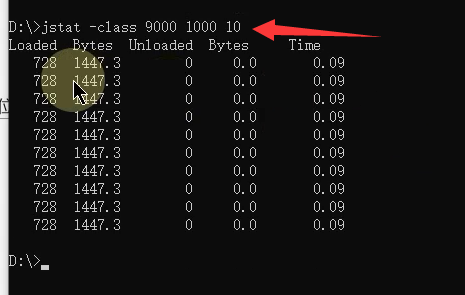
The parameter of the arrow is the number of times to print ,10 It means that a total of 10 Time , achieve 10 Printing will stop after times .
-t Output means output How long has it taken since the program was running until now when you hit the command , The unit is seconds
Timestamp This is the time
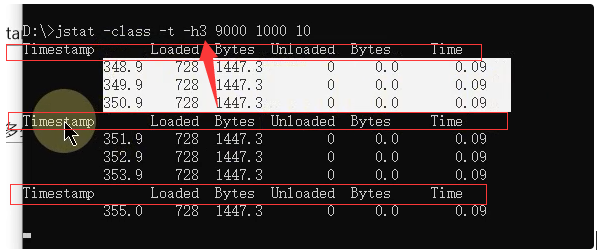
-h3 It means that the table header is output every three records
compiler Is to display the compiled method , Time consuming compiled methods , Methods of compilation failure, etc 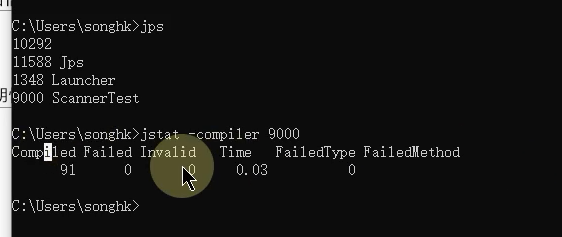
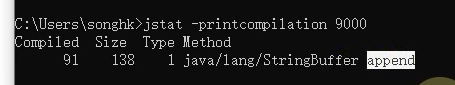
Print the compiled method
s0c Survivor 0 Area capacity
s1c Survivor 1 Area capacity
sou Survivor 0 The capacity that the zone has used
s1u Survivor 1 The capacity that the zone has used
ec The total capacity of Eden Park
eu Capacity used in Eden Park
oc It's the total amount of the old age
ou It is the capacity used in the old age
mc Is the capacity of the method area
mu Is the capacity used by the method area
ccsc Is the total number of compressed classes
ccsu Is the usage capacity of the compressed class
ygc yes young gc Parameters that occur
tgct yes young gc Time spent
fgc yes full gc Parameters of
fgct yes full gc Time spent
gct It's total gc Time for , total gc Time spent =young gc Time spent +full gc Time spent
jstat: How to check OOM And memory leaks
At ordinary times, you can use some graphical interface tools to view , But in the actual production environment , You may not be able to use these graphical interface tools , It can only be used jdk Self contained jstat The tool checks and monitors .
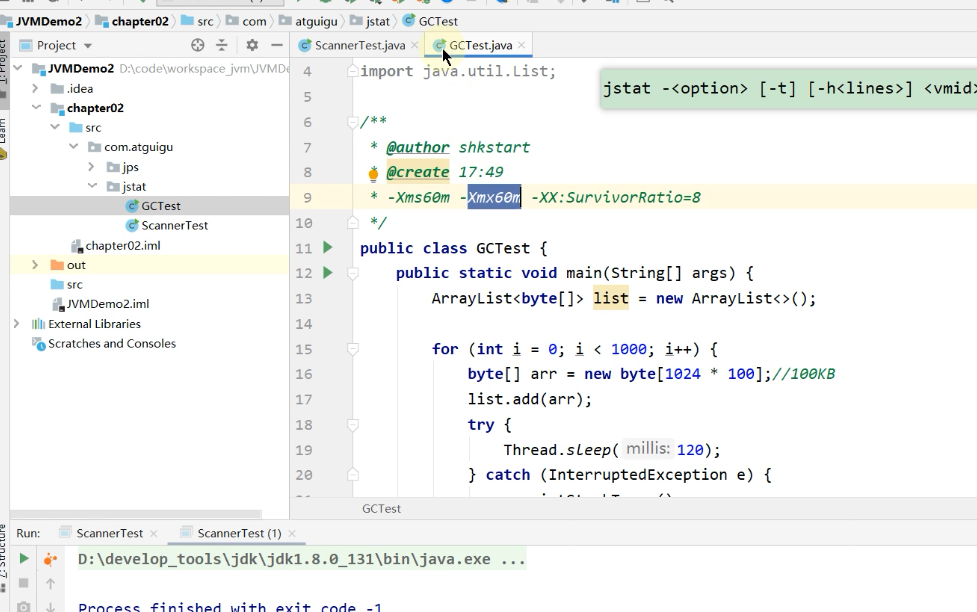
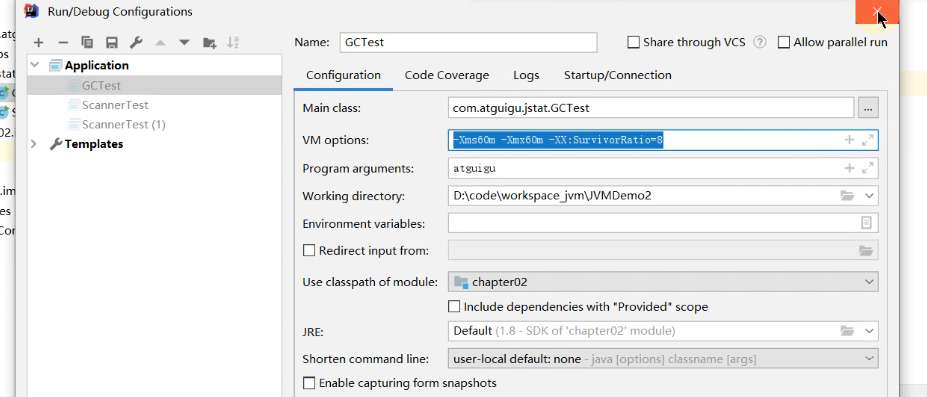
Start this main Method
Be careful , When executing the above command, it does not throw oom abnormal , And then back Java The program console throws this exception .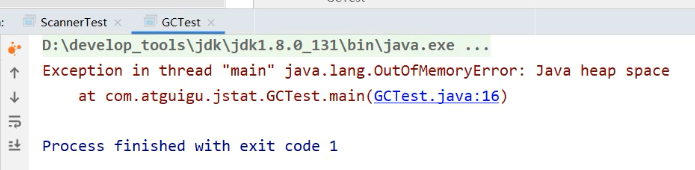

appear gc Why
oom Troubleshooting experience :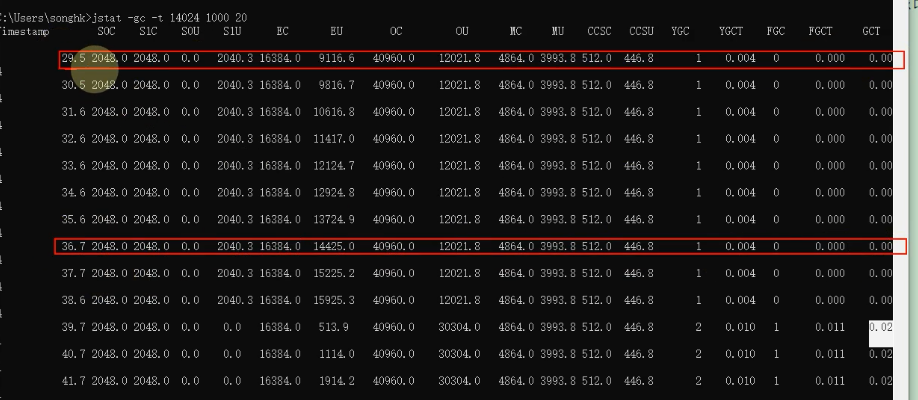
Experience :
We can compare Java The start time of the process and the total gc Time for (gct Column ), Or the interval between two measurements and the total gc The increment of time ( perform gc How long did it take ), Come out of gc The proportion of execution time in program running time .
The data between the above two red boxes gct The sum of time Divide The data between the above two red boxes Timestamp The sum of time , To get the ratio of garbage collection time to the total time of program execution
If this ratio exceeds 20%, It means that the current reactor pressure is high , Because garbage collection takes a little more time , If this ratio exceeds 90% 了 , That means that the execution time of the program is percent 90 All the time is spent on garbage collection , It shows that there is basically no memory space , Then it may appear at any time oom Abnormal .
use jstat Identify memory leaks
Add 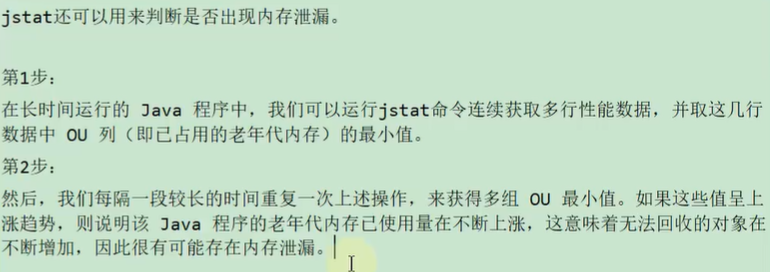
The first 1 Step can execute commands :jstat -gc -t 13152 1000 20
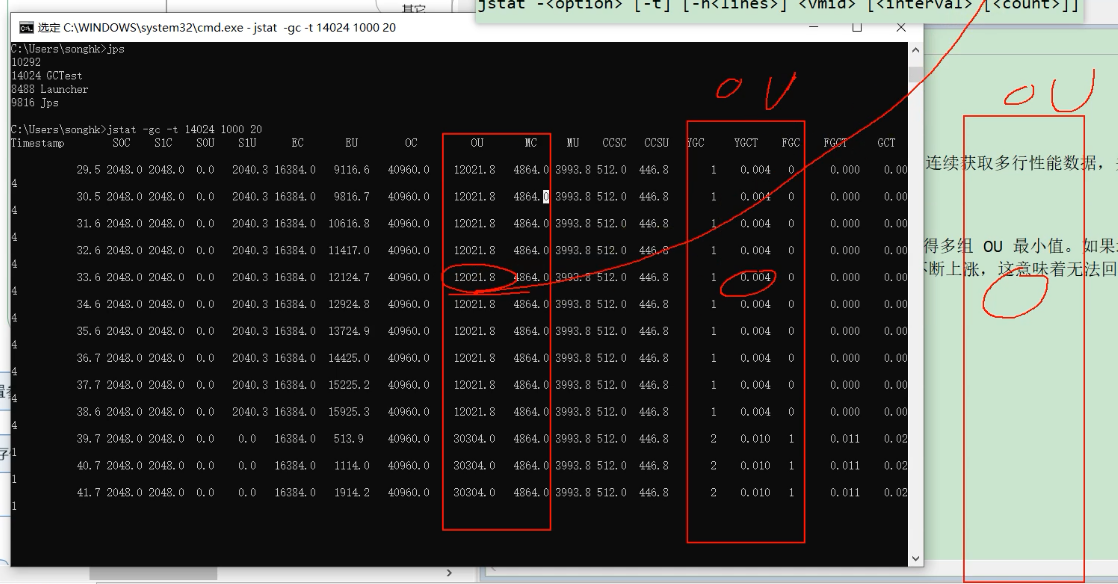
Observe every once in a while ou Parameters , If ou Parameters ( Memory usage in old times ) The occupation of is getting higher and higher , This situation is that objects that cannot be recycled in the old age are growing , You have to think about it , Why? gc These objects are not cleaned up , It is estimated that there may be a memory leak .
jstatd: Remote host information collection
Because the data we want to monitor is not necessarily local , A lot of data to be monitored is online linux Upper , You need to use jstatd This tool is used for remote monitoring .
command jstatd It's a rmi Server program , The function is equivalent to proxy server , Establish communication between local computer and remote monitoring tool ,jstatd The server will send Java Application information is transferred to the remote computer .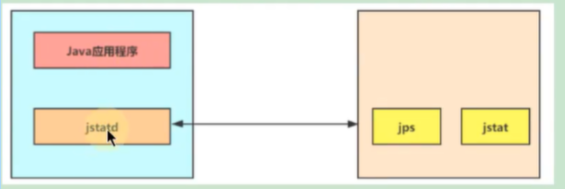
边栏推荐
- 解决pod install报错:ffi is an incompatible architecture
- 话说SQLyog欺骗了我!
- 数据中心为什么需要一套基础设施可视化管理系统
- Check Point:企业部署零信任网络(ZTNA)的核心要素
- 职场经历反馈给初入职场的程序员
- Three level menu data implementation, nested three-level menu data
- Pytorch builds neural network to predict temperature
- Get the way to optimize the one-stop worktable of customer service
- JVM命令之 jinfo:实时查看和修改JVM配置参数
- 目标检测中的损失函数与正负样本分配:RetinaNet与Focal loss
猜你喜欢
Introduction to distributed transactions

Hcip eighth operation

Go语学习笔记 - gorm使用 - gorm处理错误 | Web框架Gin(十)
Why does the data center need a set of infrastructure visual management system

Check Point:企业部署零信任网络(ZTNA)的核心要素

从“跑分神器”到数据平台,鲁大师开启演进之路
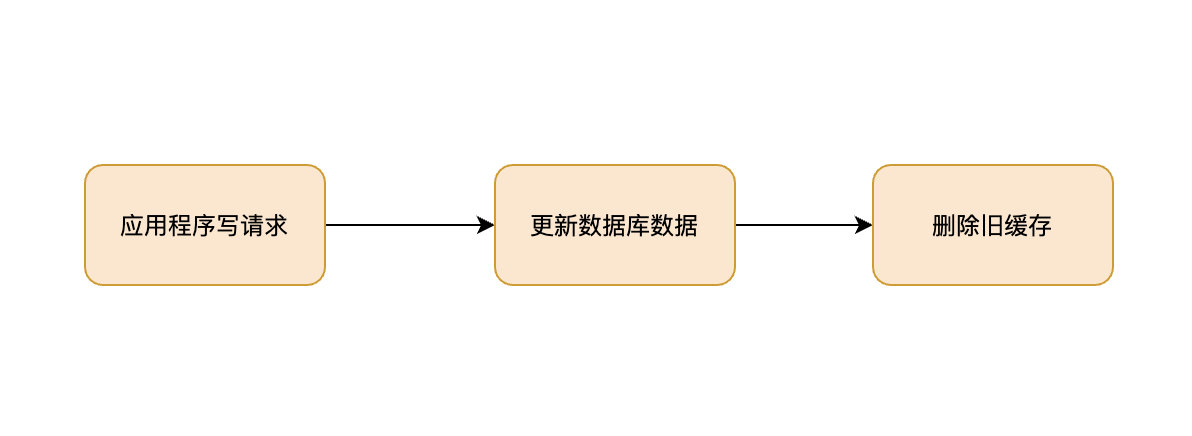
If you don't know these four caching modes, dare you say you understand caching?
Reptile exercises (III)
![[InstallShield] Introduction](/img/df/4522d06510ff918d00659b8358368f.jpg)
[InstallShield] Introduction
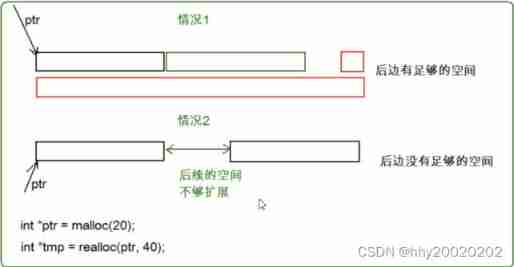
Dynamic memory management
随机推荐
Bbox regression loss function in target detection -l2, smooth L1, IOU, giou, Diou, ciou, focal eiou, alpha IOU, Siou
从“跑分神器”到数据平台,鲁大师开启演进之路
ML之shap:基于adult人口普查收入二分类预测数据集(预测年收入是否超过50k)利用shap决策图结合LightGBM模型实现异常值检测案例之详细攻略
Flask1.1.4 Werkzeug1.0.1 源码分析:启动流程
每秒10W次分词搜索,产品经理又提了一个需求!!!(收藏)
Realize GDB remote debugging function between different network segments
Why does the data center need a set of infrastructure visual management system
Hcip seventh operation
解决pod install报错:ffi is an incompatible architecture
Things about data storage 2
谈fpga和asic的区别
Mac version PHP installed Xdebug environment (M1 version)
What is make makefile cmake qmake and what is the difference?
JVM the truth you need to know
如何提高网站权重
Message queuing: how to ensure that messages are not lost
SQL Server 2008 各种DateTime的取值范围
Forkjoin is the most comprehensive and detailed explanation (from principle design to use diagram)
yarn入门(一篇就够了)
【已解决】记一次EasyExcel的报错【读取xls文件时全表读不报错,指定sheet名读取报错】