当前位置:网站首页>Queuing theory, game theory, analytic hierarchy process
Queuing theory, game theory, analytic hierarchy process
2022-06-13 02:20:00 【Shameful child】
Queuing theory model
queuing theory (Queuing Theory) Also known as stochastic service system theory , It is to solve the problem that the number of services exceeds that of service agencies ( Reception 、 Waiter, etc ) The capacity of . in other words , Arriving customers are not immediately served , As a result, there has been a discipline that has been developing .
- Behavior problems , That is to study the probability regularity of various queuing systems , It mainly studies the distribution of team length 、 Waiting time distribution and busy period distribution , Both transient and steady-state conditions are included .
- Optimization problems , It can be divided into static optimization and dynamic optimization , The former refers to the optimal design . The latter refers to the optimal operation of the existing queuing system .
- Statistical inference of queuing system , That is to judge which model a given queuing system conforms to , So as to conduct analysis and research according to queuing theory .
Basic concepts
The dotted line in the figure contains the queuing system .
Those who require services are collectively referred to as customer , People or things that serve customers are called The waiter , The service system consists of customers and waiters .
The composition and characteristics of queuing system
Input process : It refers to the regularity of customer arrival time
- The composition of customers may be limited , It could be infinite
- The way customers arrive may be a — One of the , It may also be in batches .
- Customer arrival can be independent of each other , That is, the previous arrival has no effect on the future arrival ; Otherwise it is relevant .
- The input process can be smooth , That is, the interval time distribution and mathematical expectation of successive arrival 、 Numerical features such as variance are independent of time , Otherwise it is nonstationary .
Queuing rules : It refers to the rules for customers arriving at the queuing system to wait in line , It can be divided into loss system , Waiting system and mixed system .
- Loss system ( Vanishing system ). When the customer arrives , All service desks are occupied , The customer then left .
- Waiting system . When the customer arrives , All service desks are occupied , Customers are waiting in line , I didn't leave until I received the service .
- Mixed system . Between the loss system and the waiting system is the mixed system , There is both waiting and loss . The queue length is limited and The waiting time in the queue is limited Two cases , Wait in line within the limit , Go beyond a certain limit .
- Queuing methods are also divided into Single column 、 Multi column and circular queues .
Service process
Service agencies . There are mainly the following types : Single service desk ; Multiple service desks are connected in parallel ( Each service desk serves different customers at the same time ); Multiple service desks in series ( Multiple service desks serve the same customer in turn ); mixed type .
Service rules . The following rules shall be adopted in the order of customer service :
- First come, first serve
- Last come first serve
- Random service
- Priority services
Symbolic representation of queuing model
The queuing model is represented by six symbols , Separate the symbols with a slash , namely X /Y / Z / A/ B /C .
- The first symbol X Indicates the distribution of customer arrival flow or customer arrival interval ;
- The second symbol Y Represents the distribution of service time ;
- The third symbol Z Indicates the number of service desks ;
- Fourth symbol A Is the system capacity limit ;
- The fifth symbol B Is the number of customer sources ;
- Sixth symbol C It's a service rule , Such as first come, first served FCFS, Last come first serve LCFS etc. .
The Convention symbol indicating the distribution of customer arrival interval and service time is :
- M — An index distribution ( M yes Markov Prefix of , Because the exponential distribution has no memory , namely Markov sex );
- D — Determinate type (Deterministic);
- E(k) —k Step Erlang (Erlang) Distribution ;
- G — commonly (general) Distribution of service time ;
- GI — Generally independent of each other (General Independent) The distribution of time intervals .
- M / M /1 Indicates that the successive arrival intervals are exponentially distributed 、 The service time is exponentially distributed 、 Single service desk 、 The waiting system .
- D / M / c Indicates a definite time of arrival 、 The service time is exponentially distributed 、 c Parallel service desks ( But customers are a team ) Model of .
Operation index of queuing system
- Average captain : Refers to the number of customers in the system ( Including customers being served and customers waiting in line for service ) Mathematical expectation , Write it down as L**s .
- * Average platoon length : It refers to the mathematical expectation of the number of customers waiting for service in the system , Write it down as *Lq .
- Average length of stay : How long do customers stay in the system ( Including the time of waiting in the queue and the time of receiving services ) Mathematical expectation , Write it down as W**s .
- Average waiting time : It refers to the mathematical expectation of the waiting time of a customer in the queuing system , Write it down as W**q .
- Average busy period : Refers to the continuous busy hours of the service organization ( From the time the customer arrives at the free service agency , The time until the service agency is idle again ) The mathematical expectation of length , Write it down as T**b .
- The enterprise suffers losses due to the rejection of customers Loss rate And often encountered in the future Service intensity etc.
Input the distribution of process and service time
Poisson flow and exponential distribution
Form Poisson flow . These three conditions are :
- In the non overlapping time interval, the number of customer arrivals is independent of each other , We call this property non aftereffect .
- For sufficiently small Δt , In time interval [t,t + Δt) The probability of a customer's arrival is similar to t irrelevant , And about the interval length Δt In direct proportion to , namely P1 (t,t + Δt) = λΔt + o(Δt) , among o(Δt) , When Δt → 0 when , It's about Δt The higher order is infinitesimal .λ > 0 Is constant , It represents the probability of a customer arriving per unit time , It is called probability intensity .
- For sufficiently small Δt , In time interval [t,t + Δt) The probability of two or more customers arriving in the is very small , So that we can ignore
As I learned in probability theory , We say random variables { N(t) = N(s + t) − N(s)} Obey Poisson distribution . Its mathematical expectation and variance are E[N(t)] = λt; Var[N(t)] = λt.
When the input process is Poisson flow , Then the time interval between successive arrival of customers T Must obey exponential distribution .
Commonly used continuous probability distribution
- Uniform distribution
- Section (a,b) Internal Uniform distribution Write it down as U(a,b) .
- obey U(0,1) The random variable of distribution is also called random number , It is the basis for generating other random variables . If so X by U(0,1) Distribution , be Y = a + (b − a)X obey U(a,b) .
- Normal distribution
- With μ For expectations ,σ**2 Is the normal distribution of variance Write it down as N(μ,σ2 ) .
- An index distribution
- An index distribution Is a single parameter λ Asymmetric distribution of , Write it down as Exp(λ)
- Its mathematical expectation is 1/λ, The variance of 1/λ**2
- Exponential distribution is the only continuous random variable with no memory , That is to say P(X > t + s | X > t) = P(X > s) , In queuing theory 、 It is widely used in reliability analysis .
- Gamma Distribution
- Gamma The distribution is two parameter α,β Asymmetric distribution of , Write it down as G(α,β ) , Expectation is αβ .
- α = 1 It degenerates into an exponential distribution . n Independent of each other 、 Homodistribution ( Parameters λ ) The sum of the exponential distributions of is Gamma Distribution (α = n, β = λ) .
- Gamma Distribution is also called Erlang distribution .
- Weibull Distribution
- Weibull The distribution is two parameter α,β Asymmetric distribution of , Write it down as W(α, β ) .
- α = 1 It degenerates into an exponential distribution .
- Beta Distribution
- Beta The distribution is an interval (0,1) Two parameters in 、 Non uniform distribution , Write it down as B(α, β ) .
- Uniform distribution
Commonly used discrete probability distribution
- Discrete uniform distribution
- Bernoulli Distribution ( Two point distribution )
- Bernoulli Distribution is x = 1,0 The probability of taking values at p and 1− p Two point distribution of , Write it down as Bern( p) .
- Poisson (Poisson) Distribution
- Poisson distribution is closely related to exponential distribution .
- When the average arrival rate of customers is constant λ When the arrival interval of follows an exponential distribution , Number of customers arriving per unit time K Obey Poisson distribution
- Write it down as Poisson(λ) .
- The binomial distribution
- The binomial distribution is n Independent Bernoulli Sum of distributions .
- Write it down as B(n, p) .
- When n,k When a large , B(n, p) Approximately normal distribution N(np,np(1− p)) ; When n It's big 、 p Very small , And np About constant λ when , B(n, p) Approximate to Poisson(λ).

Game theory
Game theory is also called competition theory or game theory . Mathematical theories and methods for studying phenomena with the nature of struggle or competition .
It is a new branch of modern mathematics , It is also an important subject in operations research .
The basic elements of countermeasures
- People in the game
- In a game behavior ( Or a game ) in , Countermeasure participants who have the right to decide their own action plan , Called the man in the Bureau .
- It is generally required that there should be at least two players in a game .
- Policy set
- In a game , A practical and complete action plan that can be selected by the players in the bureau is called a strategy .
- commonly , Each player's strategy set should include at least two strategies .
- Win function ( Payment function )
- In a game , The strategy group formed by the strategies selected by the players in each bureau is called a situation
- When the situation arises , The result of the countermeasure is determined . in other words , For any situation , s∈S , People in the game i You can get a win H**i(s) .
- obviously , H**i(s) It's the situation s Function of , It is called the i The winning function of a player in a game .
- People in the game
Zero sum game ( Matrix game )
- In such games , There are only two players , Each player has only a limited number of strategies to choose from .
- In any pure situation , The sum of the wins of the two players is always zero , That is, the interests of both sides are fiercely opposed .
- Zero sum game G The necessary and sufficient condition for a stable solution is μ +ν = 0.
- If exist m Dimensional probability vector x and n Dimensional probability vector y , Make for everything m Dimensional probability vector x and n Dimensional probability vector y Yes

said (x, y) It is the saddle point of the mixed strategy game problem . - There must be saddle points for any mixed strategy game , That is, there must be a probability vector x and y , bring :

Analytic hierarchy process
Analytic hierarchy process (Analytic Hierarchy Process, abbreviation AHP), People are engaged in social 、 In the systematic analysis of problems in the field of economy and scientific management , What we face is often a problem caused by Relate to each other 、 A complex system composed of many factors that restrict each other and often lack quantitative data . Analytic hierarchy process provides a new method for the decision-making and ranking of this kind of problems 、 Simple and practical modeling method .
Use analytic hierarchy process to model , Generally, it can be carried out according to the following four steps :
Establish a hierarchical structure model ;
First of all, we should organize the problems 、 hierarchical , Construct a hierarchical structure model .
Complex problems are decomposed into components of elements .
These elements form several levels according to their attributes and relationships . The elements of the upper level act as a criterion to govern the relevant elements of the lower level .
- At the top : At this level There's only one element , Generally, it is the predetermined goal or ideal result of analyzing the problem , Therefore, it is also called target layer .
- Middle layer : This level contains The intermediate links involved in achieving the objectives , It can consist of several levels , Include criteria to consider 、 Subcriteria , So it's also called Criterion layer .
- At the bottom : This level includes various measures available to achieve the goal 、 Decision making scheme, etc , So it's also called Measure level or scheme level .
> -Construct all judgment matrices in each level ;
- The hierarchy reflects the relationship between factors , But the criteria in the criteria layer The proportion in target measurement is not necessarily the same , In the minds of decision makers , They each occupy a certain proportion .
- The method of pairwise comparison matrix can be established by pairwise comparison of factors .
- Take two factors at a time x i and xj , With a**ij Express x i and xj Yes Z The ratio of the magnitude of the influence , All results are compared with matrix A = (a**ij)(n×n) Express , call A by Z − X The pairwise comparison judgment matrix ( Judgment matrix for short )
- From a psychological point of view , Too many grades will surpass people's judgment , It increases the difficulty of judgment , And it is easy to provide false data . The experimental results also show that , use 1~9 The scale is the most appropriate .
- Last , It should be pointed out that , Do sth. generally n(n −1)/2 Two judgements are necessary . The drawback of this practice lies in , Any error in judgment can lead to unreasonable sequencing , The error of individual judgment is often unavoidable for systems that are difficult to quantify .
Hierarchical single sorting and consistency test ;
- Judgment matrix A Corresponding to the maximum eigenvalue λmax Eigenvector of W , After normalization, it is the ranking weight of the relative importance of the corresponding factors at the same level to a factor at the previous level , This process is called hierarchical single sorting .
Hierarchical total ranking and consistency test .
- What we get above is the weight vector of a group of elements to an element in the upper layer . We end up with the elements , In particular, the ranking weight of each scheme in the lowest layer for the target , So as to select the scheme . The total ranking weight is important to synthesize the weights under the single criteria from top to bottom .

vector W , After normalization, it is the ranking weight of the relative importance of the corresponding factors at the same level to a factor at the previous level , This process is called hierarchical single sorting .
Hierarchical total ranking and consistency test .
- What we get above is the weight vector of a group of elements to an element in the upper layer . We end up with the elements , In particular, the ranking weight of each scheme in the lowest layer for the target , So as to select the scheme . The total ranking weight is important to synthesize the weights under the single criteria from top to bottom .
边栏推荐
- Uniapp preview function
- 【Unity】打包WebGL项目遇到的问题及解决记录
- Paper reading - group normalization
- [pytorch] kaggle image classification competition arcface + bounding box code learning
- Flow chart of interrupt process
- L1 regularization and its sparsity
- Basic exercises of test questions Fibonacci series
- Port mapping between two computers on different LANs (anydesk)
- Thesis reading - autovc: zero shot voice style transfer with only autoencoder loss
- [programming idea] communication interface of data transmission and decoupling design of communication protocol
猜你喜欢
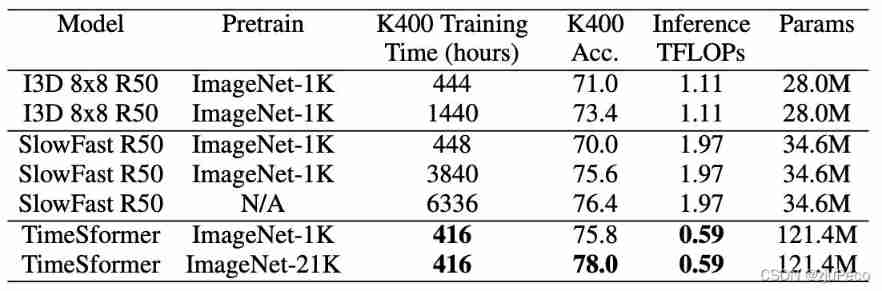
Is space time attention all you need for video understanding?

Build MySQL environment under mac

Sensor: MQ-5 gas module measures the gas value (code attached at the bottom)

Understand speech denoising

ROS learning-7 error in custom message or service reference header file

Record: how to solve the problem of "the system cannot find the specified path" in the picture message uploaded by transferto() of multipartfile class [valid through personal test]

Thesis reading - autovc: zero shot voice style transfer with only autoencoder loss

哈夫曼树及其应用

C language compressed string is saved to binary file, and the compressed string is read from binary file and decompressed.

Why is "iFLYTEK Super Brain 2030 plan" more worthy of expectation than "pure" virtual human
随机推荐
The precision of C language printf output floating point numbers
Deep learning the principle of armv8/armv9 cache
Leetcode 93 recovery IP address
(novice to) detailed tutorial on machine / in-depth learning with colab from scratch
Stm32+ze-08 formaldehyde sensor tutorial
ROS learning-8 pit for custom action programming
[keras] train py
【Unity】打包WebGL項目遇到的問題及解决記錄
拍拍贷母公司信也季报图解:营收24亿 净利5.3亿同比降10%
Common web page status return code crawler
[learning notes] xr872 audio driver framework analysis
Paper reading - beat tracking by dynamic programming
0- blog notes guide directory (all)
Several articles on norms
regular expression
[learning notes] xr872 GUI littlevgl 8.0 migration (display part)
Introduction to arm Cortex-M learning
js-dom
Ruixing coffee moves towards "national consumption"
JS get element