当前位置:网站首页>【学习笔记】图的连通性与回路
【学习笔记】图的连通性与回路
2022-07-05 14:10:00 【仰望星空的蚂蚁】
Graph Subset Problem
第一步删点挺妙的 。
如果一个点的度 < K-1 那么显然不会对答案造成贡献,可以用类似拓扑排序的过程把它删去 。
如果将度 <= K-1 的点删完后有剩余的话,可以解决 case 1 。
这题大小为 K 的团并不好找 。
我一开始的做法萎了
考虑在删掉度 = K-1 的点时判断这个点是否在一个团内 。
直接 O ( K 2 ) O(K^2) O(K2) 枚举是否两两有边 。
稍微算一下会发现时间复杂度 O ( m m log n ) O(m\sqrt{m}\log n) O(mmlogn) 。
细节:当一个点出队时才删除这个点以及和它相邻的边,注意一个点不要入队多次 。
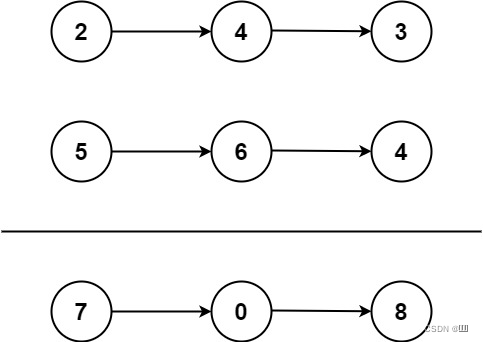
Tanya and Password
拆点搞一搞会发现这题就是叫你求欧拉路 。
可以用栈模拟,考虑一个点走不动后,把这条路径倒序压进答案中 。
细节:注意判断图的联通性,因为是有向图所以检查最终序列的长度比较方便。
一定要先判节点的度啊啊啊啊啊啊啊啊啊啊
Data Center Drama
不会
刚开始想歪了 。
其实看到出度入度为偶数的限制很容易想到欧拉回路 。
问题在于欧拉回路保证出度 = 入度,不保证出入度为偶数 。
考虑将欧拉回路中的偶数边取反,这样除终点外路径上经过的点一定满足限制 。
最后判断边的总数,如果为奇数则在起点连一个自环即可 。
边栏推荐
- 2022 machine fitter (Advanced) test question simulation test question bank simulation test platform operation
- 总量分析 核算方法和势方法 - 分摊分析
- Brief introduction to revolutionary neural networks
- How to introduce devsecops into enterprises?
- 关于Apache Mesos的一些想法
- 2022 construction welder (special type of construction work) special operation certificate examination question bank and online simulation examination
- Faire un clip vidéo auto - média deux fois, comment clip n'est pas considéré comme une infraction
- LeetCode_2(两数相加)
- 登录界面代码
- Getting started with rce
猜你喜欢
LeetCode_ 2 (add two numbers)
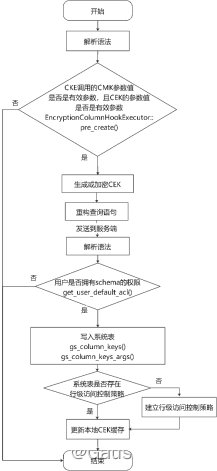
openGauss数据库源码解析系列文章—— 密态等值查询技术详解(下)
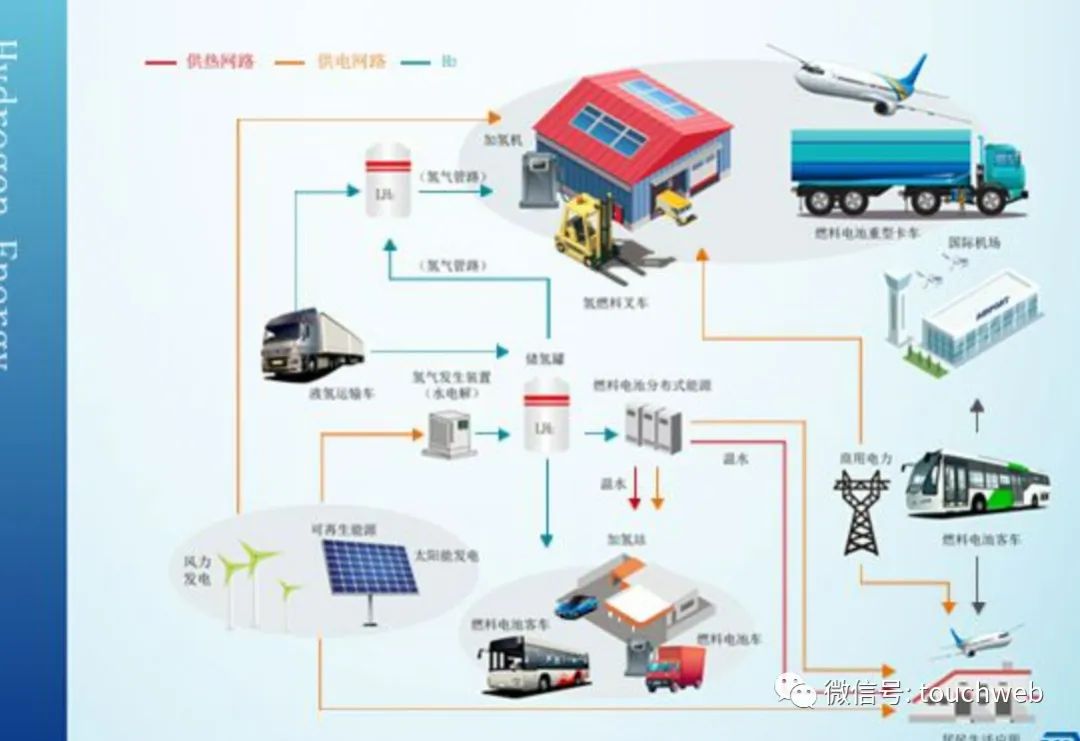
国富氢能冲刺科创板:拟募资20亿 应收账款3.6亿超营收
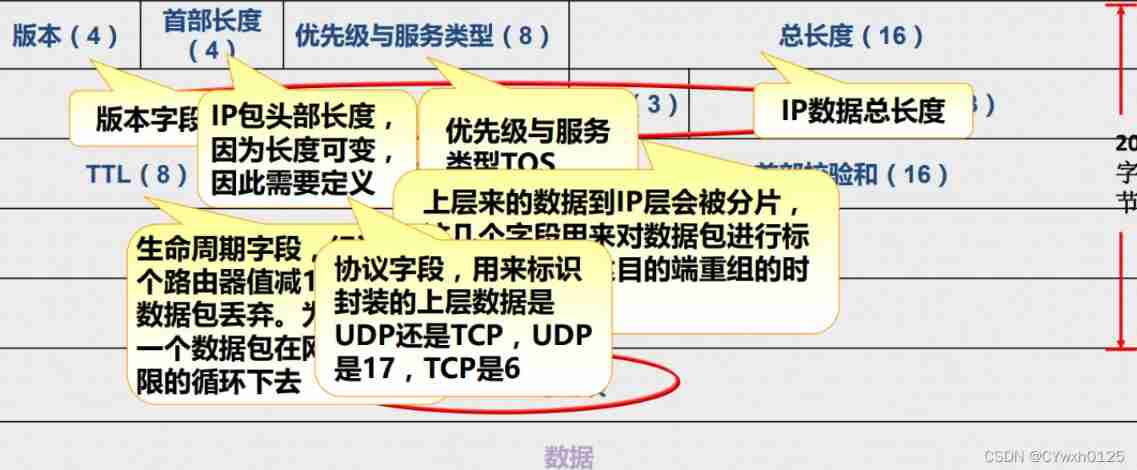
IP packet header analysis and static routing
TiFlash 面向编译器的自动向量化加速
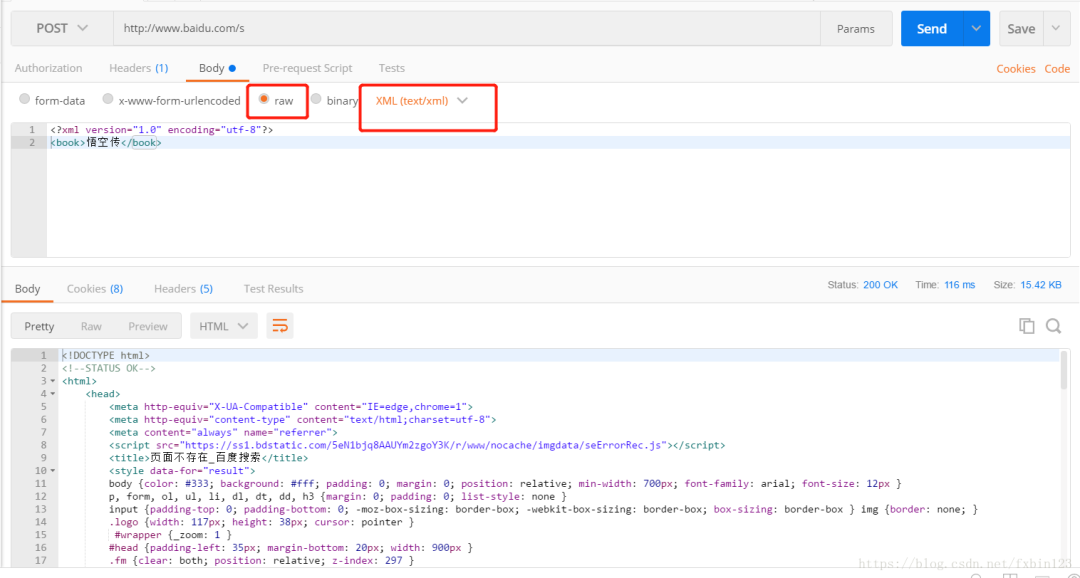
Postman简介、安装、入门使用方法详细攻略!
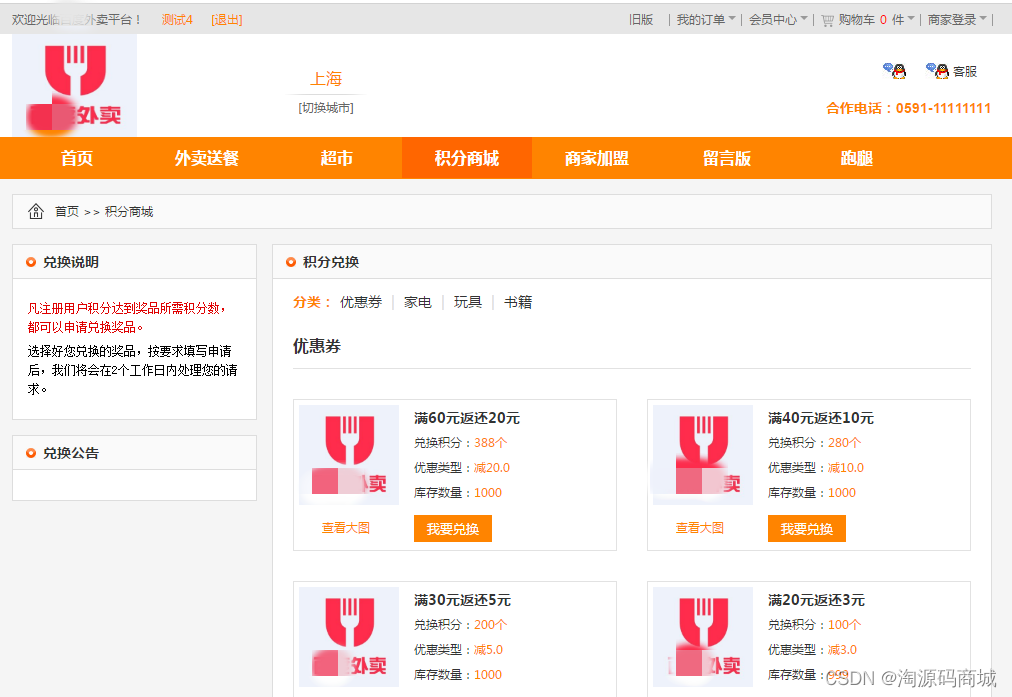
ASP.NET大型外卖订餐系统源码 (PC版+手机版+商户版)
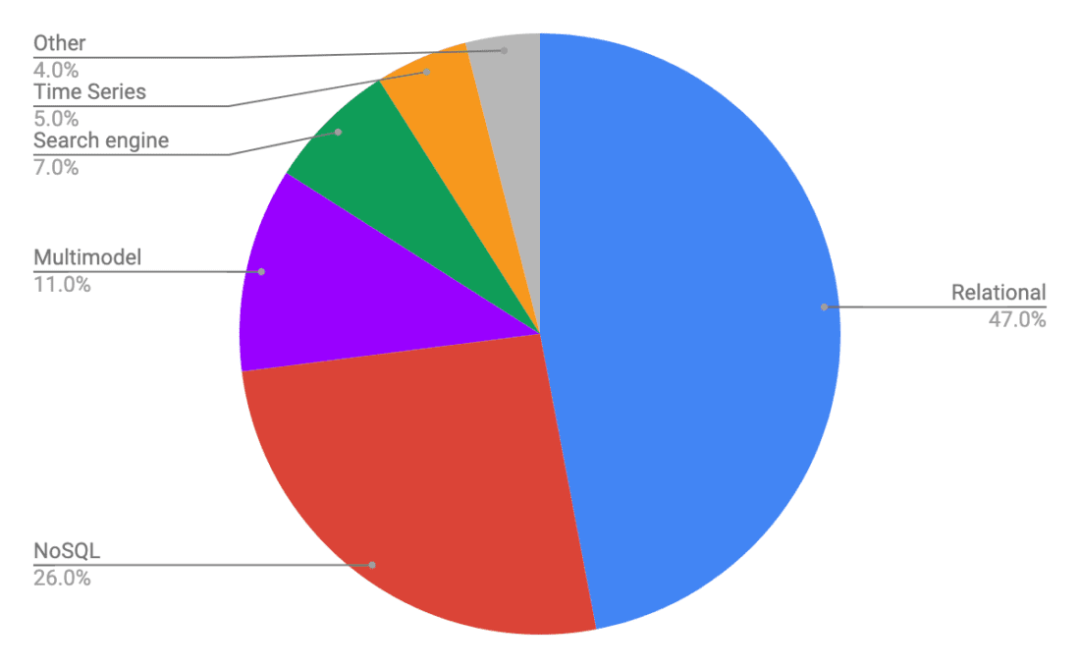
Comparison of several distributed databases
Getting started with rce

Shen Ziyu, nouveau Président de Meizu: M. Huang Zhang, fondateur de Meizu, agira comme conseiller stratégique pour les produits scientifiques et technologiques de Meizu
随机推荐
Interpretation of tiflash source code (IV) | design and implementation analysis of tiflash DDL module
清大科越冲刺科创板:年营收2亿 拟募资7.5亿
Kunlun Taike rushes to the scientific innovation board: the annual revenue is 130million, and it plans to raise 500million. CETC Taiji holds 40% of the shares
R语言使用原生包(基础导入包、graphics)中的boxplot函数可视化箱图(box plot)
Geom of R language using ggplot2 package_ Histogram function visual histogram (histogram plot)
关于memset赋值的探讨
TDengine 社区问题双周精选 | 第三期
R language uses the multinom function of NNET package to build an unordered multi classification logistic regression model, and uses the coef function to obtain the log odds ratio corresponding to eac
神经网络物联网未来发展趋势怎么样
Detailed explanation of SSH password free login
03_ Dataimport of Solr
SAS接口有什么优势特点
广发期货排名多少?网上办理广发期货开户安全可靠吗?
Google EventBus 使用详解
What is the future development trend of neural network Internet of things
Enjoy what you want. Zhichuang future
无密码身份验证如何保障用户隐私安全?
01 、Solr7.3.1 在Win10平台下使用jetty的部署及配置
分享 12 个最常用的正则表达式,能解决你大部分问题
Discussion on memset assignment