design sketch
SQL The trace of is correctly inserted between the call chains of microservices

Detailed records of SQL Execution content and time consumption

Search for SQL The type of

Multithreading (goroutine) Tracking effect under
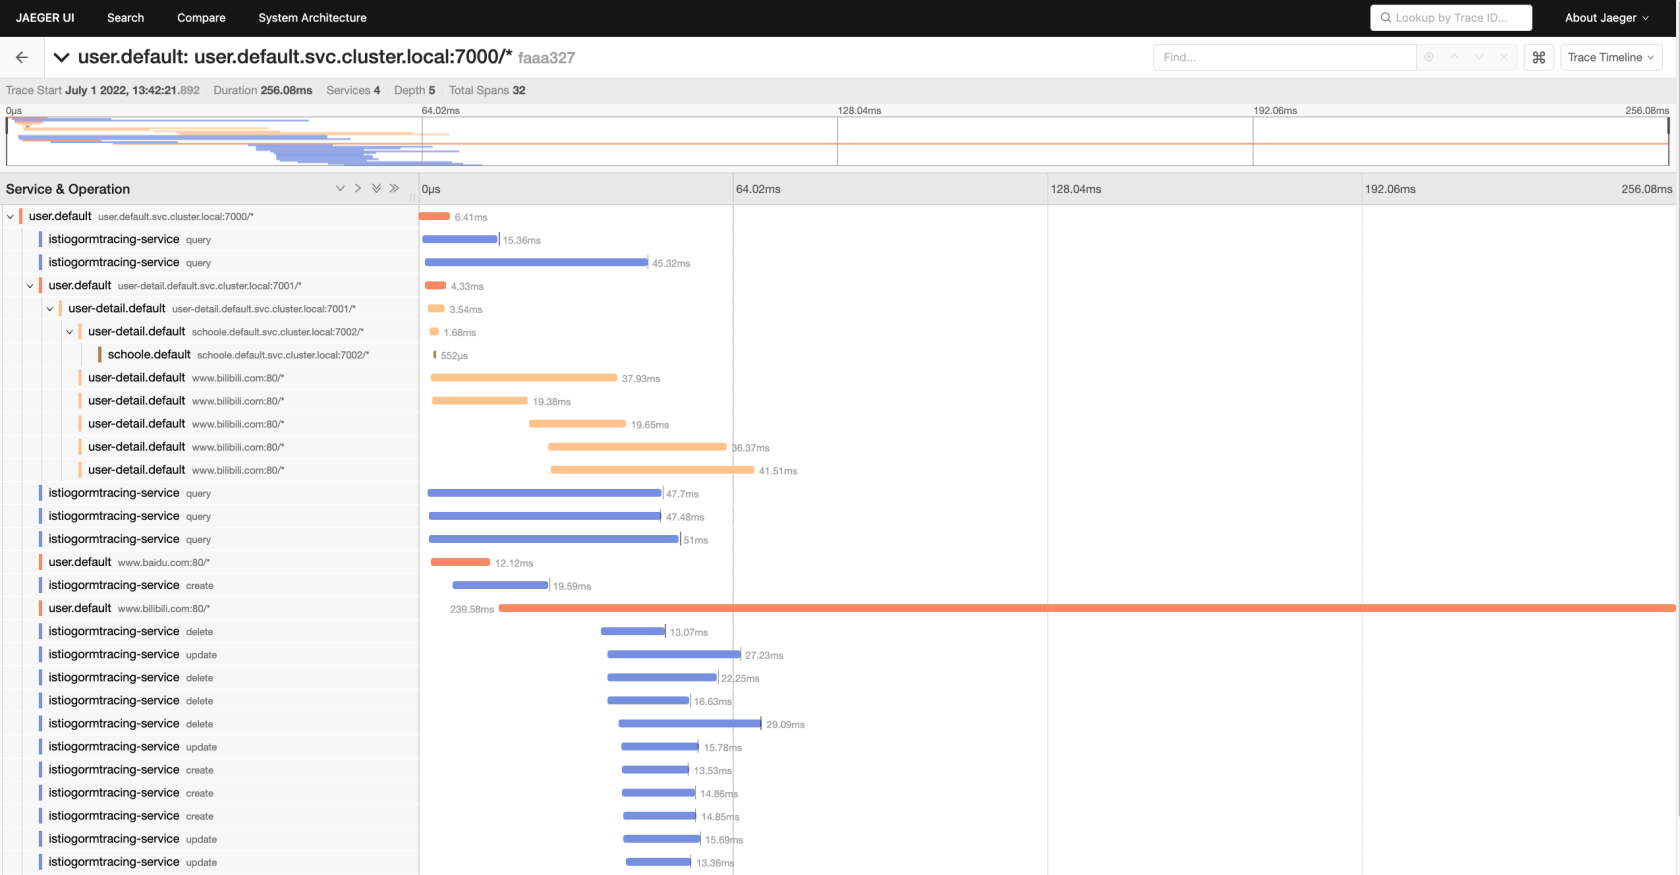
stay Kubernetes After the wechat service in Central China , adopt Istio Control the traffic between microservices ,Istio By default, trace will be generated for the calling relationship between microservices , Put it into the tracking collector . But he does not support more detailed SQL operation , For example, what has been implemented SQL, Every one of them SQL How long does it take . So , I wrote a simple support gorm Query and generate tracking plug-ins :istio-gorm-tracing
Microservice tracking gorm plug-in unit
stay kubernetes Upper use Istio After controlling the micro service , Calls between microservices will be automatically uploaded to Jaeger The collector of . But it can only be traced to the service layer , This is something I can't accept , I hope to further track all of the services MySQL Inquire about , Record each sql Time consuming , therefore , I simply wrote this plug-in .
characteristic
Support Istio
stay Istio Between container requests under control , It'll carry it automatically x-b3-traceid、x-b3-parentspanid、x-b3-spanid、x-b3-sampled Equal request header , These request headers are all related to zipkin The alignment of the . According to the request header information passed in, this plug-in , Auto resolve parent span, And bind the calling relationship between the upper and lower Services .
Record SQL Information
Each query will record the execution SQL Statement and execution time , As the basis for later microservice tracking .
Use
package main

import (
    istiogormtracing "github.com/liamhao/istio-gorm-tracing"
    "log"
    "fmt"
    "github.com/gin-gonic/gin"
    "gorm.io/driver/mysql"
    "gorm.io/gorm"
)

func main() {

    router := gin.Default()

    dsn := fmt.Sprintf("%s:%[email protected](%s:%d)/%s?charset=utf8mb4&parseTime=True&loc=Local", "dbuser", "dbpswd", "dbhost", 3306, "dbname")
    gormDb, err := gorm.Open(mysql.Open(dsn), &gorm.Config{})
    if err != nil {
        log.Println("mysql There's a problem with the connection :", err.Error())
    } else {
        log.Println("mysql Successful connection :", dsn)
    }

    //  This step is crucial , We must add , To enable our plug-in
    gormDb.Use(istiogormtracing.NewDefault(
        //  Your microservice name
        "istiogormtracing-service",
        //  Yours  Jaeger  Collector address
        "http://127.0.0.1:14268/api/traces",
    ))

    router.GET("/", func(c *gin.Context) {

        //  This step is crucial , We must add , in order to SQL It can be related to upstream and downstream Services
        istiogormtracing.H = c.Request.Header

        list := []map[string]interface{}{}
        gormDb.Table("users").Where("name = 'xiaoming'").Find(&list)

        c.JSON(http.StatusOK, map[string]interface{}{
            "istiogormtracing": "ok",
        })
    })

    router.Run(":7000")
}
Then you can Jaeger We can see what we recorded in the panel SQL 了 .