当前位置:网站首页>BEAUTIFUL GGPLOT VENN DIAGRAM WITH R
BEAUTIFUL GGPLOT VENN DIAGRAM WITH R
2022-07-02 09:41:00 【小宇2022】
if (!require(devtools)) install.packages("devtools")
devtools::install_github("gaospecial/ggVennDiagram")
library("ggVennDiagram")
library("ggVennDiagram")
set.seed(20190708)
genes <- paste("gene",1:1000,sep="")
x <- list(
A = sample(genes,300),
B = sample(genes,525),
C = sample(genes,440),
D = sample(genes,350)
)
# Default plot
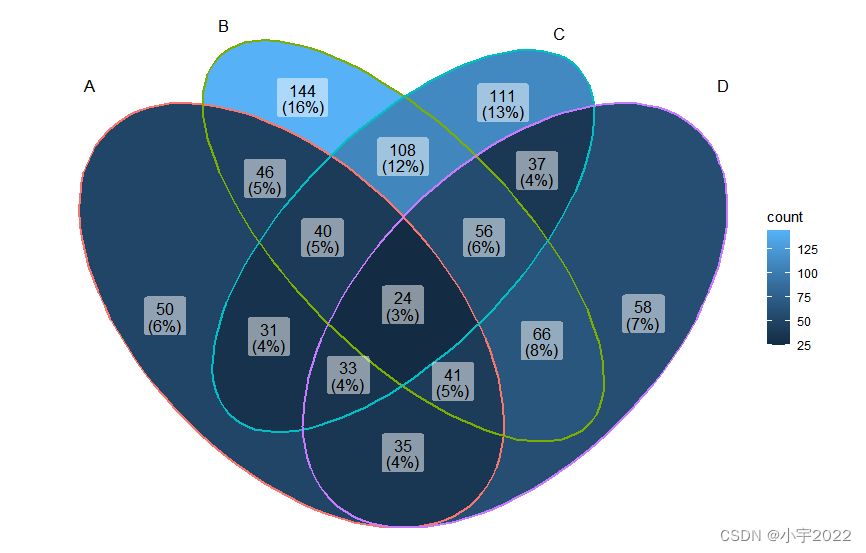
ggVennDiagram(x)
if (!require(devtools)) install.packages("devtools")
devtools::install_github("gaospecial/ggVennDiagram")
library("ggVennDiagram")
library("ggVennDiagram")
set.seed(20190708)
genes <- paste("gene",1:1000,sep="")
x <- list(
A = sample(genes,300),
B = sample(genes,525),
C = sample(genes,440),
D = sample(genes,350)
)
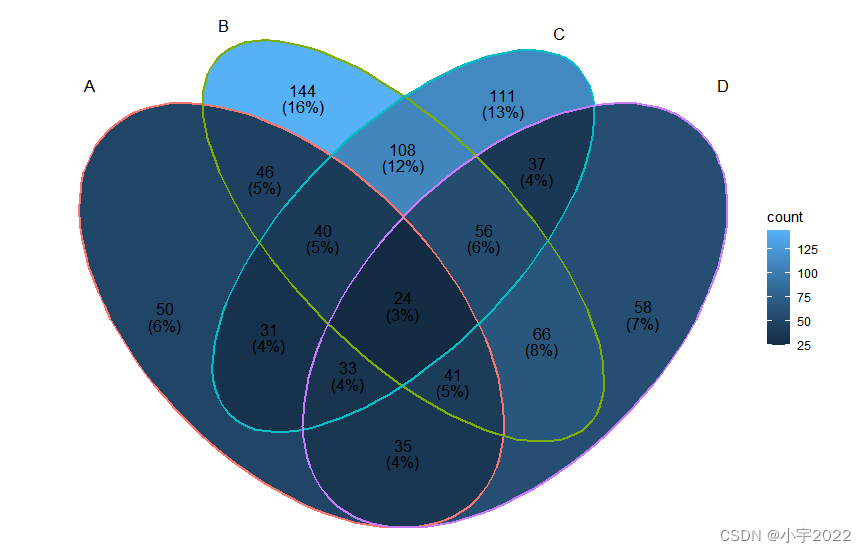
ggVennDiagram(x, label_alpha = 0)
if (!require(devtools)) install.packages("devtools")
devtools::install_github("gaospecial/ggVennDiagram")
library("ggVennDiagram")
library("ggVennDiagram")
set.seed(20190708)
genes <- paste("gene",1:1000,sep="")
x <- list(
A = sample(genes,300),
B = sample(genes,525),
C = sample(genes,440),
D = sample(genes,350)
)
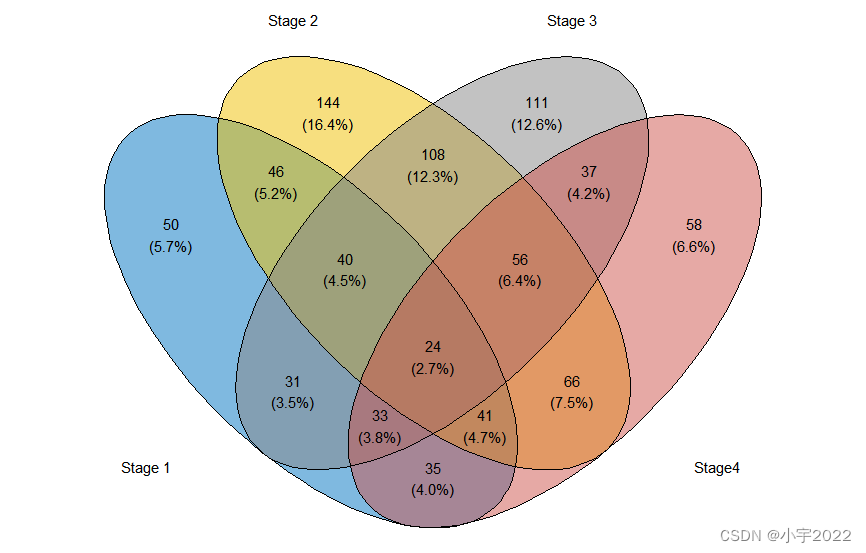
# Change category names
# Change the gradient fill color
ggVennDiagram(
x, label_alpha = 0,
category.names = c("Stage 1","Stage 2","Stage 3", "Stage4")
) +
ggplot2::scale_fill_gradient(low="blue",high = "yellow")

if (!require(devtools)) install.packages("devtools")
devtools::install_github("gaospecial/ggVennDiagram")
library("ggVennDiagram")
library("ggVennDiagram")
set.seed(20190708)
genes <- paste("gene",1:1000,sep="")
x <- list(
  A = sample(genes,300),
  B = sample(genes,525),
  C = sample(genes,440),
  D = sample(genes,350)
)
ggVennDiagram(x[1:3], label_alpha = 0)

if (!require(devtools)) install.packages("devtools")
devtools::install_github("gaospecial/ggVennDiagram")
library("ggVennDiagram")
library("ggVennDiagram")
set.seed(20190708)
genes <- paste("gene",1:1000,sep="")
x <- list(
A = sample(genes,300),
B = sample(genes,525),
C = sample(genes,440),
D = sample(genes,350)
)
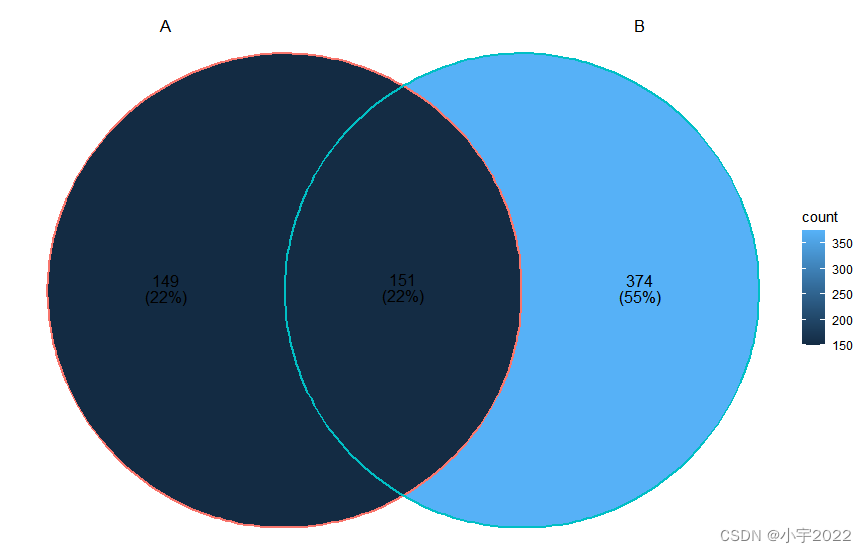
ggVennDiagram(x[1:2], label_alpha = 0)
if (!require(devtools)) install.packages("devtools")
devtools::install_github("yanlinlin82/ggvenn")
library("ggvenn")
library("ggvenn")
set.seed(20190708)
genes <- paste("gene",1:1000,sep="")
x <- list(
A = sample(genes,300),
B = sample(genes,525),
C = sample(genes,440),
D = sample(genes,350)
)
# Default plot
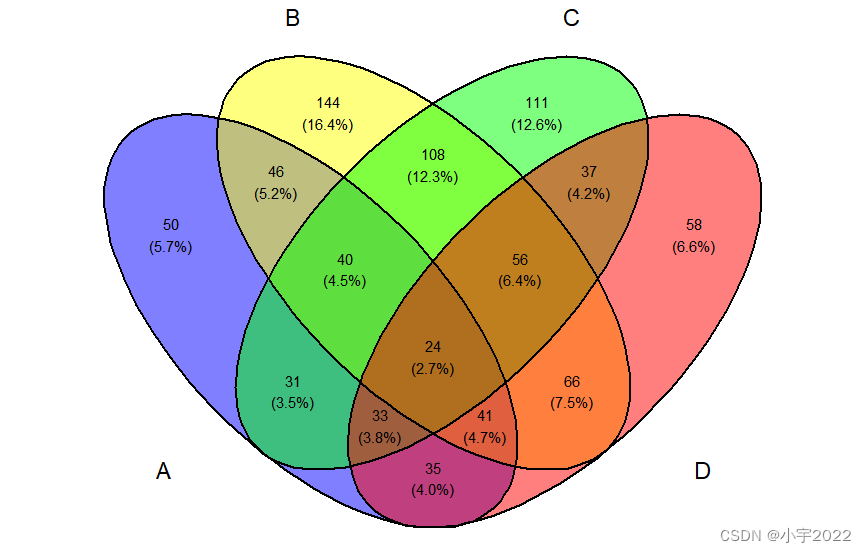
ggvenn(x)
if (!require(devtools)) install.packages("devtools")
devtools::install_github("yanlinlin82/ggvenn")
library("ggvenn")
library("ggvenn")
set.seed(20190708)
genes <- paste("gene",1:1000,sep="")
x <- list(
  A = sample(genes,300),
  B = sample(genes,525),
  C = sample(genes,440),
  D = sample(genes,350)
)
# Change category names
# Change the fill color
names(x) <- c("Stage 1","Stage 2","Stage 3", "Stage4")
ggvenn(
  x,
  fill_color = c("#0073C2FF", "#EFC000FF", "#868686FF", "#CD534CFF"),
  stroke_size = 0.5, set_name_size = 4
)
if (!require(devtools)) install.packages("devtools")
devtools::install_github("yanlinlin82/ggvenn")
library("ggvenn")
library("ggvenn")
set.seed(20190708)
genes <- paste("gene",1:1000,sep="")
x <- list(
A = sample(genes,300),
B = sample(genes,525),
C = sample(genes,440),
D = sample(genes,350)
)
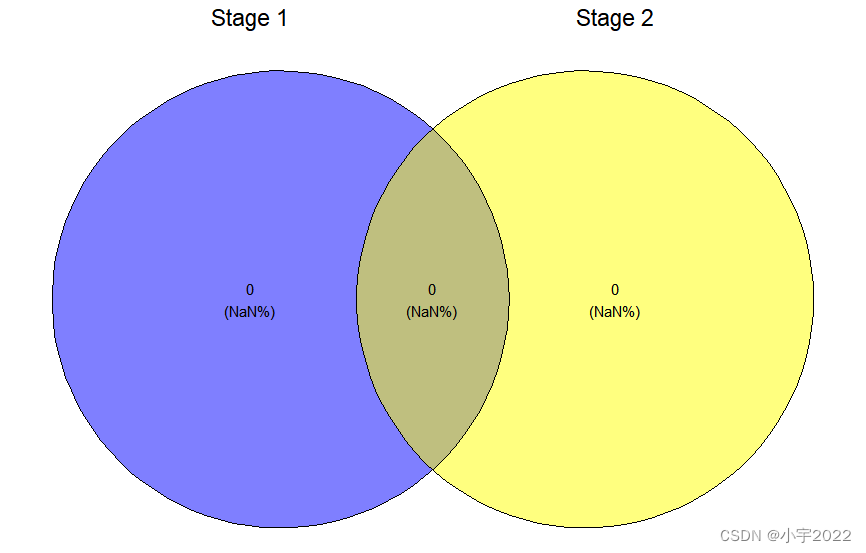
ggvenn(
x, columns = c("Stage 1", "Stage 2", "Stage 3"),
stroke_size = 0.5
)

if (!require(devtools)) install.packages("devtools")
devtools::install_github("yanlinlin82/ggvenn")
library("ggvenn")
library("ggvenn")
set.seed(20190708)
genes <- paste("gene",1:1000,sep="")
x <- list(
  A = sample(genes,300),
  B = sample(genes,525),
  C = sample(genes,440),
  D = sample(genes,350)
)
ggvenn(
  x, columns = c("Stage 1", "Stage 2"),
  stroke_size = 0.5
)
边栏推荐
- 基于Hardhat和Openzeppelin开发可升级合约(一)
- 程序员成长第六篇:如何选择公司?
- 在网上开股票账户安全吗?我是新手,还请指导
- Mmrotate rotation target detection framework usage record
- RPA advanced (II) uipath application practice
- Order by injection
- How to Create a Beautiful Plots in R with Summary Statistics Labels
- K-Means Clustering Visualization in R: Step By Step Guide
- Basic usage of MySQL in centos8
- HOW TO ADD P-VALUES TO GGPLOT FACETS
猜你喜欢
GGHIGHLIGHT: EASY WAY TO HIGHLIGHT A GGPLOT IN R

HOW TO ADD P-VALUES ONTO A GROUPED GGPLOT USING THE GGPUBR R PACKAGE

II Stm32f407 chip GPIO programming, register operation, library function operation and bit segment operation

2022年4月17日五心红娘团队收获双份喜报

Basic usage of MySQL in centos8
JS -- take a number randomly from the array every call, and it cannot be the same as the last time
Cluster Analysis in R Simplified and Enhanced
Webauthn - official development document

C#多维数组的属性获取方法及操作注意

vant tabs组件选中第一个下划线位置异常
随机推荐
HOW TO ADD P-VALUES ONTO A GROUPED GGPLOT USING THE GGPUBR R PACKAGE
K-Means Clustering Visualization in R: Step By Step Guide
Basic usage of MySQL in centos8
Multi line display and single line display of tqdm
Astparser parsing class files with enum enumeration methods
启牛商学院给的股票账户安全吗?能开户吗?
Jinshanyun - 2023 Summer Internship
Summary of data export methods in powerbi
Redis超出最大内存错误OOM command not allowed when used memory &gt; 'maxmemory'
HOW TO ADD P-VALUES TO GGPLOT FACETS
Native method merge word
Verilog and VHDL signed and unsigned number correlation operations
Wechat applet uses Baidu API to achieve plant recognition
Is it safe to open a stock account online? I'm a novice, please guide me
Is the stock account given by qiniu business school safe? Can I open an account?
The difference between SQL left join main table restrictions written after on and where
CTF record
MySQL比较运算符IN问题求解
How to Add P-Values onto Horizontal GGPLOTS
SSRF