当前位置:网站首页>matlab drawing
matlab drawing
2022-08-04 21:05:00 【Lin Dexi】
This article describes how to use matlab to draw.This article includes: line chart x-axis and y-axis, title, legend Column chart fill pattern
Line Chart
How does matlab set the distance between the legend and the x-axis of the graph in the next section
The legend of the line chart needs to know the Legend, which can be set using him
legend(...,'Location',LOC) adds alegend in the specifiedlocation, LOC, with respect to the axes. LOC may be either a1x4 position vector or one of the following strings:'North' inside plot box near top'South' inside bottom'East' inside right'West' inside left'NorthEast' inside top right (default for 2-D plots)'NorthWest' inside top left'SouthEast' inside bottom right'SouthWest' inside bottom left'NorthOutside' outside plot box near top'SouthOutside' outside bottom'EastOutside' outside right'WestOutside' outside left'NorthEastOutside' outside top right (default for 3-D plots)'NorthWestOutside' outside top left'SouthEastOutside' outside bottom right'SouthWestOutside' outside bottom left'Best' least conflict with data in plot'BestOutside' least unused space outside plotHow to set the x-axis size?
It can be set by set(gca,'xtick',1:1:100);code setting starts from 1 and ends at 100, explain
set(gca,'xtick',start:between two dots:end);
Histogram
How to draw a bar chart and how to fill the bar chart with different patterns?
Matlab histogram fill pattern can be drawn using applyhatch, the following will tell you how to do it
The first step is to copy the file applyhatch.m to your computer.About where to download applyhatch.m, please Baidu, if you can't find it, you can contact me at [email protected]
Don't tell in herenext
The second step is to copy the file to the workbench. What is the workbench is the folder path opened by the software. The path is as shown below
You can modify it yourself, just put the above files in this folder.
The usage is applyhatch(gcf,'\.x.');
The second parameter is to use a different pattern, you can add '/', '\', '|', '-', '+', 'x', '.'several characters
Example:
close allclear allclc% The computer journal paper% Jigang Wu etc.% copyright: [email protected]% data = [31,32,35;72,73,75;113,114,117;144,146,147;171,173,174;213,215,220];data =[16,17,18;33,34,37;51,54,55;71,74,74;86,91,91;105,113,113];bar(data,1);axis([0 7 0.0 150]);legend('DPA','TSRP','GRP',0);grid on;set(gca,'XTickLabel',{'100','200','300','400','500','600'});xlabel('The number of internal nodes');ylabel('The number of replica that created');set(gcf,'Color','w'); % Set the background color to white, otherwise the color of the area where the coordinate axis appears is grayapplyhatch(gcf,'\.x.');For different combinations of histograms, use data=[data 1.1, data 1.2, data 1.3; data 2.1, data 2.2...]
Then draw it, use bar(data,1); The second parameter is the width, try to modify the second value and run it.
The legend can be used. The legend of matlab uses legend('DPA','TSRP','GRP',0); to add the corresponding legend as much as there is data.
Try the following code:
y=[559006 ,2269384,783762;508559 ,2140905,696001;506491,2007763,735464]bar(y,0.6)legend('n','N','l')grid on;set(gca,'XTickLabel',{'first','second','third'})xlabel('Number of matches')ylabel('Number of results')set (gcf,'Position',[500,500,500,500],'color','w')applyhatch(gcf,'\.x./');set(gcf,'Color','w'); If you encounter problems with the process, you can contact me.
Thanks to Brother Chen Long for his help.
边栏推荐
猜你喜欢
![[2022 Hangzhou Electric Multi-School 5 1003 Slipper] Multiple Super Source Points + Shortest Path](/img/78/054329dec6a6faea5e9d583b6a8da5.png)
[2022 Hangzhou Electric Multi-School 5 1003 Slipper] Multiple Super Source Points + Shortest Path
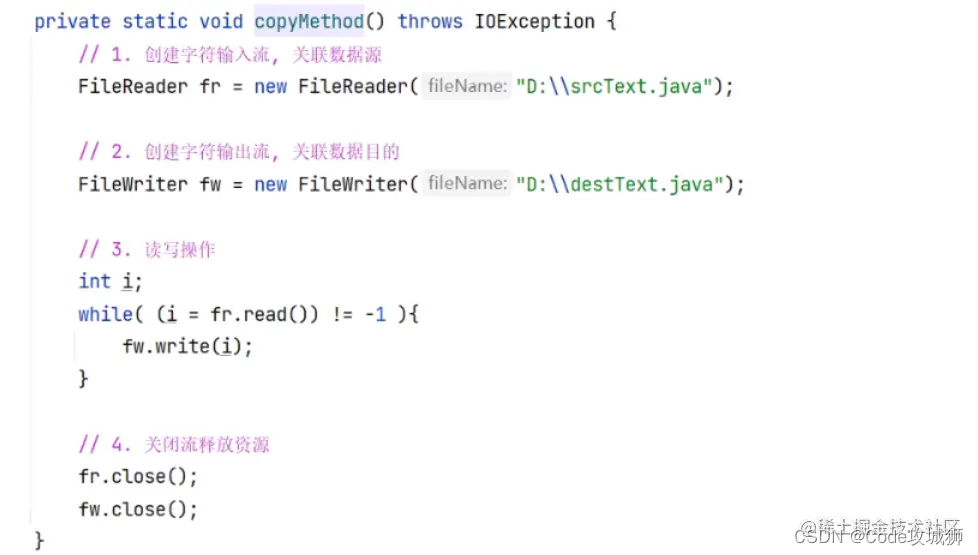
3. Byte stream and character stream of IO stream

【学术相关】清华教授发文劝退读博:我见过太多博士生精神崩溃、心态失衡、身体垮掉、一事无成!...
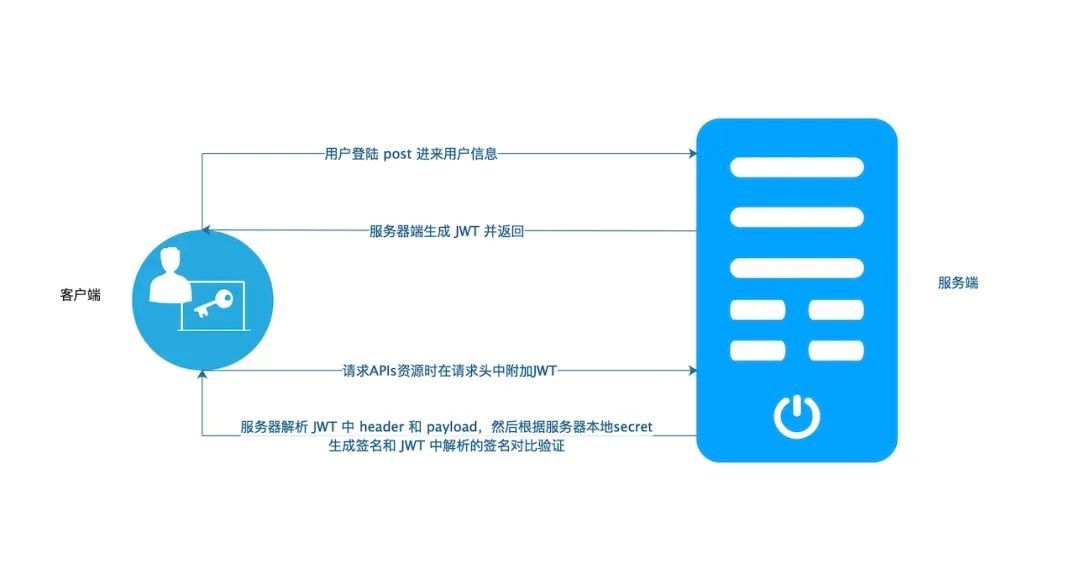
JWT主动校验Token是否过期

Oreo域名授权验证系统v1.0.6公益开源版本网站源码
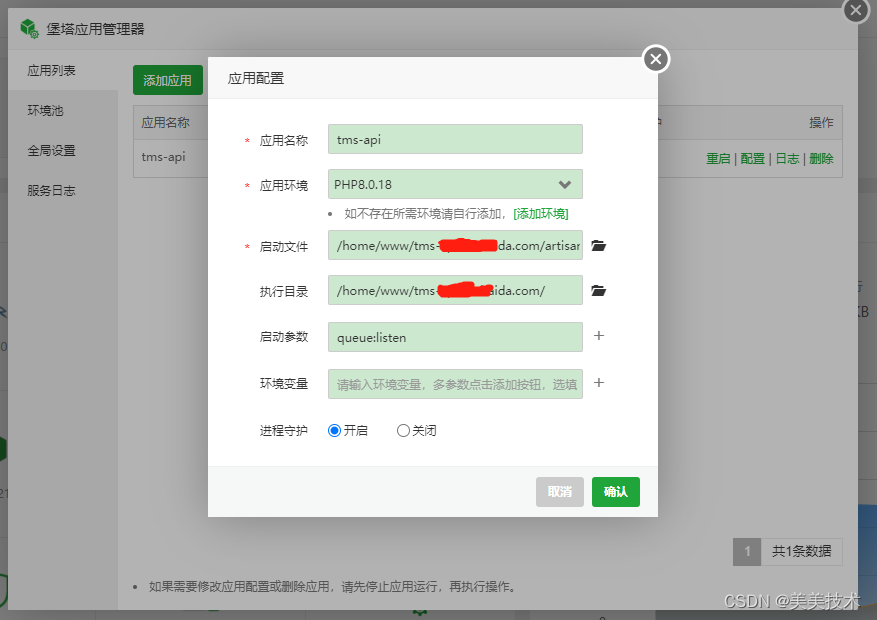
Configure laravel queue method using fort app manager
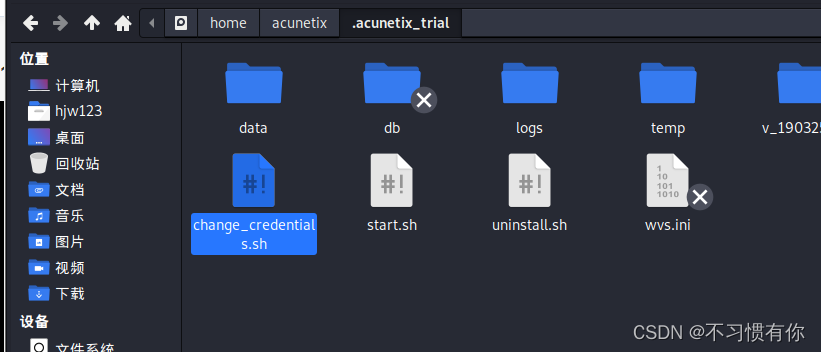
web漏洞扫描器-awvs
ADB 安装 + 打驱动全教程
构建Buildroot根文件系统(I.MX6ULL)

Five Minutes Introductory Text Processing Three Musketeers grep awk sed
随机推荐
二叉搜索树解决硬木问题
QT(42)-QT线程-线程调用槽函数
【AGC】构建服务1-云函数示例
路由中的meta、params传参的一些问题(可传不可传,为空,搭配,点击传递多次参数报错)
bracket matching
MySQL字段类型
简述@RequestParam与@RequestBody参数注解
dotnet enables JIT multi-core compilation to improve startup performance
LayaBox---TypeScript---首次接触遇到的问题
如何最简单、通俗地理解爬虫的Scrapy框架?
MySQL field type
LINQ to SQL (Group By/Having/Count/Sum/Min/Max/Avg操作符)
node 的运行命令
推荐系统_刘老师
Zero-knowledge proof - zkSNARK proof system
【1403. 非递增顺序的最小子序列】
js的new Function()常用方法
密码学系列之:PEM和PKCS7,PKCS8,PKCS12
Configure laravel queue method using fort app manager
88. (the home of cesium) cesium polymerization figure