当前位置:网站首页>Rainbow plug-in extension: monitor MySQL based on MySQL exporter
Rainbow plug-in extension: monitor MySQL based on MySQL exporter
2022-07-25 19:48:00 【Rainbond】

MySQLD Exporter Plug ins are standard based MySQLD Exporter Realization .Rainbond Self contained Prometheus The monitoring system rbd-monitor Will collect Exporter Data in , And display it through the monitoring panel . Users can customize the indicators that show which key performance data , This is surveillance Mysql The best choice for database services .
install Mysql-Exporter plug-in unit
Click... On the left in the team view plug-in unit tab , Go to my plug-in page . Choose to install from the store / New plug-in .
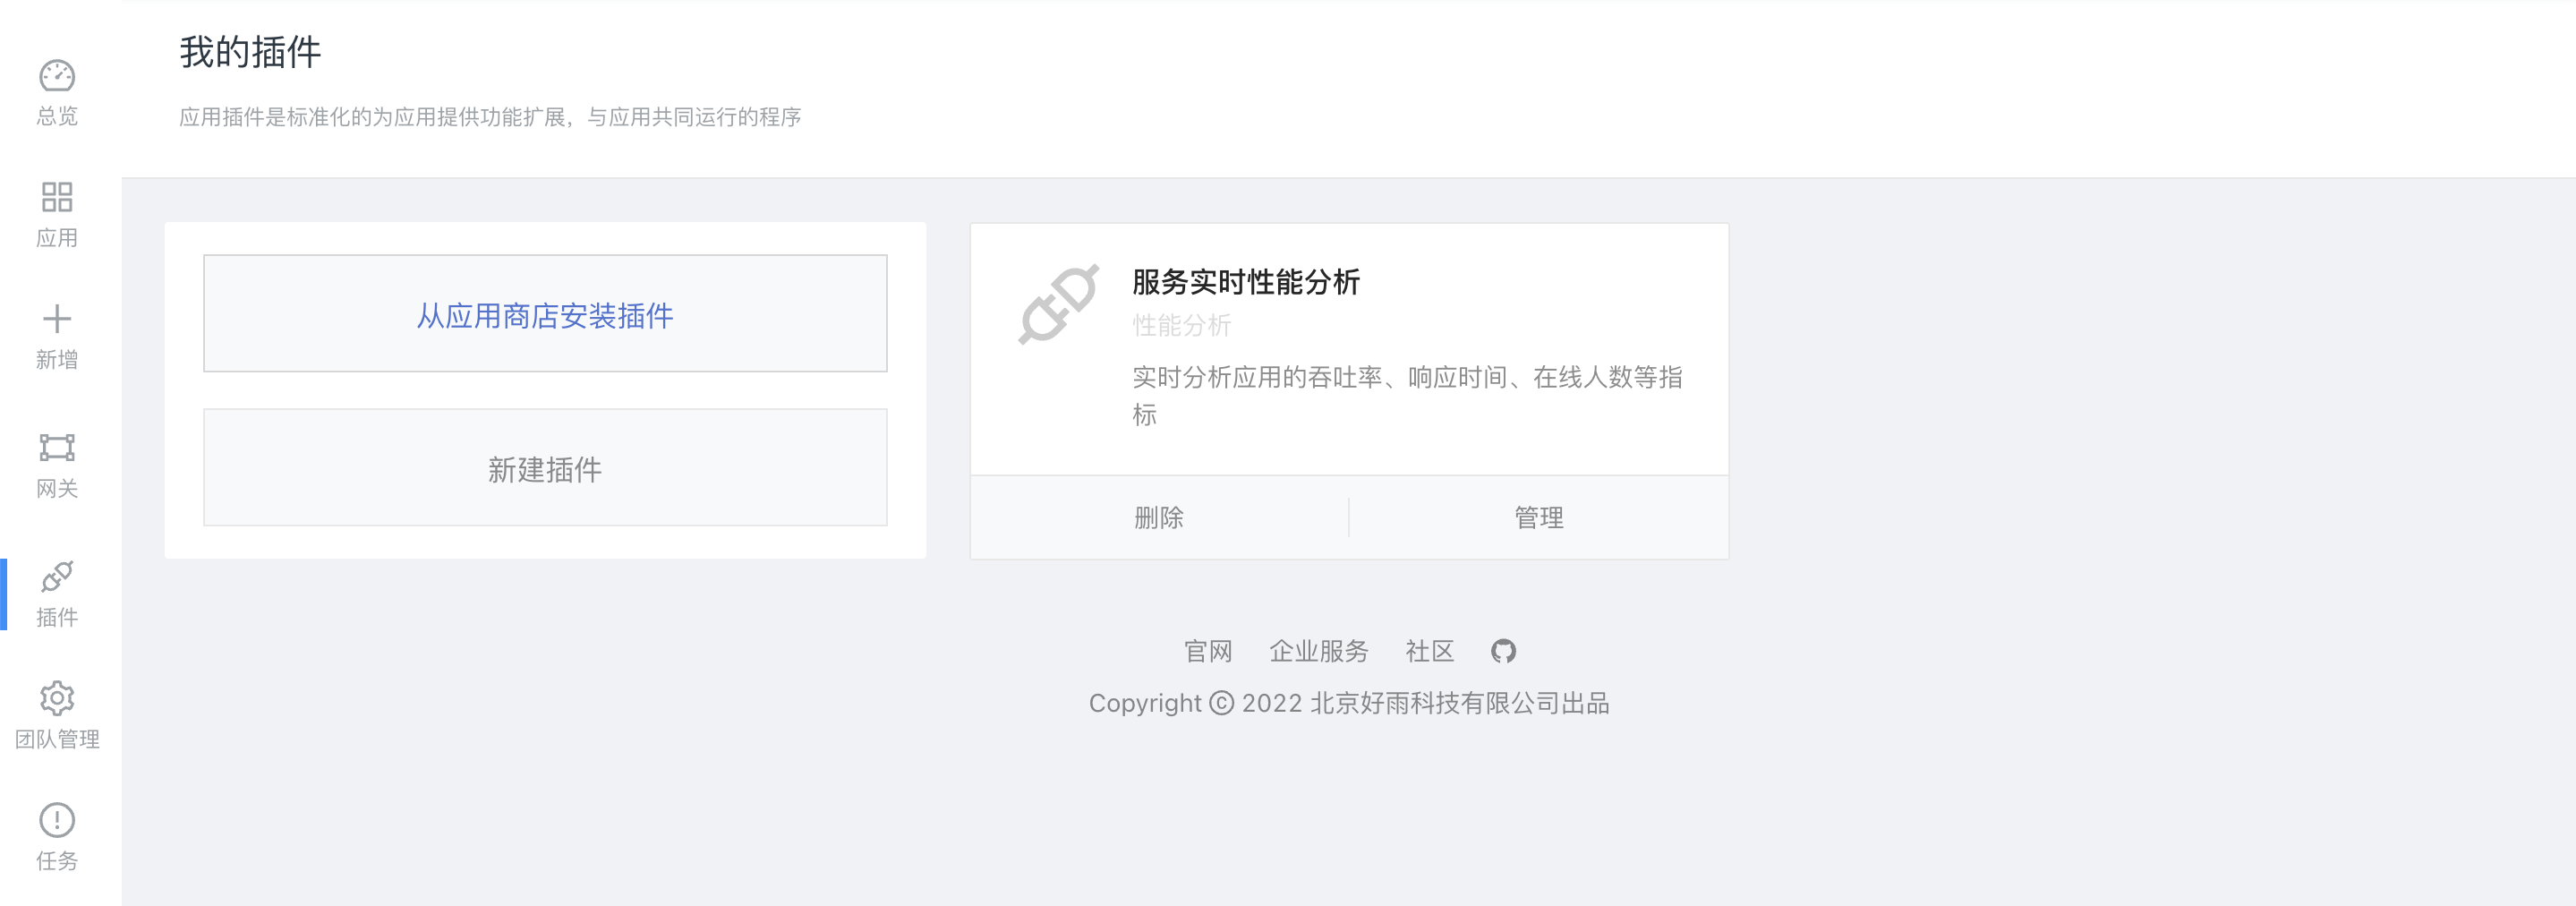
Search the open source app store for Mysql-exportor , Click Install to install the plug-in into the current team .

Existing Mysql The plug-in page of the service component can Opening MySQLD Exporter plug-in unit .

After opening the plug-in , Check the configuration , confirm DATA_SOURCE_NAME (MySQL Connection information ) Whether it is right . meanwhile , Also confirm the setting of time zone and monitored Mysql Whether the service components are consistent . The configuration in the figure represents the use of Asia/Shanghai The time zone ,Mysql Service components can use the same environment variable configuration to declare time zones .

After confirmation , According to the prompt to update Mysql Service components , You can start collecting MySQLD Exporter Indicators provided .
Management monitoring point
Click... On the top right of the business monitoring panel Management monitoring point , Monitoring point information can be defined , This information defines the source of monitoring indicators .
MySQLD Exporter The plug-in has defined the configuration of a set of monitoring points , This set of configurations contains the following elements , These elements are required :
- Configuration name : Customize the name of this group of configurations
- Collection task name : Customize
- route : Source path of indicators , according to Exporter Different designs , You need to fill in the appropriate path
- port :Exporter Listening port , Default listening 9104, The user needs to be Mysql Main service on 9104 Internal service of port .
- Collection interval : How often are indicators collected

Check the monitor
This plug-in has been configured with common monitoring charts by default , Click one button to import , Use mysqld-exportor The scheme can generate charts .
In turn, click monitor —— Business monitoring You can see the corresponding monitoring chart :
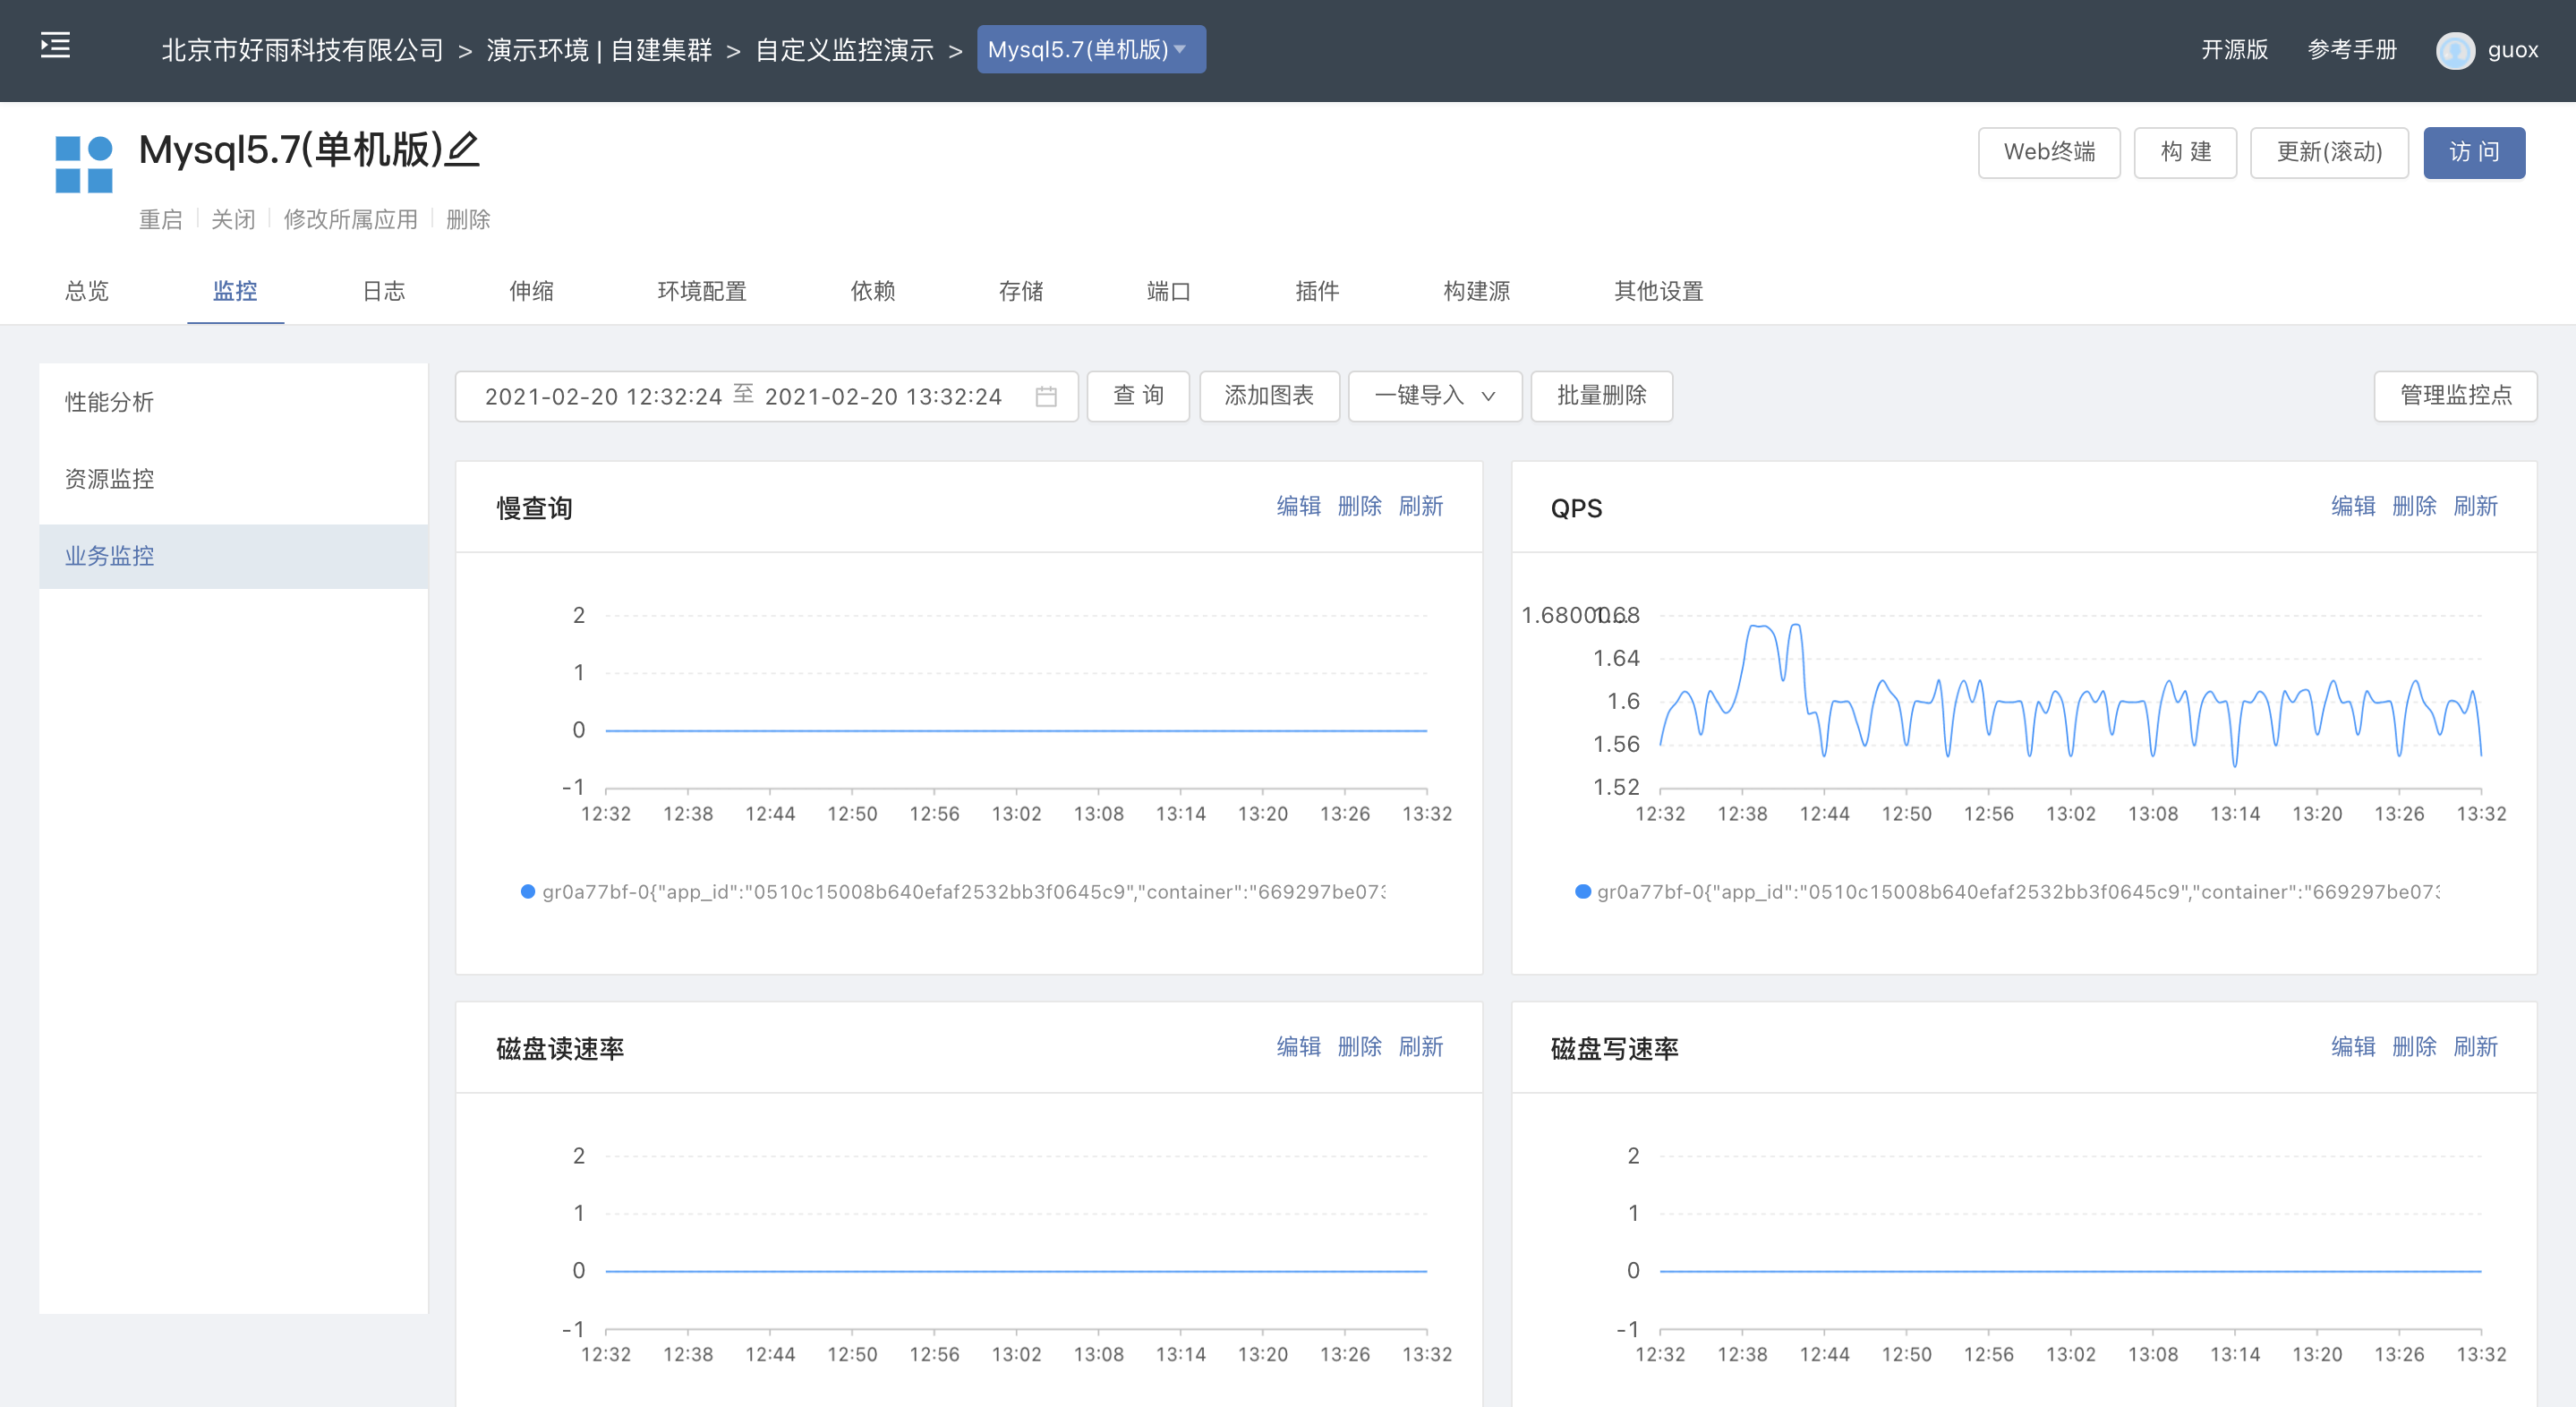
The default monitoring chart shows MySQLD Business monitoring data items include :
| Monitoring item |
|---|
| The slow query |
| OPS |
| Disk read rate |
| Disk write rate |
| Byte receive rate |
| Byte send rate |
| InnoDB Cache pool size |
| Connection thread peak |
| Running thread peak |
| Average running threads |
| Table Lock lmmediate |
| Table Lock Waited |
Add a custom monitoring chart
If we want to add a monitoring chart , To show the current number of connections to the database , Please follow the following steps :
Click Add chart
Enter a new title , And the corresponding query criteria mysql_global_status_threads_connected after , Click on Inquire about . If it returns to the chart normally , Then the query conditions are correct . The definition of the title should be as clear as possible , And specify the unit if necessary .

Click on add to after , You can add the new monitoring chart to the business monitoring panel . The newly added monitoring chart will be placed at the end .
visit Mysql Of service components 9104 port , Can be in /metrics Under the path , View all monitoring items available for mapping .

边栏推荐
- 分享 25 个有用的 JS 单行代码
- How to get started quickly in software testing
- Wechat applet 10 - wechat template
- ERROR: role “admin“ cannot be dropped because some objects depend on itDETAIL:
- 六轴传感器使用学习记录
- PyTorch 模型 onnx 文件的导出和调用
- Recommendations on how to install plug-ins and baby plug-ins in idea
- 给容器添加3d效果的副标题
- What is the method to load the torch pre trained model for the mindspore model finetune?
- High number_ Chapter 3 learning experience and summary of multiple integral
猜你喜欢

北航等《深度学习事件抽取》文献综述论文,27页pdf阐述当前趋势

binarySearch基础二分查找

NPM semantic version control, solution console prop being mutated: "placement" error

Global configuration and page configuration of wechat applet development

伺服驱动器在机器人上的研究与应用

03 isomorphism of tree 1

Kcon 2022 highlights and agenda revealed!

When the V100 of mindpole 8 card is trained to 101 epochs, an error of reading data timeout is reported

连接数据库警告 Establishing SSL connection without server‘s identity verification is not recommended.

Hongke shares | how to solve blackmail software security vulnerabilities
随机推荐
Selenium运行慢 - 通过设置selenium加载策略加快运行速度
EZDML reverse engineering import database analysis practical operation tutorial
从瞳代到“瞳代”再到品牌,暴利的美瞳的变与未变
Detailed explanation of three methods of selenium setting element waiting
When the V100 of mindpole 8 card is trained to 101 epochs, an error of reading data timeout is reported
What is idealism
sentinel简单限流和降级demo问题记录
JS learning notes 17: DOM query exercise
Error when creating dataset with mindscore
03 isomorphism of tree 1
Mobile phone touch picture slider rotation plug-in photoswipe.js
Typeerror: 'STR' object is not callable error reason
安全基础4 ---正则表达式
Network design and planning of a company
ERROR: role “admin“ cannot be dropped because some objects depend on itDETAIL:
what is qml in qt
PyTorch 模型 onnx 文件的导出和调用
Stochastic gradient descent method, Newton method, impulse method, adagrad, rmsprop and Adam optimization process and understanding
How does tiktok break zero?
Istio exposes applications to the Internet