当前位置:网站首页>Extrapolated scatter data
Extrapolated scatter data
2022-07-03 11:40:00 【jk_ one hundred and one】
Catalog
Factors affecting the accuracy of extrapolation
Compare the extrapolation of coarse sampling and fine sampling scatter data
Factors affecting the accuracy of extrapolation
scatteredInterpolant It provides the function of finding approximate solutions to points outside the convex hull .'linear' The extrapolation method is based on the least square approximation of the gradient at the convex hull boundary . The value returned for the query point outside the convex hull is based on the value at the boundary and the gradient . The quality of the solution depends on the way the data is sampled . If it is rough data sampling , The quality of extrapolation is poor .
Besides , Triangulation near the convex hull boundary may have strip triangles . These triangles will affect the extrapolation results , It will affect the interpolation results . The extrapolation results should be visually checked with knowledge of the external behavior of the domain .
Compare the extrapolation of coarse sampling and fine sampling scatter data
This example shows how to insert two different samples of the same parabolic function . This example shows that a better distribution of sampling points can produce better extrapolation results .
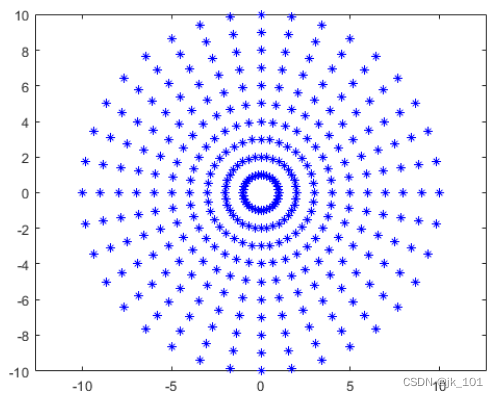
around 10 Concentric circles are created with a spacing of 10 Radial distribution point of degree . Use bsxfun Calculate the coordinate x=cosθ and y=sinθ.
theta = 0:10:350;
c = cosd(theta);
s = sind(theta);
r = 1:10;

x1 = bsxfun(@times,r.',c);
y1 = bsxfun(@times,r.',s);

figure
plot(x1,y1,'*b')
axis equal
As shown in the figure :
Create a second set of points with a coarser distribution . Use rand Function in range [-10, 10] Create random samples in .
rng default;
x2 = -10 + 20*rand([25 1]);
y2 = -10 + 20*rand([25 1]);
figure
plot(x2,y2,'*')
As shown in the figure :

Parabola function at two point sets v(x,y) sampling .
v1 = x1.^2 + y1.^2;
v2 = x2.^2 + y2.^2;
in the light of v(x,y) For each sample created scatteredInterpolant.
F1 = scatteredInterpolant(x1(:),y1(:),v1(:));
F2 = scatteredInterpolant(x2(:),y2(:),v2(:));
Create a grid of query points that will extend outside each domain .
[xq,yq] = ndgrid(-20:20);Calculation F1 And draw the results .
figure
vq1 = F1(xq,yq);
surf(xq,yq,vq1)
As shown in the figure :
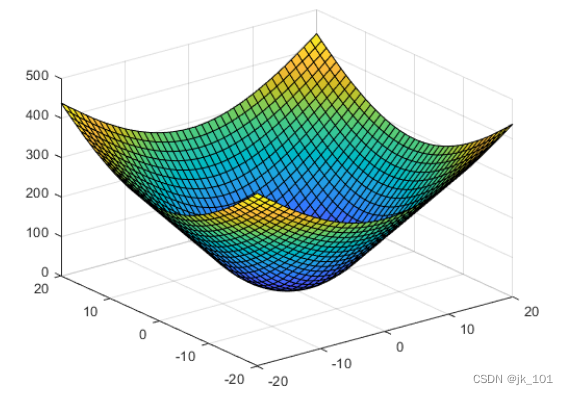
Calculation F2 And draw the results .
figure
vq2 = F2(xq,yq);
surf(xq,yq,vq2)
As shown in the figure :

Due to v2 The points in are roughly sampled ,F2 The extrapolation quality of is poor .
3D data extrapolation
This example shows how to use scatteredInterpolant Extrapolate the well sampled 3D mesh dataset . The query point is located on a flat grid completely outside the domain .
Create a 10×10×10 grid . The points in each dimension are in the range [-10, 10] in .
[x,y,z] = ndgrid(-10:10);The function at the sampling point v(x,y,z) sampling .
v = x.^2 + y.^2 + z.^2;establish scatteredInterpolant, And specify linear interpolation and extrapolation .
F = scatteredInterpolant(x(:),y(:),z(:),v(:),'linear','linear');Calculation x-y Grid midspan [-20,20] Range and elevation is z =15 Interpolation of time .
[xq,yq,zq] = ndgrid(-20:20,-20:20,15);
vq = F(xq,yq,zq);
figure
surf(xq,yq,vq)
As shown in the figure :

Because the function is well sampled , Extrapolation returns better results .
边栏推荐
- 一些常用术语
- Solicitation for JGG special issue: spatio-temporal omics
- R language uses grid of gridextra package The array function combines multiple visual images of the ggplot2 package horizontally, and the ncol parameter defines the number of columns of the combined g
- Use typora to draw flow chart, sequence diagram, sequence diagram, Gantt chart, etc. for detailed explanation
- DS90UB949
- Driver development based on I2C protocol
- 基于I2C协议的驱动开发
- Viewing binary bin files with notepad++ editor
- CSRF
- 同事写了一个责任链模式,bug无数...
猜你喜欢
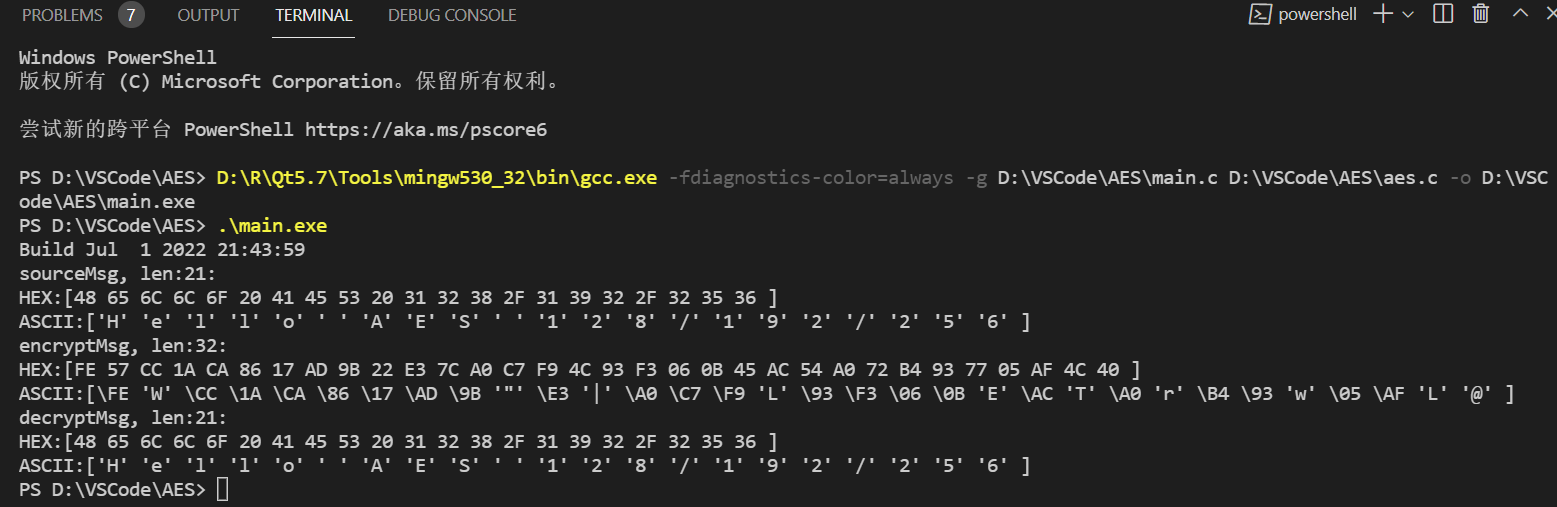
C language AES encryption and decryption
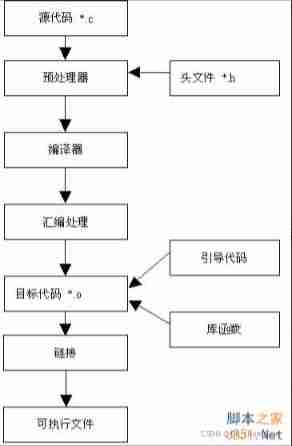
GCC compilation process and dynamic link library and static link library

00后抛弃互联网: 毕业不想进大厂,要去搞最潮Web3
![[OBS] configFile in ini format of OBS](/img/b2/0b130cee6ea884557a30e4b408f49e.png)
[OBS] configFile in ini format of OBS
Cadence background color setting

【学习笔记】dp 状态与转移

Matlab extracts numerical data from irregular txt files (simple and practical)
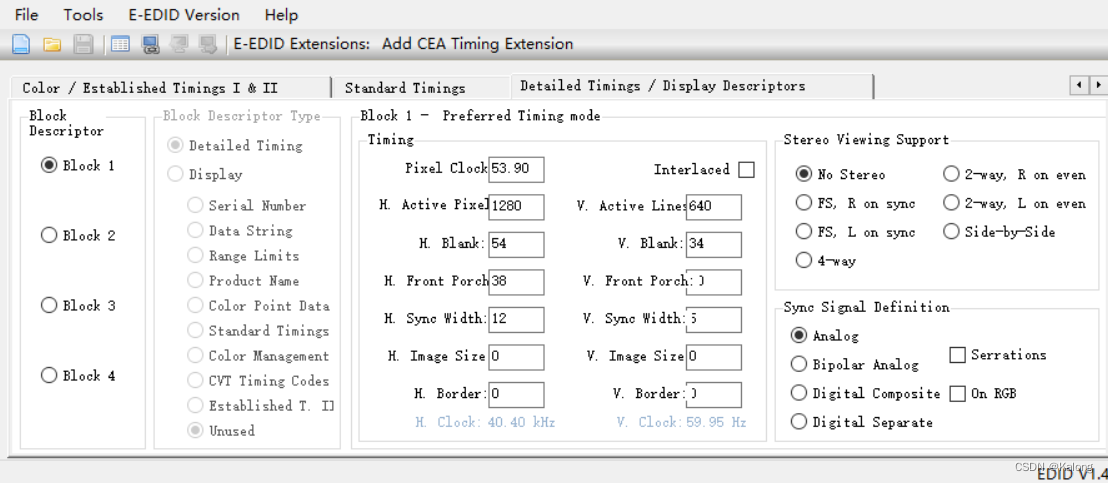
DS90UB949
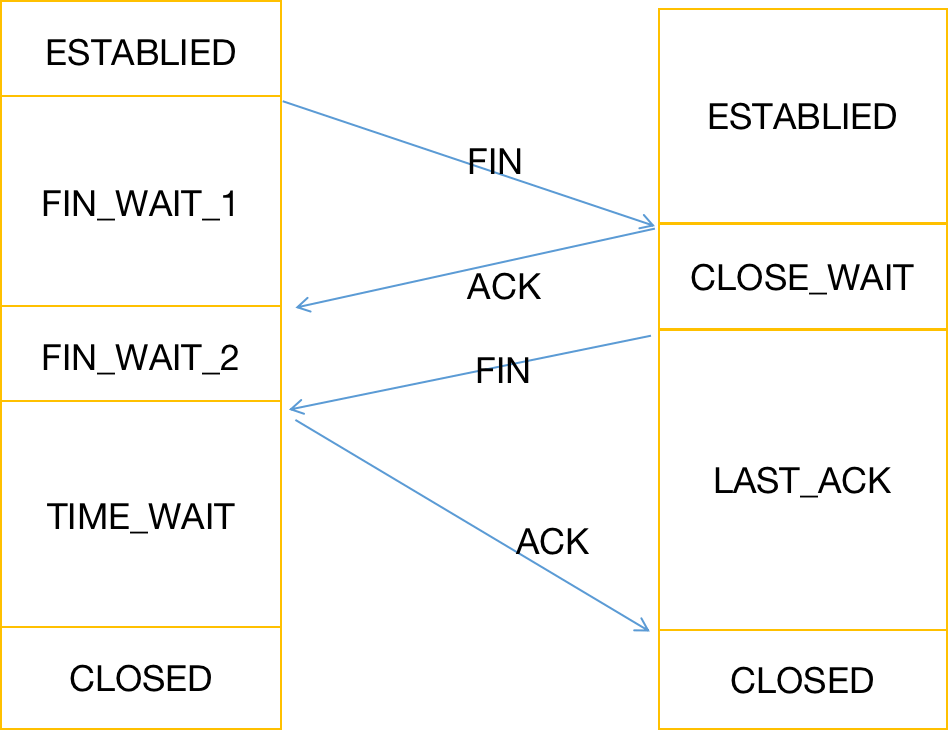
PHP server interacts with redis with a large number of close_ Wait analysis

ASP.NET-酒店管理系统
随机推荐
【学习笔记】dp 状态与转移
.\vmware-vdiskmanager.exe -k “c:\\xxxxx.vmdk”
uniapp实现点击加载更多
Cuiyusong, CTO of youzan: the core goal of Jarvis is to make products smarter and more reliable
R语言ggplot2可视化:gganimate包创建动态折线图动画(gif)、使用transition_reveal函数在动画中沿给定维度逐步显示数据、在折线移动方向添加数据点
The tutor put forward 20 pieces of advice to help graduate students successfully complete their studies: first, don't plan to take a vacation
Cadence background color setting
2022 northeast four provinces match VP record / supplementary questions
Incremental database backup - DB incr DB full
Qt+VTK+OCCT读取IGES/STEP模型
C语言日志库zlog基本使用
[vtk] source code interpretation of vtkpolydatatoimagestencil
Understand go language context in one article
R语言使用aggregate函数计算dataframe数据分组聚合的均值(sum)、不设置na.rm计算的结果、如果分组中包含缺失值NA则计算结果也为NA
CSRF
C language AES encryption and decryption
基于I2C协议的驱动开发
POI excel cell wrap
Yintai department store ignites the city's "night economy"
STL教程9-容器元素深拷贝和浅拷贝问题