当前位置:网站首页>On anchors in object detection
On anchors in object detection
2022-06-27 09:43:00 【Xiaobai learns vision】
Click on the above “ Xiaobai studies vision ”, Optional plus " Star standard " or “ Roof placement ”
Heavy dry goods , First time delivery Guide to Jishi
This paper uses a series of questions , It clearly explains the anchors The concept and significance of .
today , I will discuss an elegant concept introduced in the object detector —— Anchors, How it helps detect objects in an image , And they are compared with the traditional two-stage detector Anchor What's the difference? .
As usual , Let's look at some of the questions ,anchors Was introduced as a solution .
At the beginning of use anchors Before , Let's see how the two-stage object detector works , And how they actually promote the development of single-stage detectors .
Two stage object detector : The traditional two-stage object detector detects objects in the image in two stages :
1、 The first stage : The first stage traverses the input image and the output area where the object may appear ( It is called the suggested area or the area of interest ). This process can be done by external algorithms ( for example :selective search) Or a neural network .
2、 The second stage : The second stage is a neural network , It accepts these regions of interest , And classify it into a target object class .
For the sake of simplicity , I will introduce a famous two-stage detector —— Faster-RCNN. Both stages involve a neural network .
1、 The first neural network predicts where an object may appear ( Also known as objectness score ). It is basically a vision ( object ) And the classification of the background . This network is called the regional advice network , also called RPN.
2、 After extracting the regional recommendations , Crop the corresponding position in the input image , Send it to the next neural network for classification , Suppose there is N A target class . This network predicts what objects exist at that location .
step 2 It looks very simple , Because it can be reduced to image classification , Divide the target object into N One of the categories .
Let's delve into chapter 1 Step .
(a) How does this neural network predict the location of these targets ?
(b) If we can train neural network to classify foreground and background , So why not train it to predict all at once N What about a class ?
(a) The solution anchors,(b) The answer is yes , We can use a single network to perform N-way object detection , Such a network is known as a single-stage target detector . Single stage detector and Faster-RCNN The network in the first phase of is almost the same .
I said, SSD and RPN It's almost the same , Because they are conceptually the same , But the architecture is different .
How to detect objects in images by neural networks ?
Solution (1) —— Single target detection : Let's use the simplest case , Find a single object in an image . Given an image , The neural network must output the class of the object and the coordinates of its bounding box in the image . So the network must output 4+C A digital , among C It's the number of categories .
The input image can be directly passed through a set of convolution layers, and then the final convolution output can be converted into a 4+C Dimension vector , among , front 4 A number indicates the position of an object ( such as minx, miny, maxx, maxy), hinder C A number represents the score of category probability .
Solution (2) —— Multi target detection : This can be done by extending the above method to N Objects to achieve . therefore , The output of the network is not 4+C The number of , It is *N*(4+C)* Numbers .
Take a size of H x W x 3 Let it pass through a set of convolution layers to get a size of H x W x d Convolution of ,d Is the depth or number of channels .

Pass the image through ConvNet Get the output characteristic diagram
Consider the output convolution above volume. hypothesis volume The size is 7×7×512. Use N Size is 3 x 3 x 512 Filter for ,stride=2, padding=1, The resulting size is 4 x 4 x N Output volume.
We take this size as 4 x 4 x N Try to infer its meaning from the output of .
In the output characteristic diagram, there are 16 individual cells, We can say , Every cell There is a receiving domain ( Or feel the wild ), Corresponds to a point in the original image . Every one of these cell There are N A number related to it . As I pointed out earlier ,N It's the number of categories , We can say , Every cell It's all about feature map Information about the object appearing at the corresponding position in . In the same way , There is another parallel conv head , Among them is 4 Size is 3 x 3 x 512 Filter for , Apply to the same conv volume On , To get another size of 4 x 4 x 4 Output —— This corresponds to the offset of the bounding box .
Now we know how to use a neural network to predict multiple targets . But wait a minute , How do we calculate this output as 4x4xn Of cell What about the loss ?
Now let's drill down to the... Used by the output layer N Of the filters . from N Take out one of the filters , See how it passes on feature map Convolute to get the output .

3 x 3 The filter is in 7 x 7 Convolution on the characteristic graph of ,stride = 2
This 3x3 The filter can be used in 7x7 Move on the grid of 16 A different place , And make predictions ( As mentioned earlier ), This is very obvious .
We know , In the grid 16 individual cell Corresponds to a specific location in the layer before it . Look at the chart below . Output the first in the grid cell There is a size of 3x3 The reference frame of .
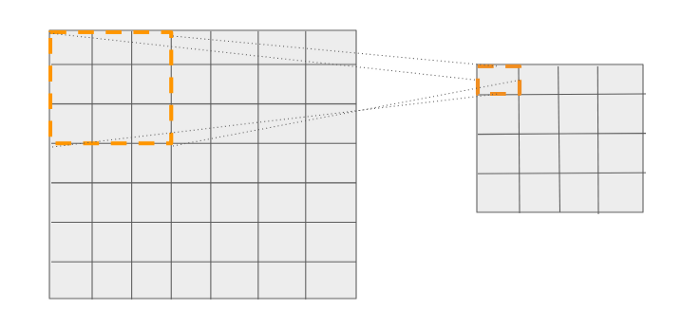
first cell Can be associated with a specific location in the input image , Predict from this location
Similarly , Each... In the output cell Can be associated with a specific location in the input image , Predict from this location .
So there is 16 There are four such reference positions ( The size is 3x3) —— Each position has its own coordinates relative to the input image . Now through these reference positions , We can achieve two goals :
1、 Classified loss : If N One of the objects fell here 16 Reference locations , I.e ground truth Of the bounding box IOU≥ A certain threshold , Then we know which one to match ground truth 了 .
2、 Return to loss : Why do we need this ? Suppose an object falls into one of the reference frames , We can simply output the actual coordinates of these reference positions relative to the input image . The reason is that objects don't have to be square . therefore , We are not naive enough to output a set of fixed frame coordinates , But by outputting 4 An offset value is used to adjust the default coordinates of these reference positions . Now we know ground truth box Coordinates and corresponding reference position coordinates , We can simply use L1/L2 Distance to calculate the regression loss .
It is different from the task of image classification in which only the output vector needs to be matched , Here we have 16 Reference positions to match . This means that the network can predict 16 An object . The number of objects to be predicted can be increased by predicting multiple feature map levels or by increasing the so-called reference positions on the feature map .
These reference locations are anchor boxes perhaps default boxes.
In the example above , only one anchor box , That is, only one prediction is made for each filter position .
Usually , stay feature map in , Every filter Positions can be predicted many times —— This means that there are as many references as there are predictions needed .
Suppose that each filter The location is 3 A reference .

Every filter There are three positions boxes —— One is 3x3( Orange ), One is 1x3( Blue ), The other is 3x1( green )
As we saw before , The output is anchor Box function , So if you refer to /anchor Quantity change of , The size of the output will also change . therefore , The network output is not 1 individual anchor Dot 4x4xN( and 4x4x4), But because of anchor Count =3, So the output is 4x4x(N*3).
Generally speaking , The output shape of a single-stage detector can be written as :
The shape of the classification header :HxWxNA
Return to the shape of the head :HxWx4A
In style ,A For the use of anchrs The number of .
A problem !
Every filter There are multiple positions anchors/ What is the meaning of the reference box ?
This enables the network to predict multiple targets of different sizes at each given location in the image .
This variant of a single-stage detector that uses a convolution layer at the end to obtain an output is called SSD, The variant that uses the full connection layer at the end to get the output is called YOLO.
I hope I have put anchor The concept of has become easy to understand .anchor It is always a difficult concept to grasp , There is still some information about anchor The unsolved problem of . I want to answer these questions in the following article . See you then :)
The good news !
Xiaobai learns visual knowledge about the planet
Open to the outside world

 download 1:OpenCV-Contrib Chinese version of extension module

 stay 「 Xiaobai studies vision 」 Official account back office reply : Extension module Chinese course , You can download the first copy of the whole network OpenCV Extension module tutorial Chinese version , Cover expansion module installation 、SFM Algorithm 、 Stereo vision 、 Target tracking 、 Biological vision 、 Super resolution processing and other more than 20 chapters .


 download 2:Python Visual combat project 52 speak
 stay 「 Xiaobai studies vision 」 Official account back office reply :Python Visual combat project , You can download, including image segmentation 、 Mask detection 、 Lane line detection 、 Vehicle count 、 Add Eyeliner 、 License plate recognition 、 Character recognition 、 Emotional tests 、 Text content extraction 、 Face recognition, etc 31 A visual combat project , Help fast school computer vision .


 download 3:OpenCV Actual project 20 speak
 stay 「 Xiaobai studies vision 」 Official account back office reply :OpenCV Actual project 20 speak , You can download the 20 Based on OpenCV Realization 20 A real project , Realization OpenCV Learn advanced .


 Communication group

Welcome to join the official account reader group to communicate with your colleagues , There are SLAM、 3 d visual 、 sensor 、 Autopilot 、 Computational photography 、 testing 、 Division 、 distinguish 、 Medical imaging 、GAN、 Wechat groups such as algorithm competition ( It will be subdivided gradually in the future ), Please scan the following micro signal clustering , remarks :” nickname + School / company + Research direction “, for example :” Zhang San + Shanghai Jiaotong University + Vision SLAM“. Please note... According to the format , Otherwise, it will not pass . After successful addition, they will be invited to relevant wechat groups according to the research direction . Please do not send ads in the group , Or you'll be invited out , Thanks for your understanding ~边栏推荐
- Pakistani security forces killed 7 terrorists in anti-terrorism operation
- Scientists develop two new methods to provide stronger security protection for intelligent devices
- ucore lab3
- E+H二次表维修PH变送器二次显示仪修理CPM253-MR0005
- Privacy computing fat offline prediction
- Quartz (timer)
- 前馈-反馈控制系统设计(过程控制课程设计matlab/simulink)
- MYSQL精通-01 增删改
- 高等数学第七章微分方程
- 我大抵是卷上瘾了,横竖睡不着!竟让一个Bug,搞我两次!
猜你喜欢

Improving efficiency or increasing costs, how should developers understand pair programming?

高等数学第七章微分方程

【OpenCV 例程200篇】211. 绘制垂直矩形

Understand neural network structure and optimization methods

初步认识pytorch
Win10 add right-click menu for any file

Stop using system Currenttimemillis() takes too long to count. It's too low. Stopwatch is easy to use!

leetcode:522. 最长特殊序列 II【贪心 + 子序列判断】

详细记录YOLACT实例分割ncnn实现

TDengine 邀请函:做用技术改变世界的超级英雄,成为 TD Hero
随机推荐
详细记录YOLACT实例分割ncnn实现
Reading and writing Apache poi
【OpenCV 例程200篇】211. 绘制垂直矩形
Take you to play with the camera module
[200 opencv routines] 212 Draw a slanted rectangle
Apache POI的读写
Freemarker
[diffusion model]
更改pip镜像源
通俗易懂理解朴素贝叶斯分类的拉普拉斯平滑
Shortcut key bug, reproducible (it seems that bug is the required function [funny.Gif])
Bluetooth health management device based on stm32
【报名】基础架构设计:从架构热点问题到行业变迁 | TF63
ucore lab4
R语言使用econocharts包创建微观经济或宏观经济图、demand函数可视化需求曲线(demand curve)、自定义配置demand函数的参数丰富可视化效果
Semi-supervised Learning入门学习——Π-Model、Temporal Ensembling、Mean Teacher简介
[registration] infrastructure design: from architecture hot issues to industry changes | tf63
unity--newtonsoft.json解析
Introduction to websocket protocol
SVN版本控制器的安装及使用方法