当前位置:网站首页>GSE104154_ scRNA-seq_ fibrotic MC_ bleomycin/normalized AM3
GSE104154_ scRNA-seq_ fibrotic MC_ bleomycin/normalized AM3
2022-07-02 03:06:00 【youngleeyoung】
Here is the reference
getwd()
path="G:/silicosis/geo/GSE104154_scRNA-seq_fibrotic MC_bleomycin/normalized" # Space transcriptome
dir.create(path)
setwd(path)
getwd()
list.files()


raw_counts=read.csv("G:\\silicosis\\geo\\GSE104154_scRNA-seq_fibrotic MC_bleomycin\\GSE104154_d0_d21_sma_tm_Expr_nor\\GSE104154_d0_d21_sma_tm_Expr_norm.csv")

head(raw_counts)[1:4,1:4]
counts=raw_counts[,-1]
head(counts)[1:4,1:4]
rownames(counts)=counts$symbol

head(raw_counts)[1:4,1:4]
counts=raw_counts[,-2]
head(counts)[1:4,1:4]
rownames(counts)=counts$id
counts=counts[,-1]
head(counts)[1:4,1:4]

library(Seurat)
#https://zhuanlan.zhihu.com/p/385206713
rawdata=CreateSeuratObject(counts = counts,project = "blem",assay = "RNA")

ids=raw_counts[,1:2]
head(ids)
colnames(ids)= c('ENSEMBL','SYMBOL')
head(ids)
dim(ids) # [1] 16428
ids=na.omit(ids)
dim(ids) # [1] 15504
length(unique(ids$SYMBOL)) # [1] 15494
#  The relationship here is super chaotic , Neither of them is one-on-one
#  Whatever is chaotic ID Just delete them all
ids=ids[!duplicated(ids$SYMBOL),]
ids=ids[!duplicated(ids$ENSEMBL),]
dim(ids)
pos=match(ids$ENSEMBL,rownames(rawdata) )
hp_sce=rawdata[pos,]
hp_sce
#rownames(hp_sce) = ids$SYMBOL
# RenameGenesSeurat  -----------------------------------------------
# Create a function   Change the name
RenameGenesSeurat <- function(obj ,
                              newnames ) {

  # Replace gene names in different slots of a Seurat object. Run this before integration. Run this before integration.
  # It only changes obj@assays$RNA@counts, @data and @scale.data.
  print("Run this before integration. It only changes [email protected][email protected], @data and @scale.data.")
  RNA <- obj@assays$RNA

  if (nrow(RNA) == length(newnames)) {

    if (length(RNA@counts)) RNA@counts@Dimnames[[1]]            <- newnames
    if (length(RNA@data)) RNA@data@Dimnames[[1]]                <- newnames
    if (length(RNA@scale.data)) RNA@scale.data@Dimnames[[1]]    <- newnames
  } else {
    "Unequal gene sets: nrow(RNA) != nrow(newnames)"}
  obj@assays$RNA <- RNA
  return(obj)
}

hp_sce=RenameGenesSeurat(obj = hp_sce,
                         newnames = ids$SYMBOL)
getwd()
#save(hp_sce,file = 'first_sce.Rdata')


hp_sce
rownames(hp_sce)[grepl('^mt-',rownames(hp_sce))]
rownames(hp_sce)[grepl('^Rp[sl]',rownames(hp_sce))]

hp_sce[["percent.mt"]] <- PercentageFeatureSet(hp_sce, pattern = "^mt-")
fivenum(hp_sce[["percent.mt"]][,1])
rb.genes <- rownames(hp_sce)[grep("^Rp[sl]",rownames(hp_sce))]
C<-GetAssayData(object = hp_sce, slot = "counts")
percent.ribo <- Matrix::colSums(C[rb.genes,])/Matrix::colSums(C)*100
hp_sce <- AddMetaData(hp_sce, percent.ribo, col.name = "percent.ribo")

getwd()


plot1 <- FeatureScatter(hp_sce, feature1 = "nCount_RNA", feature2 = "percent.mt")
plot2 <- FeatureScatter(hp_sce, feature1 = "nCount_RNA", feature2 = "nFeature_RNA")
CombinePlots(plots = list(plot1, plot2))

VlnPlot(hp_sce, features = c("percent.ribo", "percent.mt"), ncol = 2)
VlnPlot(hp_sce, features = c("nFeature_RNA", "nCount_RNA"), ncol = 2)
VlnPlot(hp_sce, features = c("percent.ribo", "nCount_RNA"), ncol = 2)
hp_sce

hp_sce1 <- subset(hp_sce, subset = nFeature_RNA > 200 & nCount_RNA > 1000 & percent.mt < 20)
hp_sce1


sce=hp_sce1
sce
colnames(sce)
grep(colnames(sce),pattern = ".1")
grep(colnames(sce),pattern = ".2")
sce@meta.data$stim <-c(rep("PBS", length(grep("1$", sce@assays$RNA@counts@Dimnames[[2]]))),
                       rep("PBS", length(grep("2$", sce@assays$RNA@counts@Dimnames[[2]]))),
                       rep("PBS", length(grep("3$", sce@assays$RNA@counts@Dimnames[[2]]))),
                       rep("Bleomycin", length(grep("4$", sce@assays$RNA@counts@Dimnames[[2]]))),
                       rep("Bleomycin", length(grep("5$", sce@assays$RNA@counts@Dimnames[[2]]))),
                       rep("Bleomycin", length(grep("6$", sce@assays$RNA@counts@Dimnames[[2]])))
) ## 8186,7947;

table(sce$stim)

library(dplyr)
sce[["RNA"]]@meta.features <- data.frame(row.names = rownames(sce[["RNA"]]))

All = sce%>%Seurat::NormalizeData(verbose = FALSE) %>%
  FindVariableFeatures(selection.method = "vst", nfeatures = 2000) %>%
  ScaleData(verbose = FALSE)
All = RunPCA(All, npcs = 50, verbose = FALSE)

pdf("2_ElbowPlot.pdf")
ElbowPlot(All, ndims = 50)
dev.off()

library(cowplot)
#All@meta.data$stim <- c(rep("case", length(grep("1$", All@assays$RNA@counts@Dimnames[[2]]))), rep("ctrl", length(grep("2$", All@assays$RNA@counts@Dimnames[[2]])))) ## 8186,7947;
pdf("2_pre_harmony_harmony_plot.pdf")
options(repr.plot.height = 5, repr.plot.width = 12)
p1 <- DimPlot(object = All, reduction = "pca", pt.size = .1, group.by = "stim")
p2 <- VlnPlot(object = All, features = "PC_1", group.by = "stim", pt.size = .1)
plot_grid(p1, p2)
dev.off()
##########################run harmony

All <- All %>% RunHarmony("stim", plot_convergence = TRUE)
harmony_embeddings <- Embeddings(All, 'harmony')


pdf("2_after_harmony_harmony_plot.pdf")
options(repr.plot.height = 5, repr.plot.width = 12)
p3 <- DimPlot(object = All, reduction = "harmony", pt.size = .1, group.by = "stim")
p4 <- VlnPlot(object = All, features = "harmony_1", group.by = "stim", pt.size = .1)
plot_grid(p3, p4)
dev.off()
#############cluster
#library(harmony)
All <- All %>%
  RunUMAP(reduction = "harmony", dims = 1:30) %>%
  RunTSNE(reduction = "harmony", dims = 1:30) %>%
  FindNeighbors(reduction = "harmony", dims = 1:30)
All<-All%>% FindClusters(resolution = 3) %>% identity()


options(repr.plot.height = 4, repr.plot.width = 10)
pdf("3_after_harmony_umap_two_group.pdf")
DimPlot(All, reduction = "umap", group.by = "stim", pt.size = .1)
dev.off()

pdf("3_after_harmony_cluster_UMAP.pdf")
DimPlot(All, reduction = "umap", label = TRUE, pt.size = .1)
dev.off()

pdf("3_umap_samples_split.pdf")
DimPlot(All, reduction = "umap", pt.size = .1, split.by = "stim", label = T)
dev.off()

pdf("3_after_harmony_tsne_two_group.pdf")
DimPlot(All, reduction = "tsne", group.by = "stim", pt.size = .1)
dev.off()

pdf("3_after_harmony_cluster_tSNE.pdf")
DimPlot(All, reduction = "tsne", label = TRUE, pt.size = .1)
dev.off()

pdf("3_tSNE_samples_split.pdf")
DimPlot(All, reduction = "tsne", pt.size = .1, split.by = "stim", label = T)
dev.off()
getwd()
#save(All,file ="G:/silicosis/geo/GSE104154_scRNA-seq_fibrotic MC_bleomycin/normalized/All_normolized_for_clustering.rds" )
load("G:/silicosis/geo/GSE104154_scRNA-seq_fibrotic MC_bleomycin/normalized/All_normolized_for_clustering.rds")


DimPlot(All,label = T,reduction = 'tsne')
getwd()
Disease.markers <- FindAllMarkers(All, min.pct = 0.35, logfc.threshold = 0.35, only.pos = T)
openxlsx::write.xlsx(Disease.markers,file ="G:/silicosis/geo/GSE104154_scRNA-seq_fibrotic MC_bleomycin/normalized/markers_normolized_for_all.xlsx" )

top20markers <- Disease.markers %>% group_by(cluster) %>% top_n(n = 20, wt = avg_logFC)
#write.table(top20markers, "top20_markers.txt", sep = "\t", quote = F, col.names = T, row.names = F)
#save(All, file = "sepsis_harmony.rds")


FeaturePlot(All,features = 'Cd68',reduction = 'tsne')
FeaturePlot(All,features = 'Mrc1',reduction = 'tsne')
FeaturePlot(All,features = 'Mrc1',reduction = 'umap')
FeaturePlot(All,features = 'C1qa',reduction = 'tsne')
FeaturePlot(All,features = 'C1qb',reduction = 'tsne')
FeaturePlot(All,features = 'C1qc',reduction = 'tsne')
FeaturePlot(All,features = 'Spp1',reduction = 'tsne')
FeaturePlot(All,features = 'Ear2',reduction = 'tsne')
FeaturePlot(All,features = 'Ear1',reduction = 'tsne')
FeaturePlot(All,features = 'Mmp12',reduction = 'tsne')
FeaturePlot(All,features = 'Mmp14',reduction = 'tsne')
FeaturePlot(All,features = 'Gpnmb',reduction = 'tsne')

subset_data=subset(All,idents = c('0','17','18','22','29','39'))
DimPlot(subset_data,label = T,reduction = 'tsne')
subset_data$orig_cluster_from_all=Idents(subset_data)

subset_data=subset_data %>% RunHarmony("stim", plot_convergence = TRUE)
harmony_embeddings <- Embeddings(All, 'harmony')
dim(subset_data)
subset_data <- subset_data %>%
  RunUMAP(reduction = "harmony", dims = 1:22) %>%
  RunTSNE(reduction = "harmony", dims = 1:22) %>%
  FindNeighbors(reduction = "harmony", dims = 1:22)
subset_data<-subset_data%>% FindClusters() %>% identity()


DimPlot(subset_data,reduction = 'tsne')
DimPlot(subset_data)
DimPlot(subset_data,reduction = 'tsne',split.by = 'stim')

#clustree Determine how many cluster
for (res in seq(0.2,1,0.1)) {

  subset_data=FindClusters(subset_data,graph.name = 'RNA_snn',resolution = res,algorithm = 1)
}
apply(subset_data@meta.data[,grep('RNA_snn_res',colnames(subset_data@meta.data))], 2, table)

library(clustree)
p5_tree=clustree::clustree(subset_data@meta.data,prefix='RNA_snn_res.')
p5_tree

# Scale
ggplot(subset_data@meta.data, aes(x=RNA_snn_res.0.2, fill=stim)) + geom_bar(position = "fill")
ggplot(subset_data@meta.data, aes(x=orig_cluster_from_all, fill=stim)) + geom_bar(position = "fill")


Idents(subset_data)=subset_data$orig_cluster_from_all
markers=FindAllMarkers(subset_data,logfc.threshold = 0.5,only.pos = T,min.pct = 0.3)
DimPlot(subset_data,label = T,reduction = 'tsne')


subset_data=subset(All,idents = c('0','18','22','29'))
DimPlot(subset_data,label = T,reduction = 'tsne')
markers=FindAllMarkers(subset_data,logfc.threshold = 0.5,only.pos = T,min.pct = 0.3)
DimPlot(subset_data,label = T,reduction = 'tsne')

subset_data$orig_cluster_from_all=Idents(subset_data)
ggplot(subset_data@meta.data, aes(x=orig_cluster_from_all, fill=stim)) + geom_bar(position = "fill")

subset_data=RenameIdents(subset_data,'0'='AM1',
                         '22'='AM2','18'='AM3',
                         '29'='IM')

DimPlot(subset_data,label = T,reduction = 'tsne')
# Scale
ggplot(subset_data@meta.data, aes(x=Idents(subset_data), fill=stim)) + geom_bar(position = "fill")


DimPlot(subset_data,label = T,reduction = 'tsne')
DimPlot(subset_data,group.by = 'stim')
getwd()
#save(subset_data,file = "G:/silicosis/geo/GSE104154_scRNA-seq_fibrotic MC_bleomycin/normalized/IM_AMs.rds")
load("G:/silicosis/geo/GSE104154_scRNA-seq_fibrotic MC_bleomycin/normalized/IM_AMs.rds")


subset_data=subset(subset_data,idents = c('AM1','AM2','AM3'))
DimPlot(subset_data,label = T,reduction = 'tsne')
# Scale
ggplot(subset_data@meta.data, aes(x=Idents(subset_data), fill=stim)) + geom_bar(position = "fill")


DimPlot(subset_data,label = T,reduction = 'tsne')
DimPlot(subset_data,group.by = 'stim')
getwd()

subset_data$orig_cluster_from_IM_AMs=Idents(subset_data)

subset_data=subset_data %>% RunHarmony("stim", plot_convergence = TRUE)
harmony_embeddings <- Embeddings(All, 'harmony')
dim(subset_data)
subset_data <- subset_data %>%
  RunUMAP(reduction = "harmony", dims = 1:22) %>%
  RunTSNE(reduction = "harmony", dims = 1:22) %>%
  FindNeighbors(reduction = "harmony", dims = 1:22)
subset_data<-subset_data%>% FindClusters() %>% identity()


DimPlot(subset_data,reduction = 'tsne',label = T)
DimPlot(subset_data,label = T,label.size = 5)
DimPlot(subset_data,reduction = 'tsne',split.by = 'stim')
DimPlot(subset_data,group.by = 'stim')
DimPlot(subset_data,split.by = 'stim',label = T,label.size = 5)

# Scale
getwd()
ggplot(subset_data@meta.data, aes(x=Idents(subset_data), fill=stim)) + geom_bar(position = "fill")
markers=FindAllMarkers(subset_data,logfc.threshold = 0.5,only.pos = T,min.pct = 0.3)
openxlsx::write.xlsx(markers,file ="G:/silicosis/geo/GSE104154_scRNA-seq_fibrotic MC_bleomycin/normalized/makers_for_AM1_AM2_AM3.xlsx" )
Idents(subset_data)=subset_data$RNA_snn_res.0.8

subset_data=RenameIdents(subset_data,'1'='AM1','4'='AM1',
                         '0'='AM1',
                         '2'='AM2',
                         '3'='AM3','5'='AM3')

getwd()
#save(subset_data,file = "G:/silicosis/geo/GSE104154_scRNA-seq_fibrotic MC_bleomycin/normalized/only_AMs.rds")
load("G:/silicosis/geo/GSE104154_scRNA-seq_fibrotic MC_bleomycin/normalized/only_AMs.rds")
边栏推荐
- Render header usage of El table
- How to create an instance of the control defined in SAP ui5 XML view at runtime?
- 浅谈线程池相关配置
- Ten minutes will take you in-depth understanding of multithreading - multithreaded teamwork: synchronous control
- [JS reverse series] analysis of a customs publicity platform
- MVVM and MVC
- Leetcode question brushing (10) - sequential question brushing 46 to 50
- A list of job levels and salaries in common Internet companies. Those who have conditions must enter big factories. The salary is really high
- [staff] restore mark (Introduction to the use of restore mark | example analysis of Metaphone mark and restore mark)
- Realize the code scanning function of a custom layout
猜你喜欢
JS introduction < 1 >

Special symbols in SAP ui5 data binding syntax, and detailed explanation of absolute binding and relative binding concepts

命名块 verilog

PHP notes - use Smarty to set public pages (include, if, else, variable settings)

MMSegmentation系列之训练与推理自己的数据集(三)

2022-2028 global wood vacuum coating machine industry research and trend analysis report

Jvm-01 (phased learning)
![寻找重复数[抽象二分/快慢指针/二进制枚举]](/img/9b/3c001c3b86ca3f8622daa7f7687cdb.png)
寻找重复数[抽象二分/快慢指针/二进制枚举]
![[JSON] gson use and step on the pit](/img/86/6ee2971715e0d29008a4b7b1a7aa45.jpg)
[JSON] gson use and step on the pit
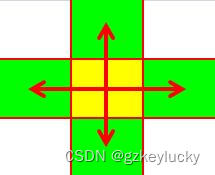
连通块模板及变式(共4题)
随机推荐
Mmsegmentation series training and reasoning their own data set (3)
使用开源项目【Banner】实现轮播图效果(带小圆点)
The video number will not be allowed to be put on the shelves of "0 yuan goods" in the live broadcasting room?
JS introduction < 1 >
GB/T-2423. XX environmental test documents, including the latest documents
QT uses sqllite
竞争与冒险 毛刺
Soul app released the annual report on generation Z behavior: nearly 20% of young people love shopping in the vegetable market
表单自定义校验规则
Share the basic knowledge of a common Hongmeng application
Stack - es - official documents - filter search results
跟着CTF-wiki学pwn——ret2shellcode
結婚後
LeetCode刷题(十)——顺序刷题46至50
结婚后
2022-2028 global aluminum beverage can coating industry research and trend analysis report
Find duplicates [Abstract binary / fast and slow pointer / binary enumeration]
Formatting logic of SAP ui5 currency amount display
Rotating frame target detection mmrotate v0.3.1 learning model
C shallow copy and deep copy