当前位置:网站首页>深度学习100例 —— 卷积神经网络(CNN)实现mnist手写数字识别
深度学习100例 —— 卷积神经网络(CNN)实现mnist手写数字识别
2022-08-02 10:28:00 【Ding Jiaxiong】
活动地址:CSDN21天学习挑战赛
深度学习100例 —— 卷积神经网络(CNN)实现mnist手写数字识别
K老师用的tensorflow框架,啊这,新一个虚拟环境吧。
Python:3.7
编译器:jupyter notebook
深度学习框架:TensorFlow2.7.0

1. 前期准备工作
1.1 设置GPU
这里最后我还是选择了用AutoDL的算力,不舍得在自己电脑上跑。
import tensorflow as tf
gpus = tf.config.list_physical_devices("GPU") # tf.config.list_physical_devices# 获得当前主机上某种特定运算设备类型(如 GPU 或 CPU )的列表

if gpus:
    gpu0 = gpus[0] #如果有多个GPU,仅使用第0个GPU
    tf.config.experimental.set_memory_growth(gpu0, True) #设置GPU显存用量按需使用
    tf.config.set_visible_devices([gpu0],"GPU") # 设置可见设备列表

1.2 导入数据
import tensorflow as tf
from tensorflow.keras import datasets, layers, models
import matplotlib.pyplot as plt
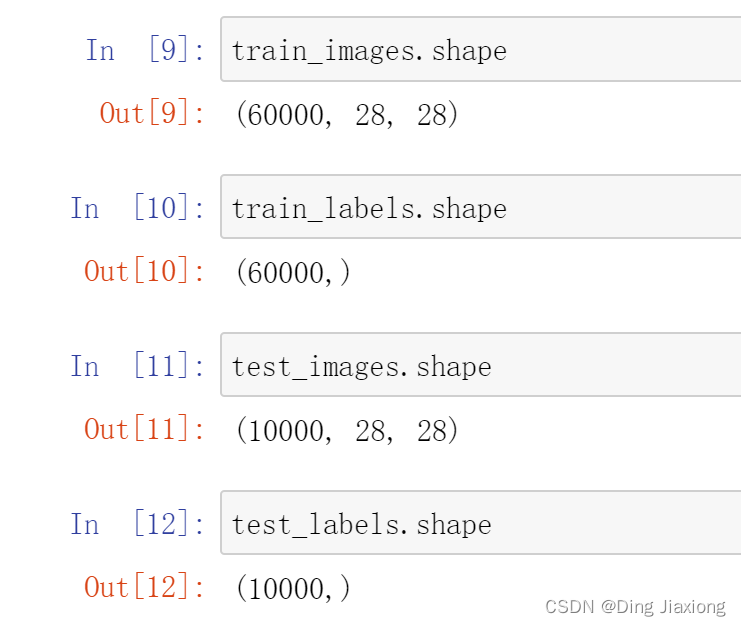
(train_images, train_labels), (test_images, test_labels) = datasets.mnist.load_data()
MNIST手写数字数据集来源于是美国国家标准与技术研究所,是著名的公开数据集之一。数据集中的数字图片是由250个不同职业的人纯手写绘制。
MNIST手写数字数据集中包含了70000张图片,其中60000张为训练数据,10000张为测试数据,70000张图片均是28*28
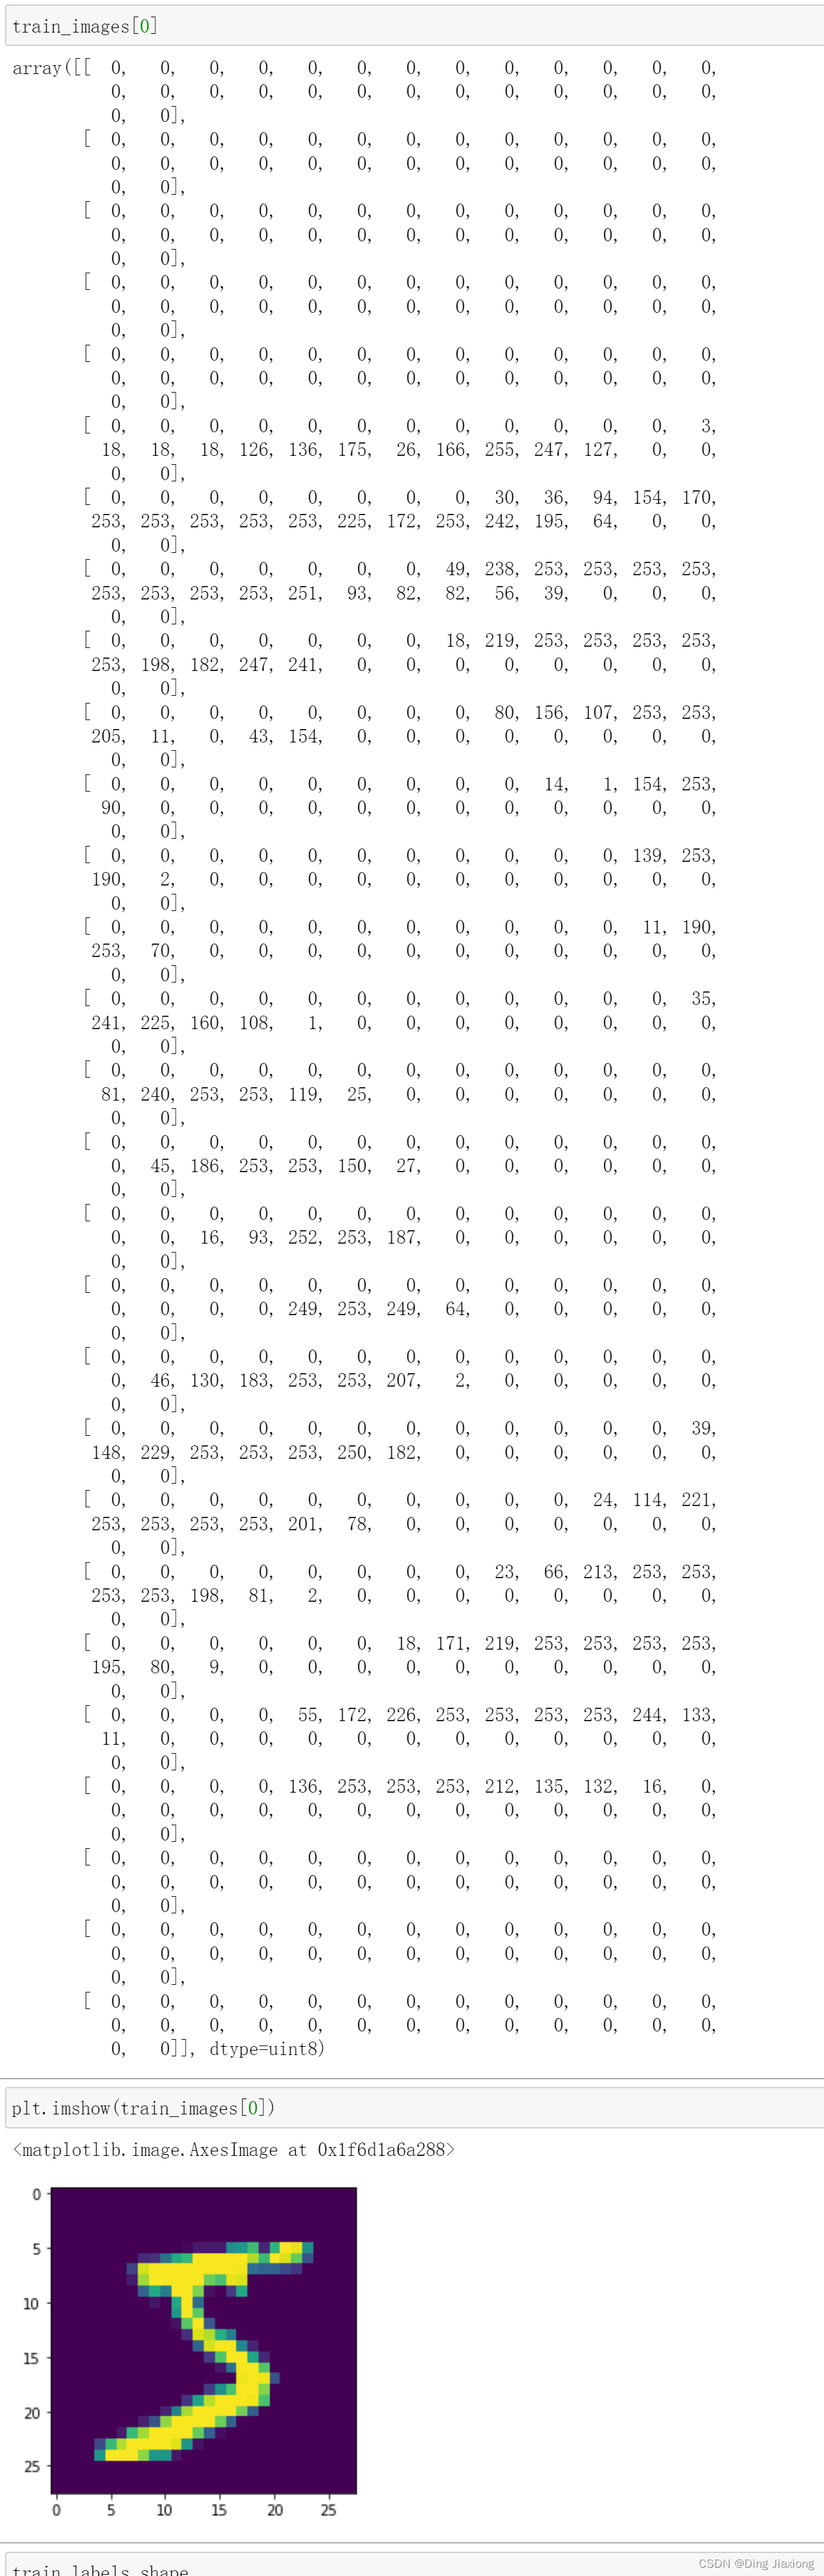
28 x 28 像素转换为向量,得到长度为28 x 28 = 784 的向量,
1.3 数据归一化处理
作用:
- 使不同量纲的特征处于同一数值量级,减少方差大的特征的影响,使模型更准确。
- 加快学习算法的收敛速度。
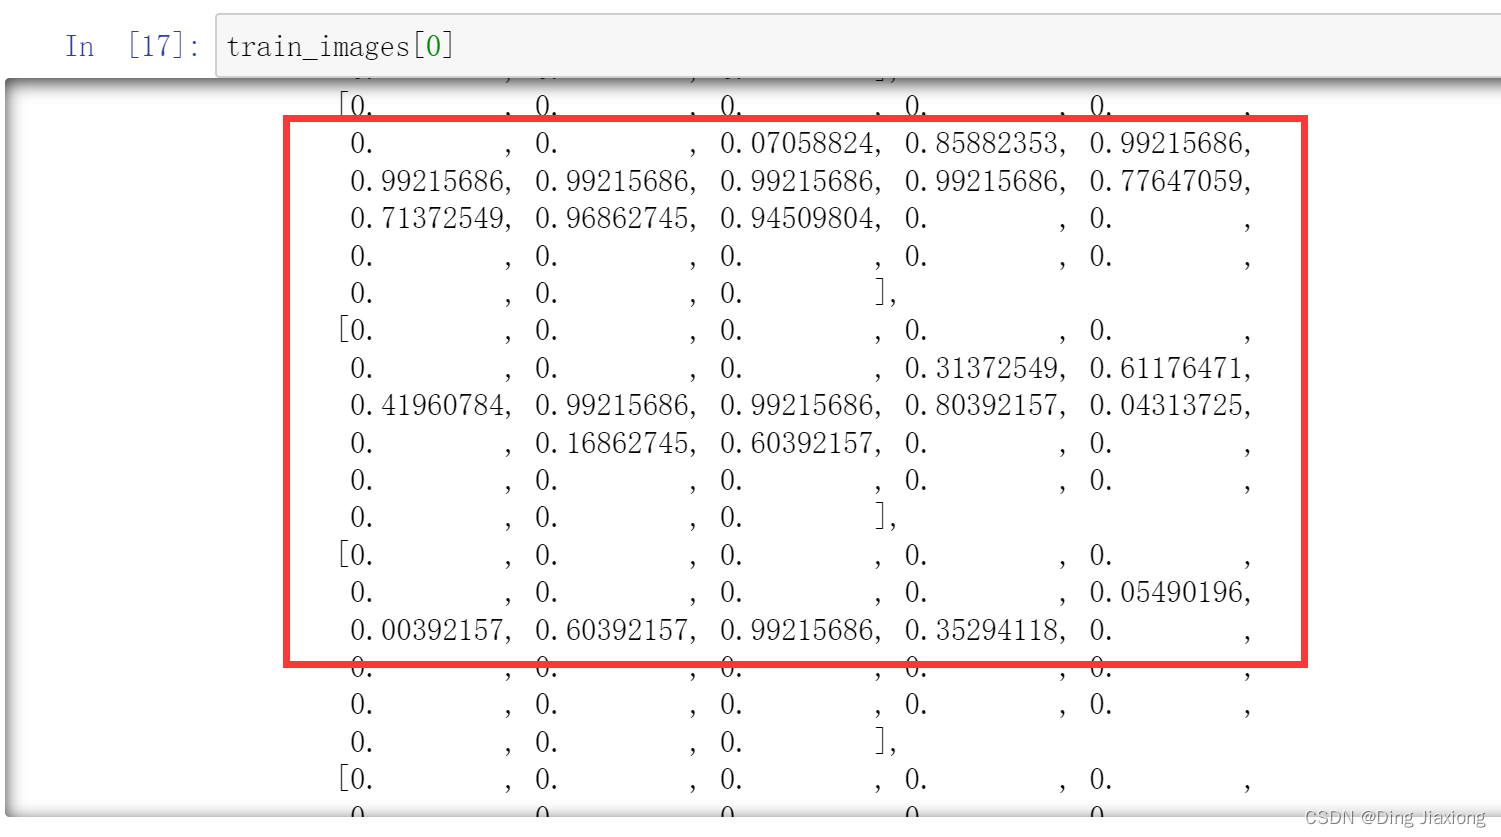
归一化:把数变为(0 , 1)之间的小数;缩放仅仅跟最大值、最小值的差别有关。
# 将像素的值标准化至0到1的区间内。
train_images, test_images = train_images / 255.0, test_images / 255.0
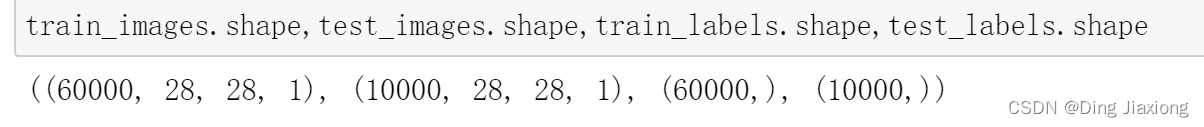
train_images.shape,test_images.shape,train_labels.shape,test_labels.shape

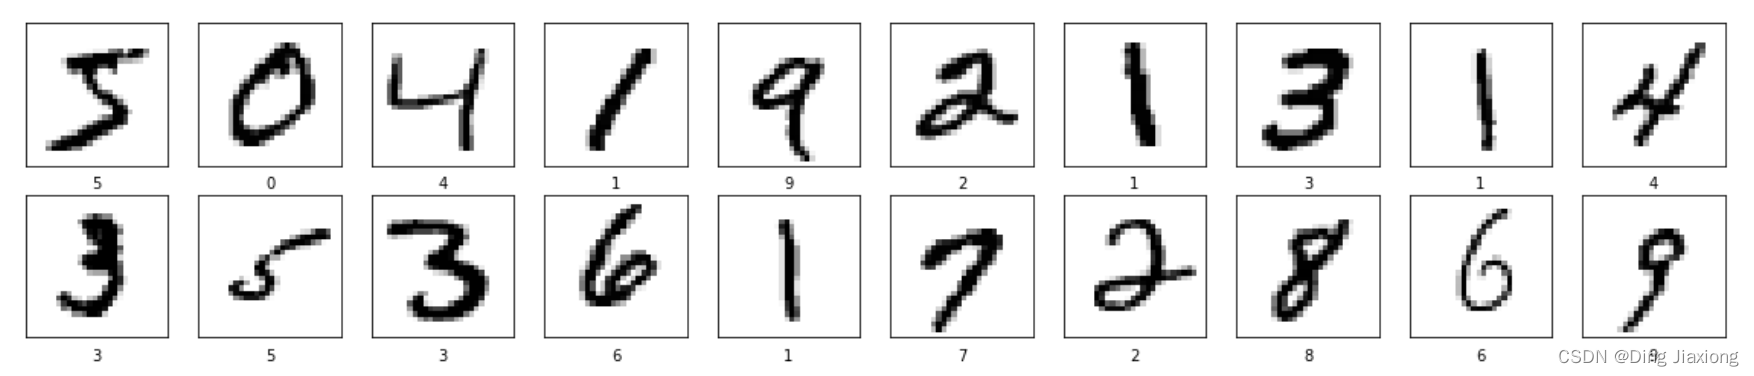
1.4 可视化图片
plt.figure(figsize=(20,10)) # 设置绘图窗口大小
for i in range(20):
    plt.subplot(5,10,i+1) # 整个figure被分为5行10列,从左到右,从上到下编号为1,2,3...
    plt.xticks([]) # 绘制x轴标签的方向
    plt.yticks([]) # 绘制y轴标签的方向
    plt.grid(False) # 关闭网格线显示
    plt.imshow(train_images[i], cmap=plt.cm.binary) # cmap=plt.cm.binary → 显示黑白图像,展示0-19的图像
    plt.xlabel(train_labels[i]) # 设置x轴标签为对应的标签值
plt.show()
1.5 调整图片格式
#调整数据到我们需要的格式
train_images = train_images.reshape((60000, 28, 28, 1))
test_images = test_images.reshape((10000, 28, 28, 1))

train_images.shape,test_images.shape,train_labels.shape,test_labels.shape
→ 数据维度转换,增加通道维度
2. 构建CNN网络模型
2.1 构建网络
model = models.Sequential(
    [
        layers.Conv2D(32 , (3 , 3) , activation = 'relu', input_shape = [28 , 28 , 1]), # 卷积层1,卷积核3 x 3
        layers.MaxPooling2D((2, 2)), # 池化层1 , 2 x 2 采样
        layers.Conv2D(64 , (3 , 3) , activation = 'relu'), # 卷积层2 , 卷积核3 x 3
        layers.MaxPooling2D((2, 2)), # 池化层2, 2 x 2 采样

        layers.Flatten(), # Flatten层,连接卷积层与全连接层
        layers.Dense(64 , activation = 'relu'), # 全连接层,特征进一步提取
        layers.Dense(10) # 输出层,输出结果
    ]
)
model.summary()
网络结构

2.2 模型结构说明:

各层的作用:
- 输入层:将数据输入到训练网络
- 卷积层:使用卷积核提取图片的特征
- 池化层:进行下采样,用更高层的抽象表示图像特征
- Flatten层:将多维的输入一维化,常用在卷积层到全连接层的过渡
- 全连接层:特征提取器
- 输出层:输出结果
3. 编译模型
model.compile(optimizer='adam',
         loss=tf.keras.losses.SparseCategoricalCrossentropy(from_logits=True),
              metrics=['accuracy'])
compile()方法用于设置训练时,使用的优化器optimizer、损失函数loss、准确率评测标准metrics
SparseCategoricalCrossentropy → 交叉熵损失函数,当from_logits参数为True时,会使用softmax将预测y转换为概率。
4. 训练模型
history = model.fit(train_images, train_labels, epochs=10,
                    validation_data=(test_images, test_labels))
epoch : 迭代次数,全部样本将会被训练循环10次
validation_data:指定验证数据。
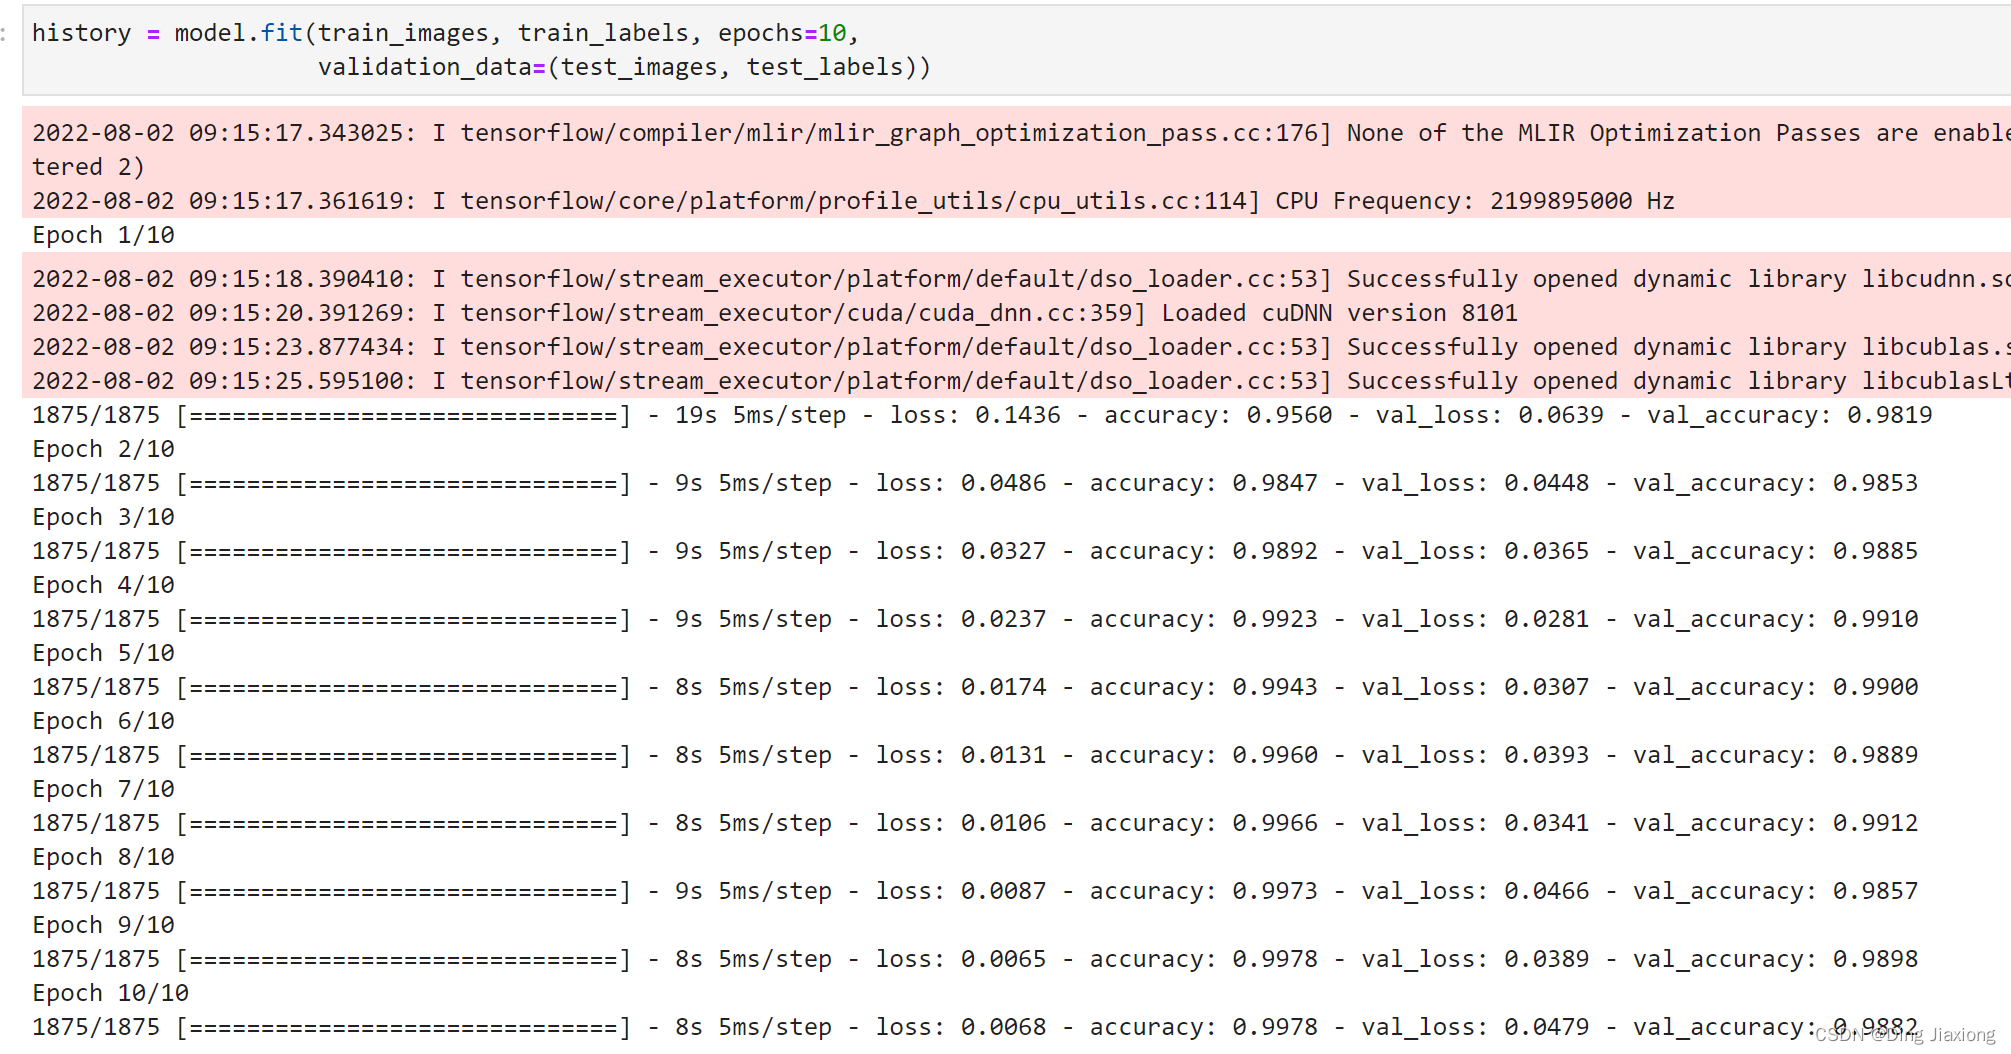
编译模型设置的准确率,这里即输出准确率
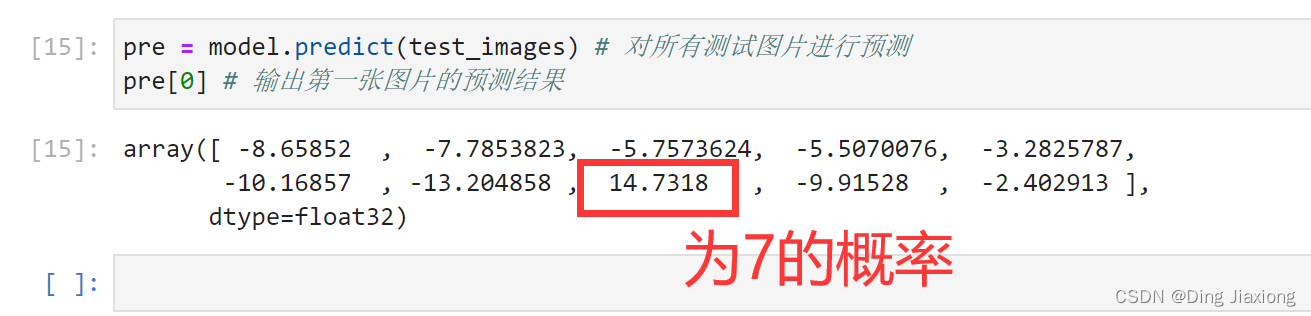
5. 预测
看看测试集中的0号图片
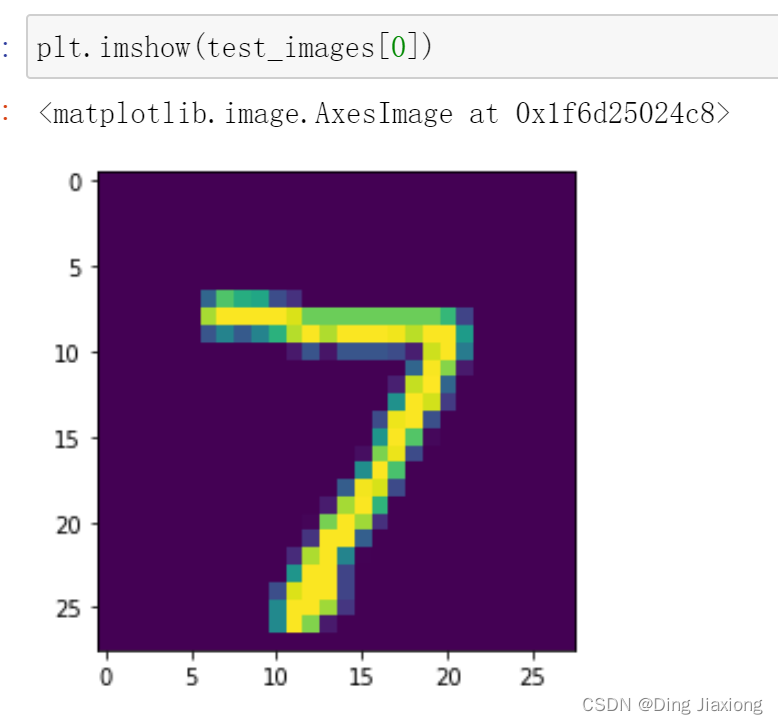
OK,是个7
使用训练好的模型进行预测:
边栏推荐
- 太帅了!我用炫酷大屏展示爬虫数据!
- Long battery life or safer?Seal and dark blue SL03 comparison shopping guide
- 软件测试的基本理论知识(软件测试面试基础知识)
- Unknown content monitoring
- Verilog's random number system task----$random
- games202:三,实时环境光照IBL + PRT
- 一体化在线政务服务平台,小程序容器技术加速建设步伐
- How to choose a truly "easy-to-use, high-performance" remote control software
- Geoffery Hinton:深度学习的下一个大事件
- 如何安装dosbox(pycharm详细安装教程)
猜你喜欢

Long battery life or safer?Seal and dark blue SL03 comparison shopping guide

周鸿祎称微软抄袭 360 安全模式后发文否认;英特尔CEO基辛格回应市值被AMD超越:股价下跌是咎由自取|极客头条...
阿里云数据存储生态计划发布,助力伙伴数据创新

全新荣威RX5,27寸大屏吸引人,安全、舒适一个不落
周杰伦新歌发布,爬取《Mojito》MV弹幕,看看粉丝们都说的些啥!
后管实现面包屑功能

How to choose a truly "easy-to-use, high-performance" remote control software

利用二维数据学习纹理三维网格生成(CVPR 2020)
Why use BGP?

Verilog's random number system task----$random
随机推荐
MySql模糊查询大全
LayaBox---TypeScript---Module Analysis
yolov7创新点
行为型模式-策略模式
The heavyweights are coming!Spoilers for the highlights of the Alibaba Cloud Life Science and Intelligent Computing Summit
开源一夏 | GO语言框架中如何快速集成日志模块
org.apache.ibatis.binding.BindingException Invalidbound statement (not found)的解决方案和造成原因分析(超详细)
Oracle查询提示 ORA-00933 SQL command not properly ended 原因排查
有奖征集|TaoCloud&宝德联合举办全闪POC!
Why use BGP?
MySql tens of millions of paging optimization, fast insertion method of tens of millions of data
如何选择一块真正“好用的、性能高”的远程控制软件
从零开始Blazor Server(5)--权限验证
如何搭建威纶通触摸屏与S7-200smart之间无线PPI通信?
win10打印服务无法启动(运行时错误automation)
DVWA 通关记录 2 - 命令注入 Command Injection
学习笔记-支付宝支付
[Science of Terminology] For those difficult words about the integrated workbench, read this article to understand in seconds!
重磅大咖来袭!阿里云生命科学与智能计算峰会精彩内容剧透
R language ggplot2 visualization: use the ggtexttable function of the ggpubr package to visualize tabular data (directly draw tabular graphs or add tabular data to images), use tbody_add_border to add