当前位置:网站首页>Load test practice of pingcode performance test
Load test practice of pingcode performance test
2022-07-04 17:13:00 【InfoQ】
What is performance testing
The type of performance test
- The load test: Usually, the purpose of load testing is to understand the behavior of the system under a specific expected load . This load can be the expected number of concurrent users on the application , The application executes a specific number of transactions within a set duration . This test will give the response time of all important business critical transactions . The database will also be monitored during the test 、 Application server, etc , This will help identify bottlenecks in the application software and the hardware where the software is installed
- Pressure test: It is usually used to understand the capacity limit in the system . This test is conducted to determine the robustness of the system in terms of extreme loads , And help application administrators determine if the current load is much higher than the expected maximum , Whether the system can operate fully .
- Soak Test: Also known as durability test , It is usually used to determine whether the system can withstand the continuous expected load . During the soak test , Memory utilization is monitored to detect potential leaks . Equally important but often overlooked is performance degradation , That is to ensure that the throughput and response time after a long period of continuous activity are as good or better as at the beginning of the test . It essentially involves putting a lot of load on the system over a long period of time . The goal is to find out how the system behaves under continuous use .
- Peak test: By suddenly increasing or decreasing the load generated by a large number of users , And observe the behavior of the system to complete . The goal is to determine whether performance will be affected , The system will fail , Still able to deal with drastic changes in load .
- Breakpoint test: Breakpoint testing is similar to stress testing . Apply incremental loads over time , At the same time, the predetermined fault conditions of the monitoring system . Breakpoint testing is sometimes called capacity testing , Because it can be said that it determines the maximum capacity that the system will perform according to its required specifications or service level agreements . The breakpoint analysis results applied to the fixed environment can be used to determine the best expansion strategy according to the required hardware or the conditions that should trigger the horizontal expansion event in the cloud environment .
- Configuration testing: Instead of testing performance from a load perspective , Instead, create tests to determine the impact of configuration changes to system components on system performance and behavior . A common example is trying different load balancing methods .
- Isolation test: Isolation testing is not unique to performance testing , It involves repeating tests that cause system problems . Such a test can usually isolate and confirm the fault domain .
Basic process of performance test
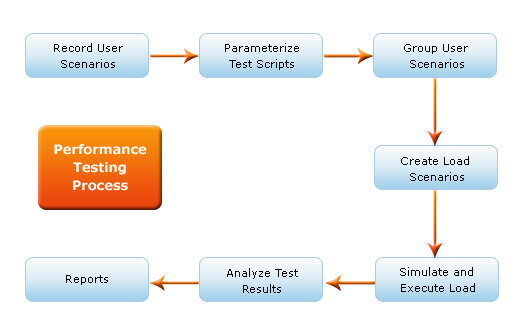
- Determining the test environment : By identifying available hardware 、 Software 、 Network configuration and tools , The test team can design tests and identify performance test challenges as early as possible . Performance test environment options include :
- Determine performance indicators : In addition to determining the response time 、 Throughput, constraints and other indicators , Also determine the success criteria for performance testing , According to the regulations of the team in the project .
- Plan and design performance tests : Considering the variability of users 、 Performance test scenarios for testing data and target metrics , You can create one or two models .
- Configure test environment : Prepare the test environment machines and tools needed to monitor resources .
- Develop test scripts
- Execute test plan : Running performance tests , Monitor and capture the generated data .
- analysis 、 The report 、 To test : Analyze the data and share the performance conclusions . Run the performance test again with the same parameters and different parameters .
Performance testing tools
- JMeter: It's a Apache Performance testing tools , It can be done to Web Load test with application services . JMeter Plug ins provide flexibility in load testing , And covers graphics 、 Thread group 、 timer 、 Functions and logic controllers . JMeter Support integrated development environment (IDE), For browser or Web Test the application , And for load testing based on Java Command line mode of the operating system .
- LoadRunner: from Micro Focus Development , Used to test and measure the performance of applications under load . LoadRunner It can simulate thousands of end users , And record and analyze the load test . As part of the simulation , The software generates messages between application components and end-user actions , Similar to key click or mouse movement . LoadRunner It also includes cloud oriented versions .
- NeoLoad: from Neotys Development , by Web And mobile applications to provide load and stress testing , Designed to test applications before release to achieve DevOps And continuous delivery IT The team can use this program to monitor Web、 Database and application server . NeoLoad It can simulate millions of users , And perform tests internally or through the cloud .
Performance test indicators
- throughput : How many information units does the system process in a specified time .
- response time : The amount of time elapsed between the request entered by the user and the system beginning to respond to the request .
- bandwidth : The amount of data that can be moved between workloads per second , Usually refers to through the network .
- Per second CPU Interruption times : The average value is taken . Refers to the number of hardware interrupts received and processed by the processor per second .
- Memory usage : The amount of physical memory available to processes on the computer .
- Disk usage : The amount of time the disk is busy executing read or write requests
A non systematic performance test practice
Test type
Test range
- Sub products involved : Project , Testhub , Wiki , Insight , Goals , Flow 6 Sub products .
- Basic services :Typhon service
Test purpose
- Ensure the reliability of the system in the case of multiple users : By implementing different performance test scenarios , Evaluate and verify the reliability of the core functions of the system under high load .
- Provide a round of system performance test , Provide baseline data for the next round of production environment performance testing .
- Evaluate the rationality of system deployment resources : Continuously collect and analyze performance test process data , Evaluate and make suggestions on the system resources required for the next system deployment .
- Optimize and solve system performance problems : During the test , Optimize the parameters of the system and solve the system performance problems found .
Test index standard
- According to the number of online users provided by operation and maintenance , To calculate the users of the production environment TPS, Pass the test of benchmark environment , To verify the real TPS Whether it meets the requirements of the production environment TPS demand , And whether our operation and maintenance structure and resource use are reasonable .
- Guaranteed at CPU The utilization rate is less than 80%, Memory less than 80%, And there is no mistake Http request .
Test practice
Testing tools
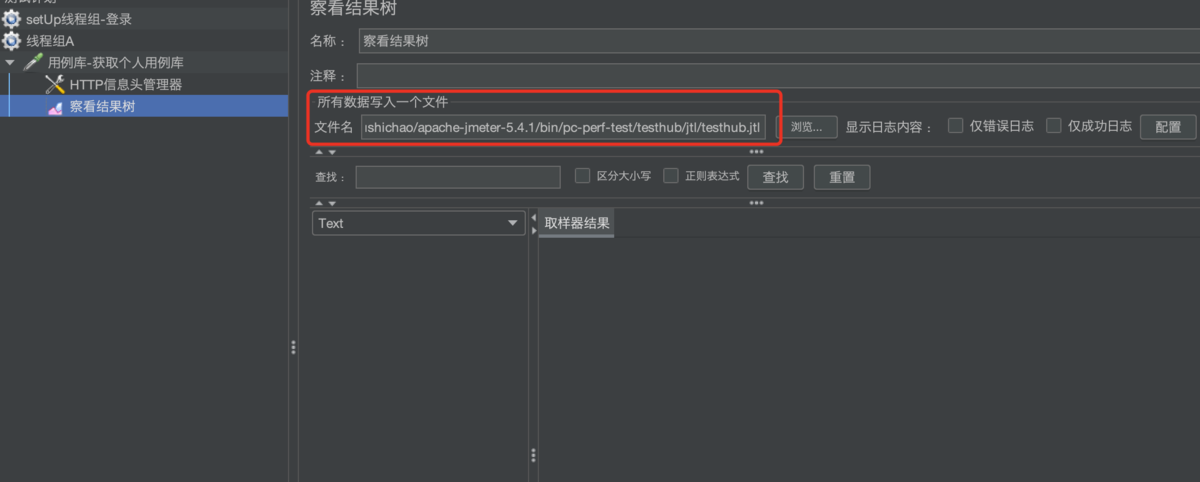
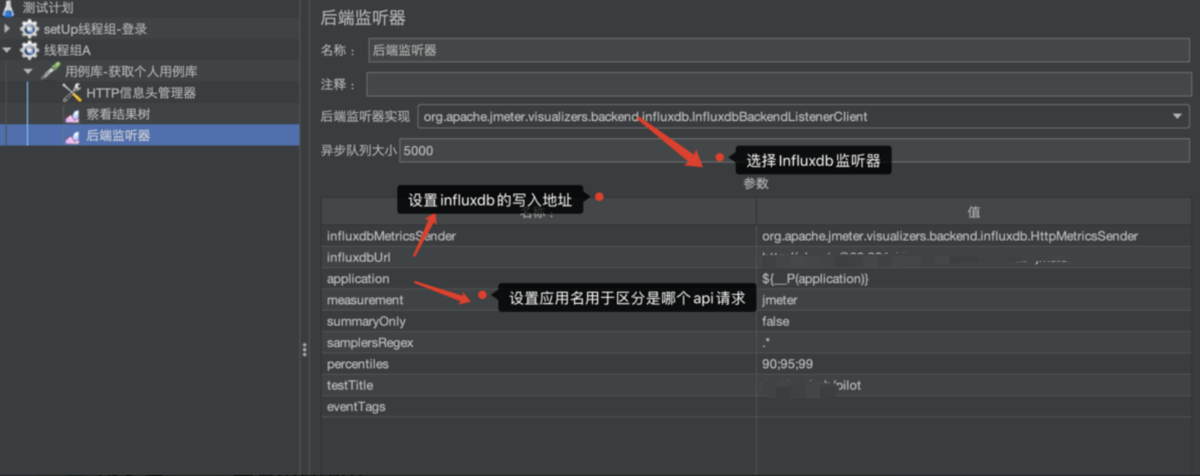
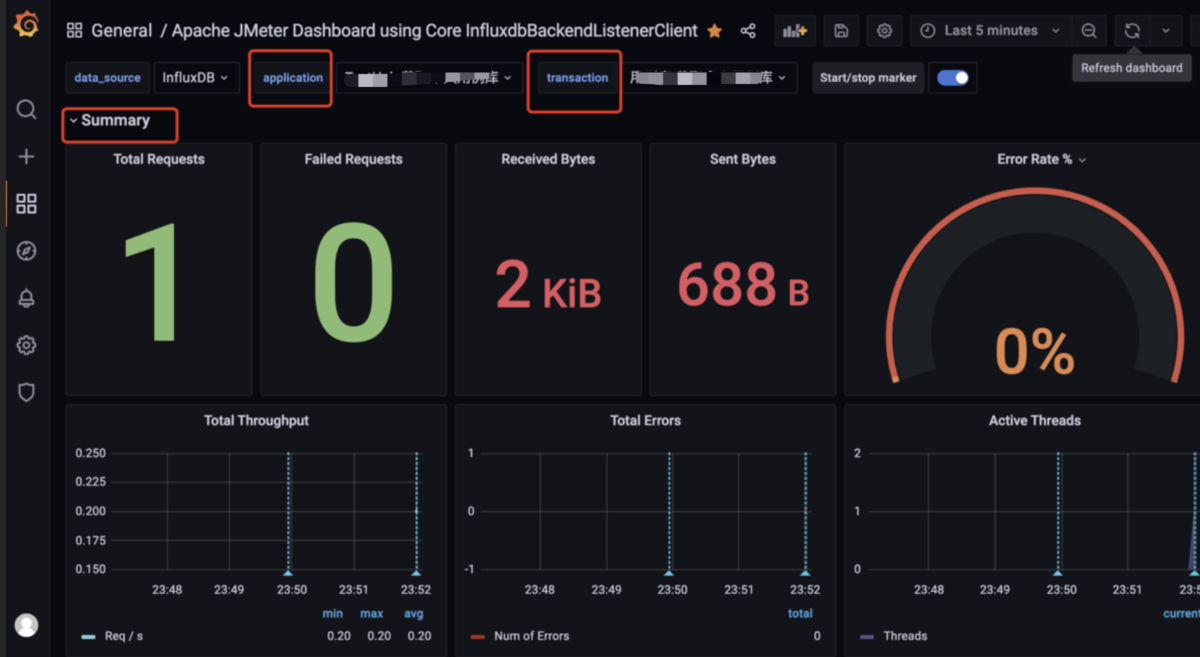
- use Jmeter + Grafana + Influxdb To complete the performance test .
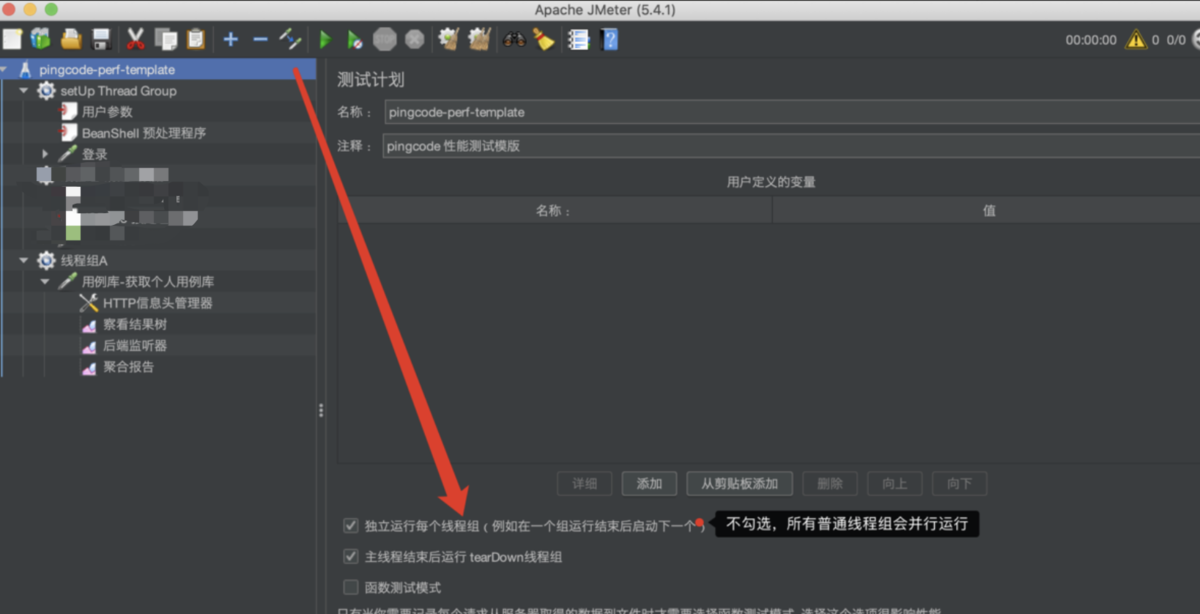
- Jmeter GUI GUI tools : In order to facilitate development and debugging , Use the graphical interface to write the required test plan .
- Jmeter NO-GUI Pattern : Support large load test scenarios 、 Improve the efficiency of script execution and facilitate the subsequent configuration of scripts to Jenkins To achieve continuous integration on , Make automated testing .
Environment building
- install Java Of Jdk, Version follows Jmeter Version corresponding .
- install Jmeter Tools
Jmeter The value of the number of passes in the center line is based on
- First of all, understand the number of users 、 Number of threads 、TPS
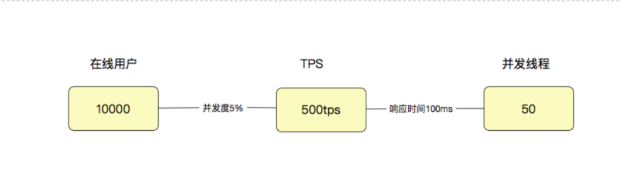
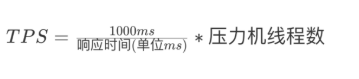
- adopt TPS Calculate the number of threads of the press according to the benchmark
Jmeter Project directory structure
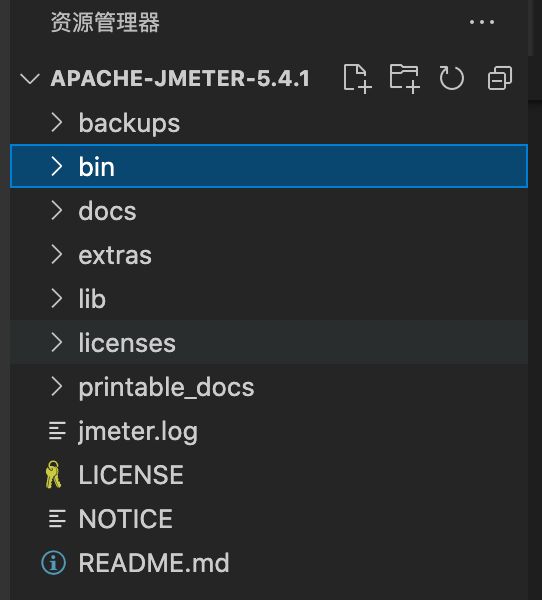
bintemplatesjmeter.properties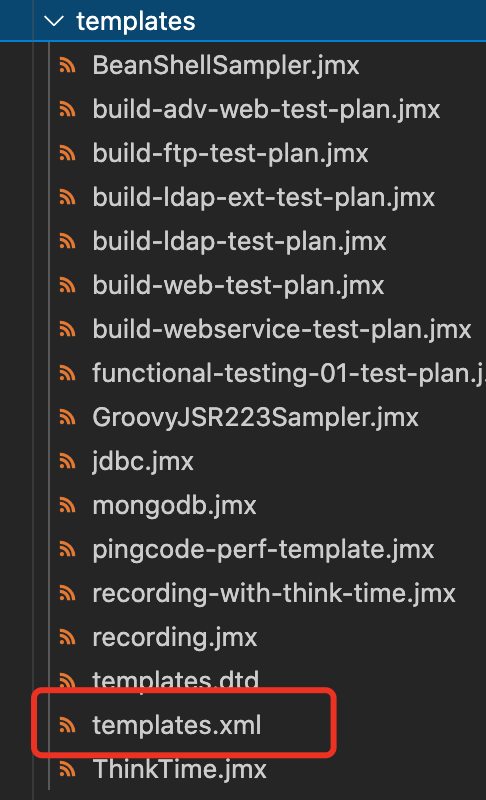
templates.xml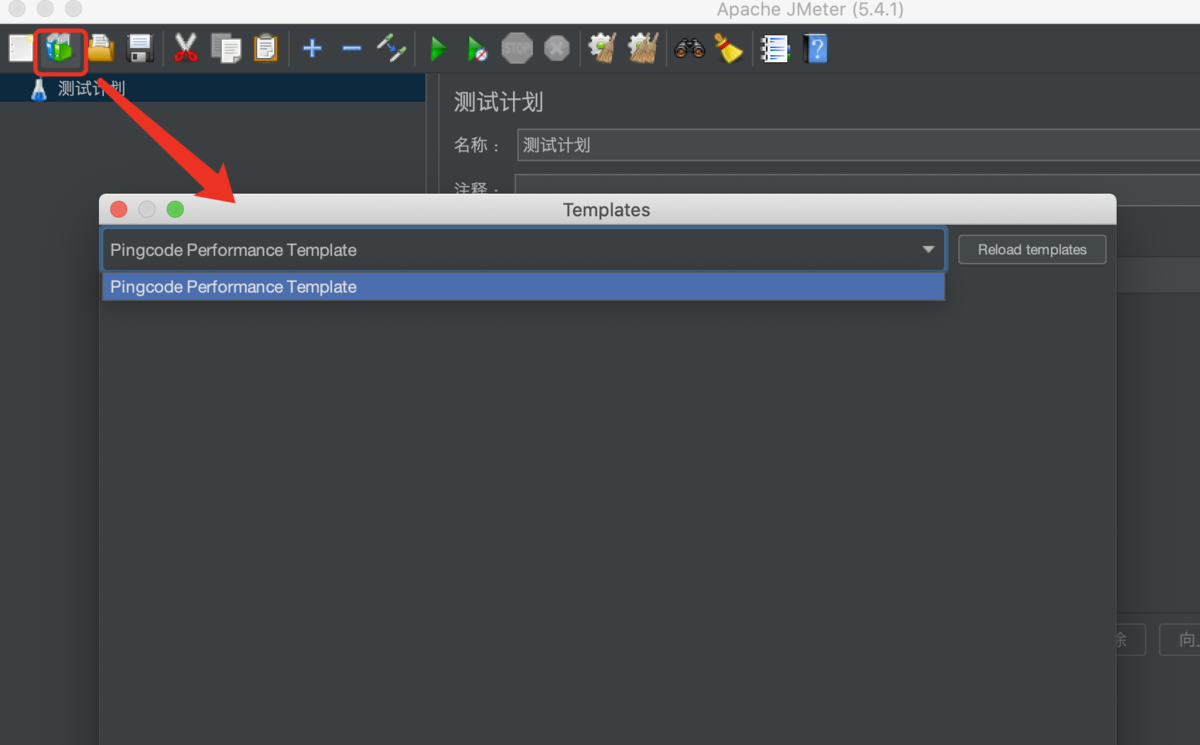
Project preparation and configuration file modification
pc-perfcd jmeter/bin
git clone [git Project address ]- common Folder : It is used to store the test plan template and template configuration file templates.xml.
- Sub application directory : And common The peer directory is the sub application directory , As the goal Goals、 project Project etc. . This directory is used to store the corresponding .jmx Test plan file .
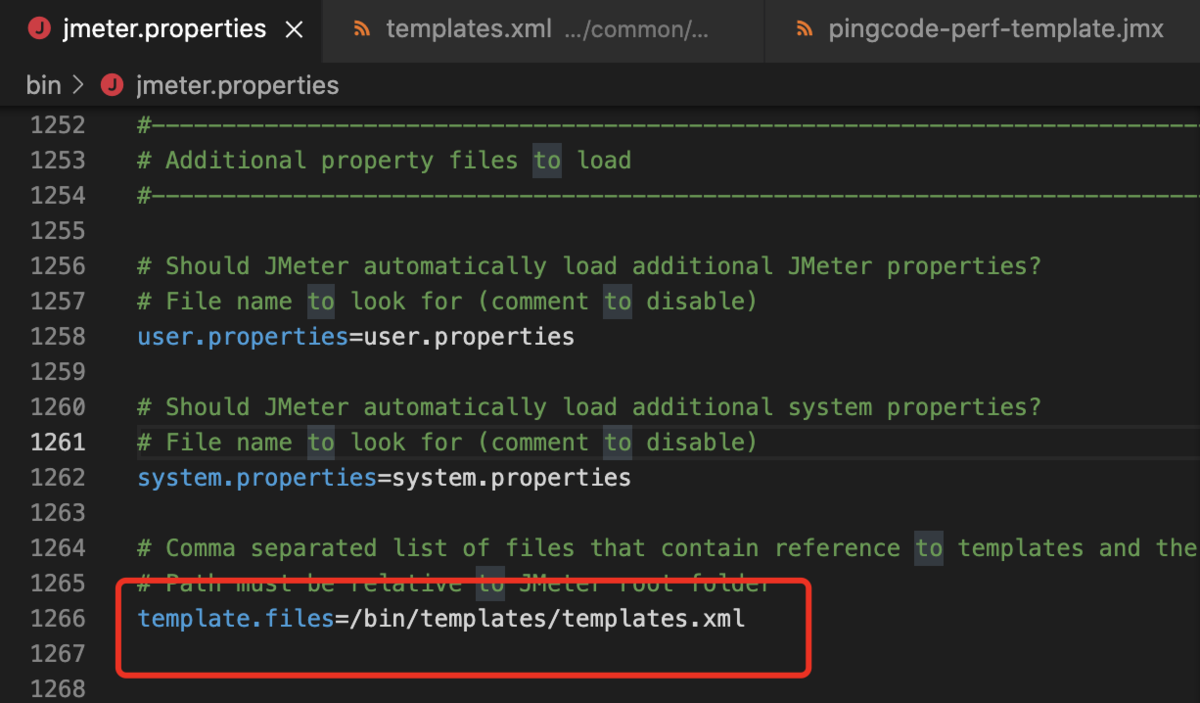
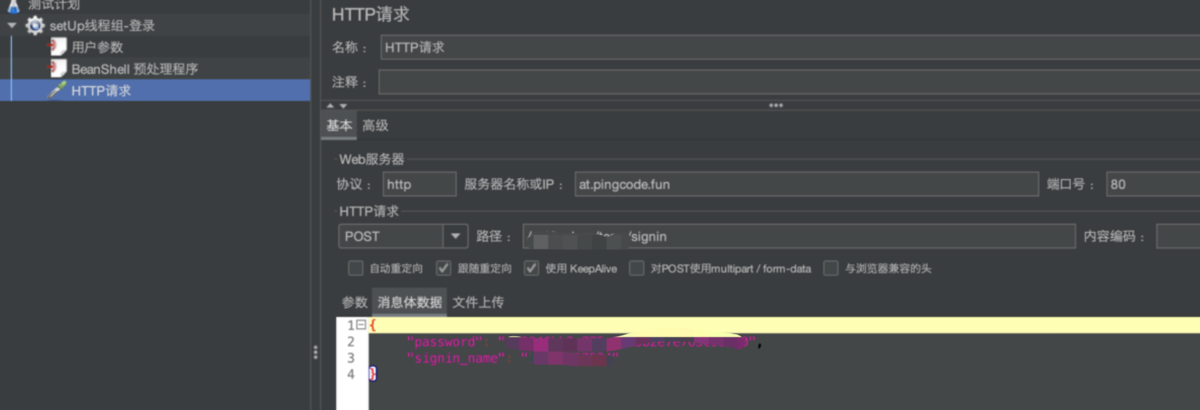
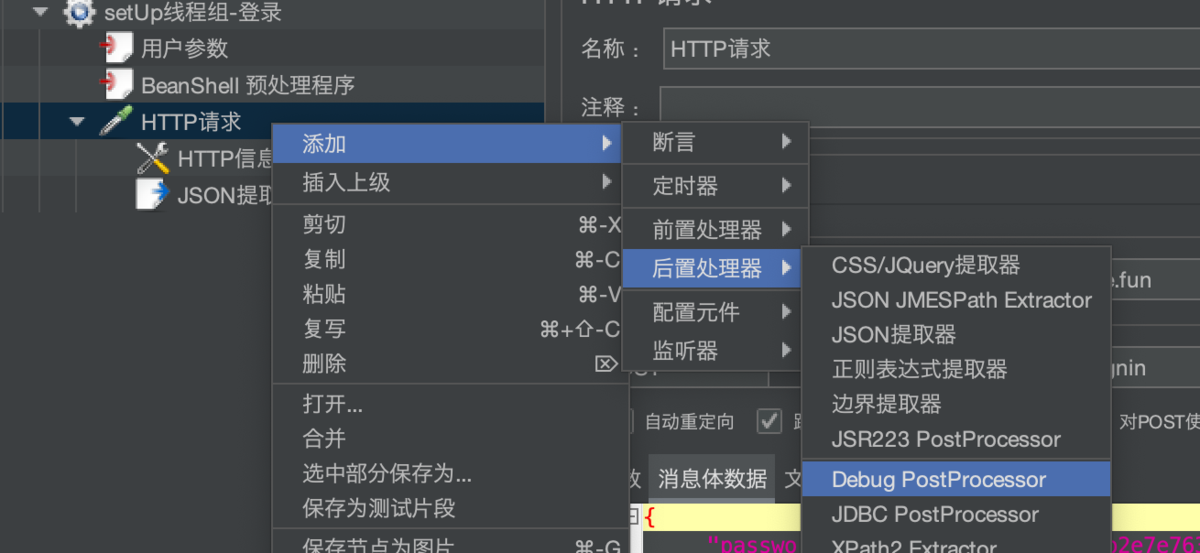
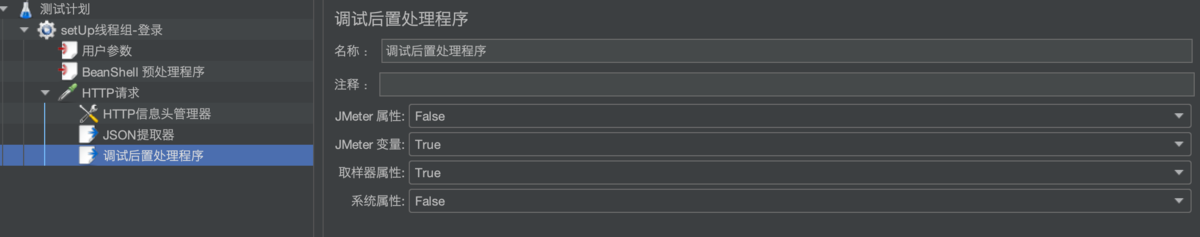
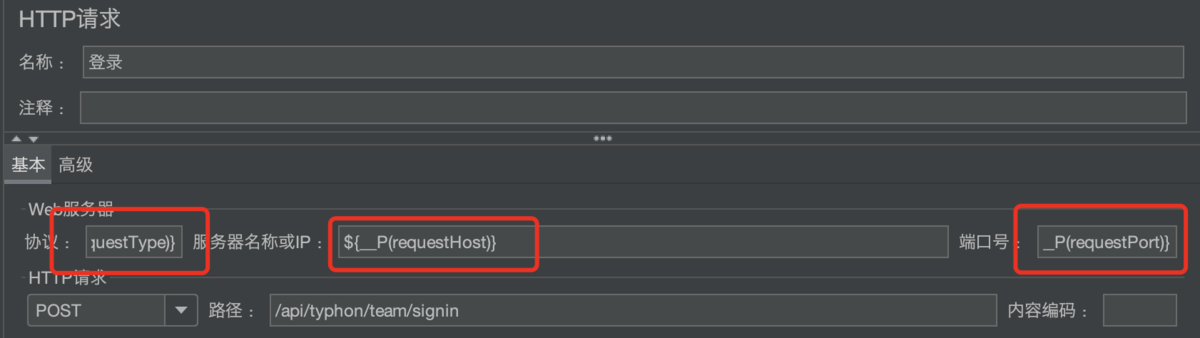
template.files = /bin/pc-perf/common/templates/templates.xmlJMeter Template development
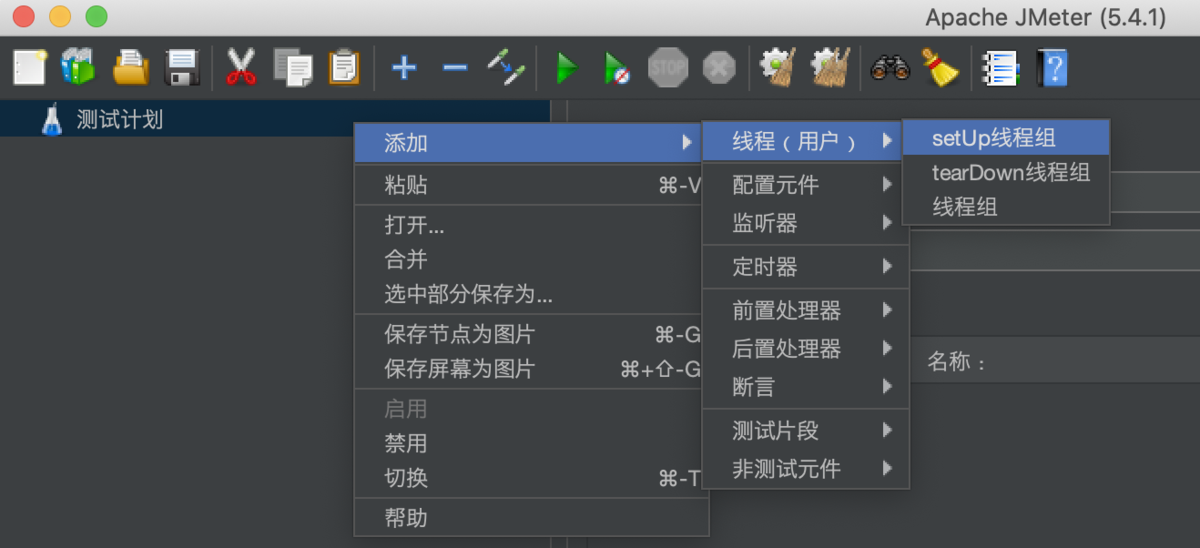
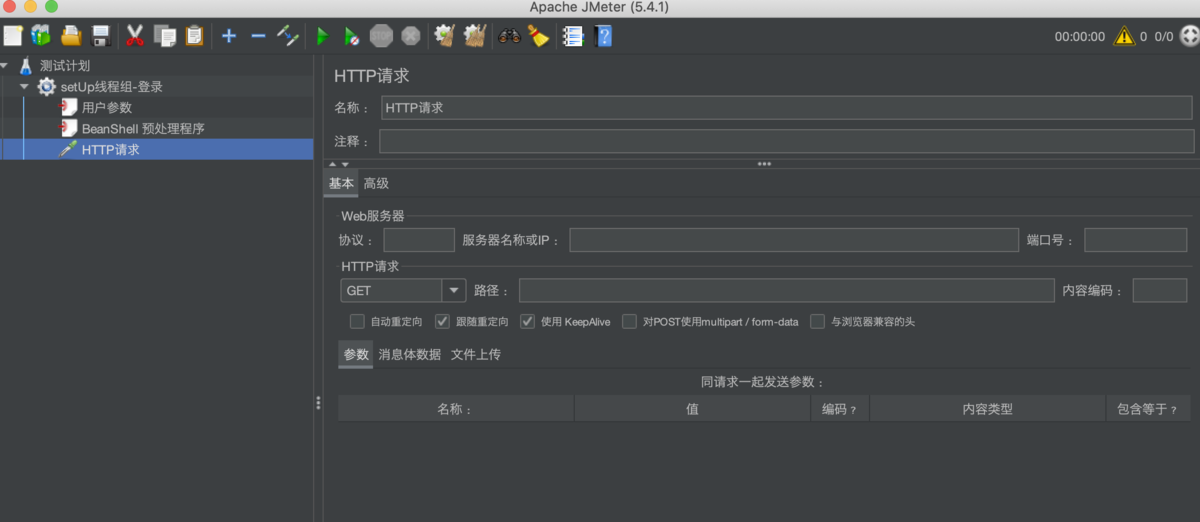
- Open browser developer tools
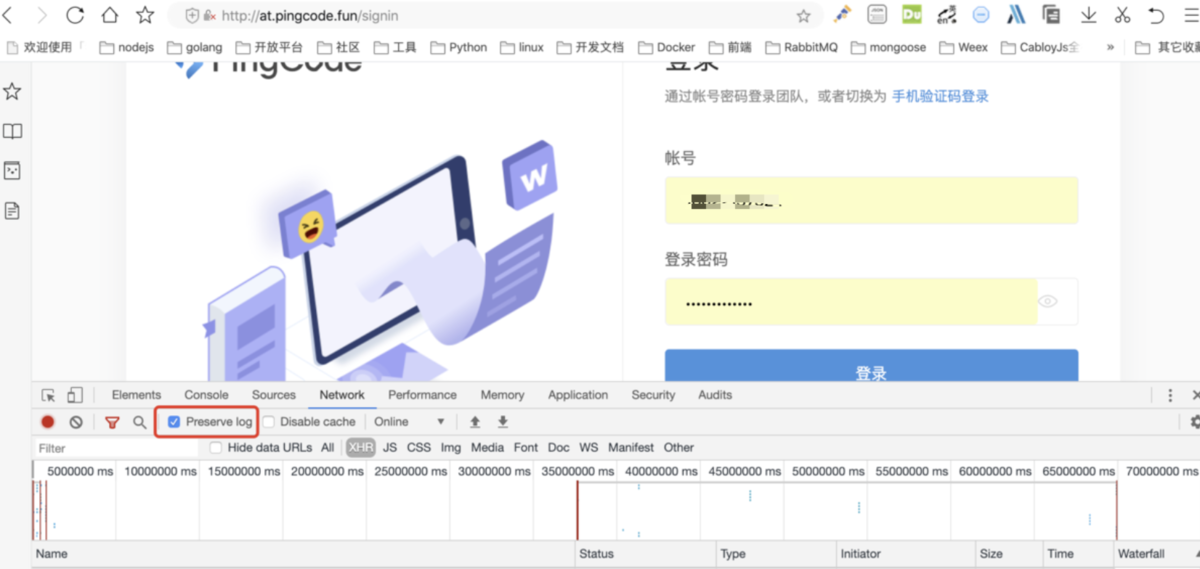
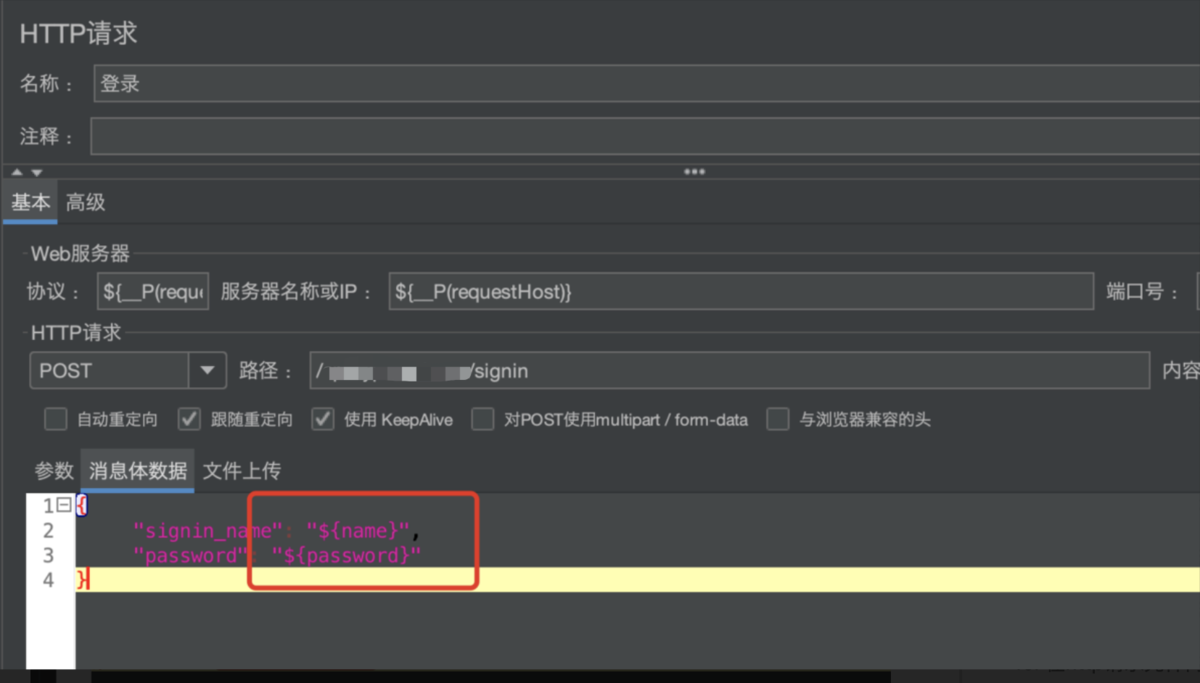
- obtain signin Information
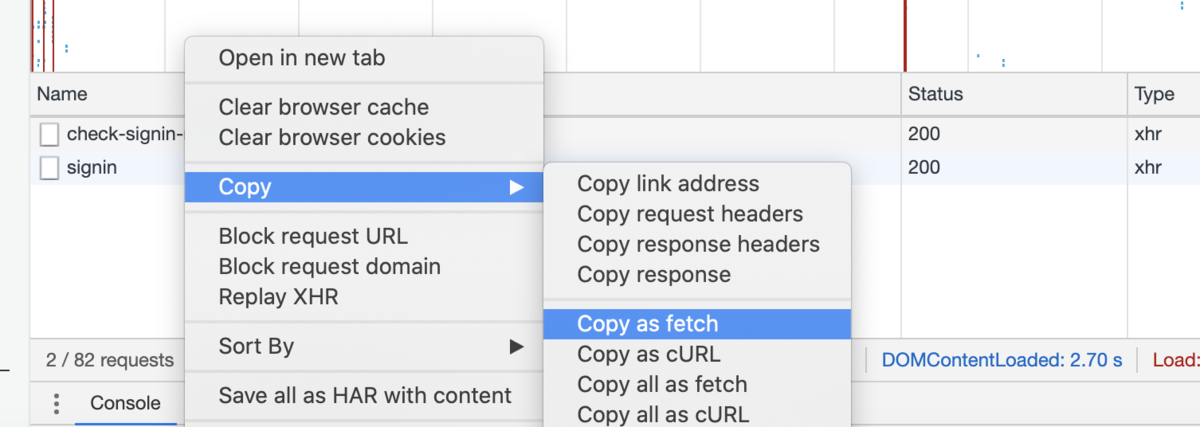
fetch("http://at.pingcode.fun/**/signin",
 {
 "credentials":"include",
 "headers":{
 "accept":"application/json, text/plain, */*",
 "accept-language":"zh-CN,zh;q=0.9",
 "content-type":"application/json"
 },
 "referrer":"http://at.pingcode.fun/signin",
 "referrerPolicy":"no-referrer-when-downgrade",
 "body":"{\"signin_name\":\"**\",\"password\":\"**\",\"captcha_code\":\"\"}",
 "method":"POST",
 "mode":"cors"
 });
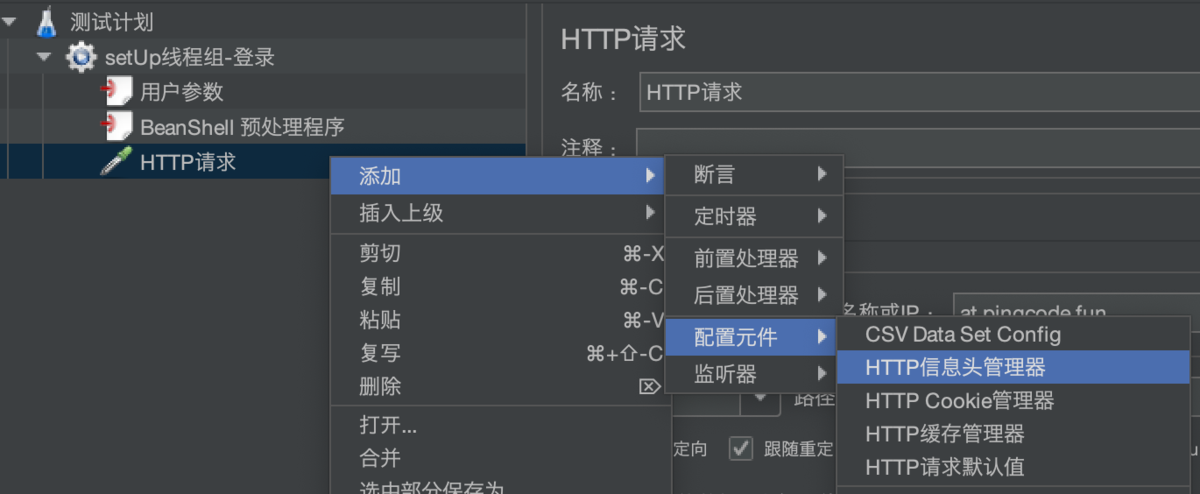
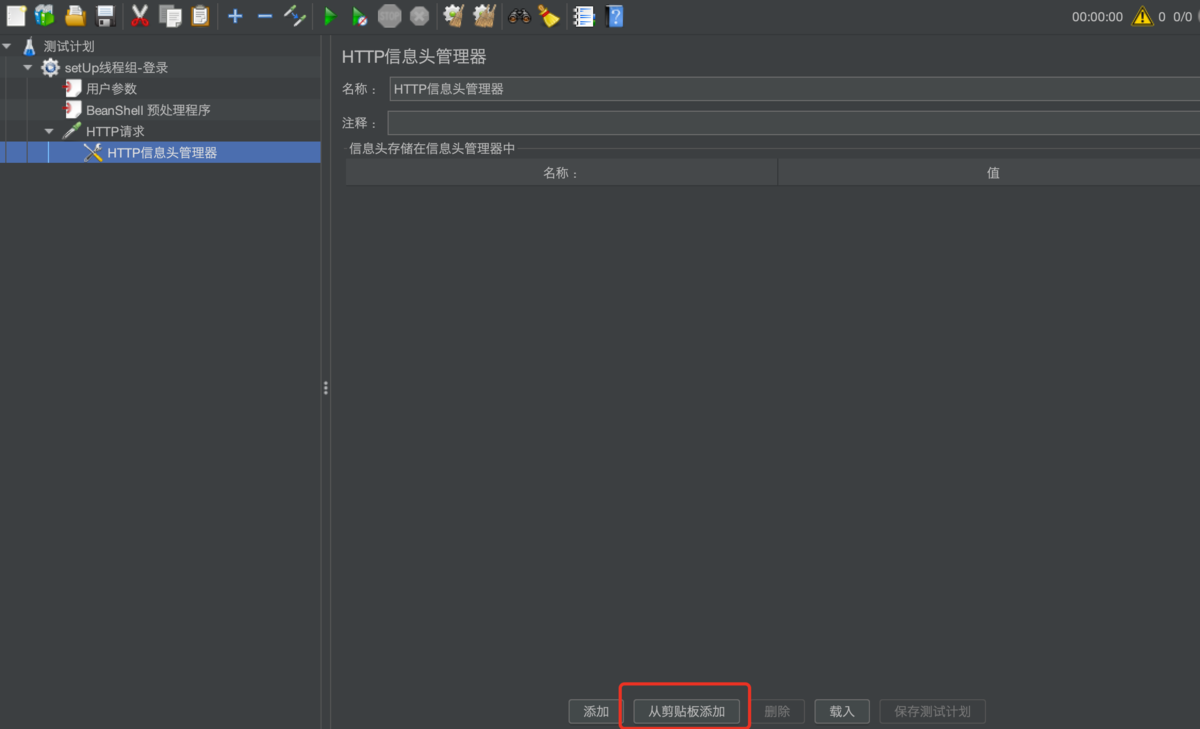
- You can use the previous step in the developer tool of the browser Copy request headers Get the complete request header information
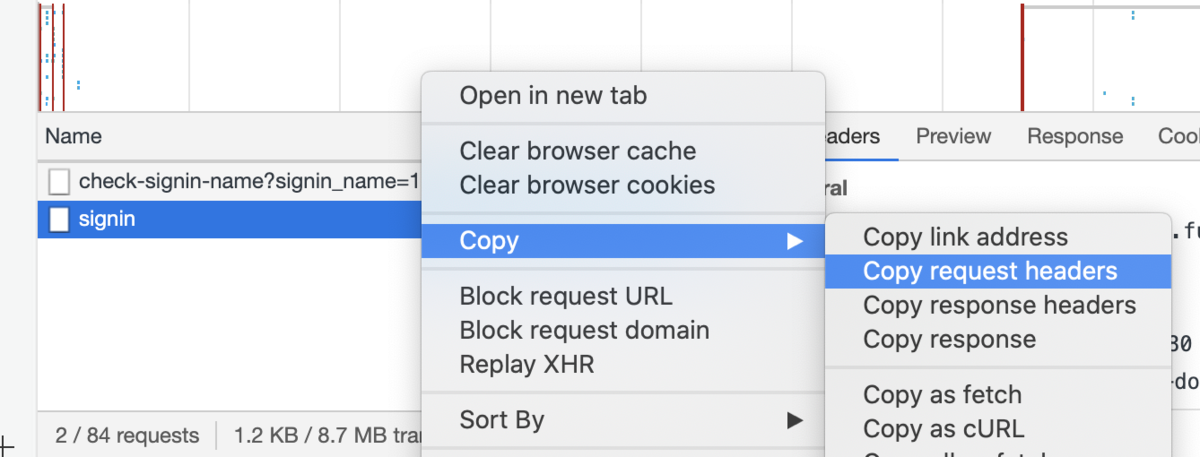
- It comes with components “ Add... From the clipboard ” function , One click configuration request header information
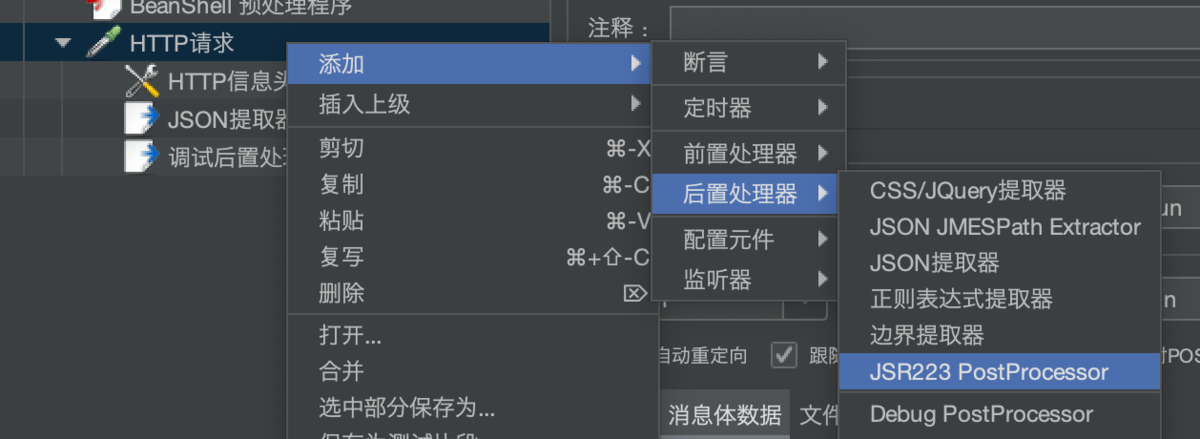
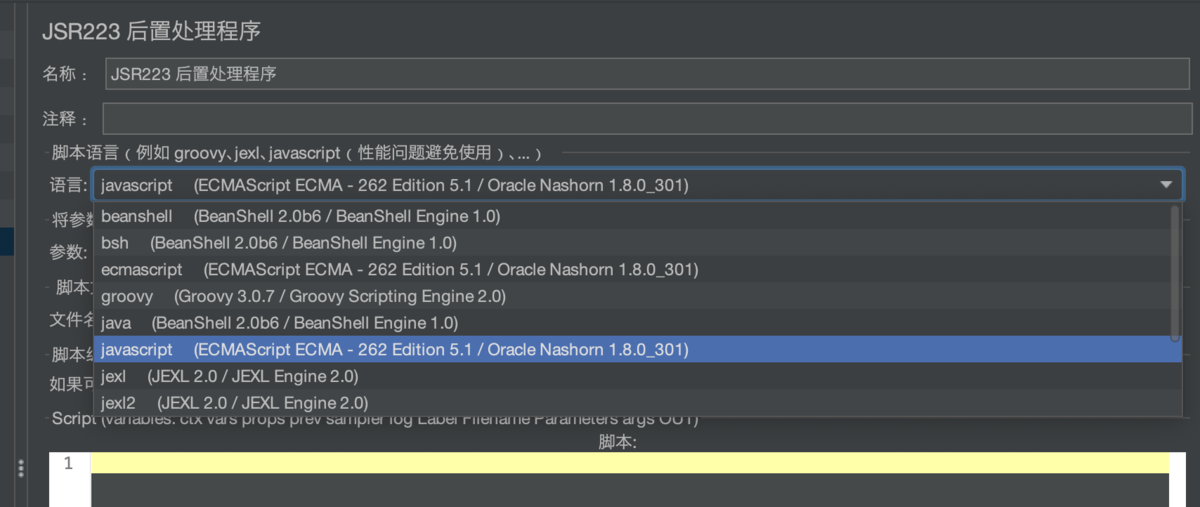
- Use Javascript Language to write scripts
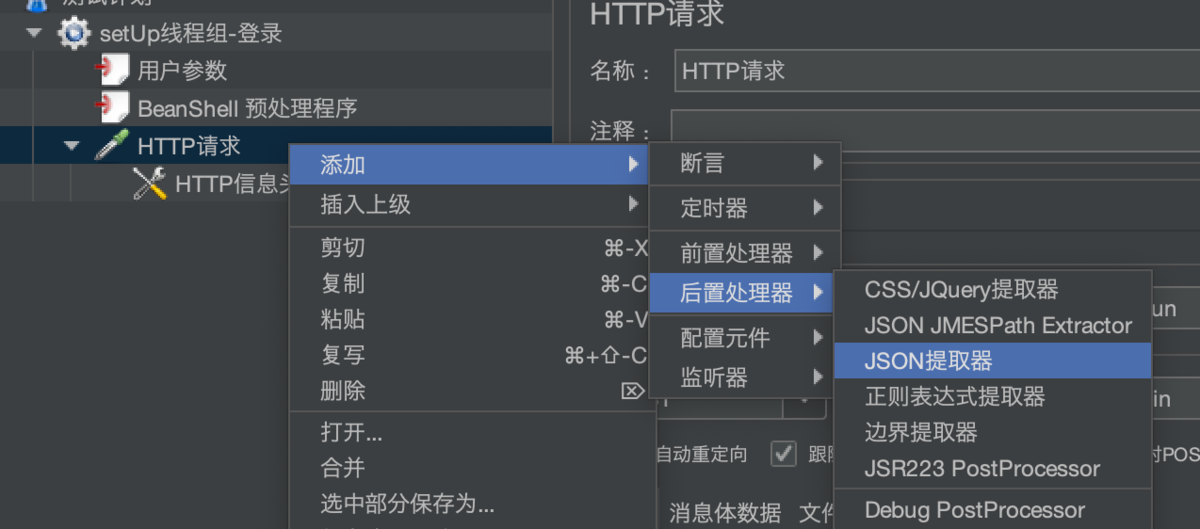
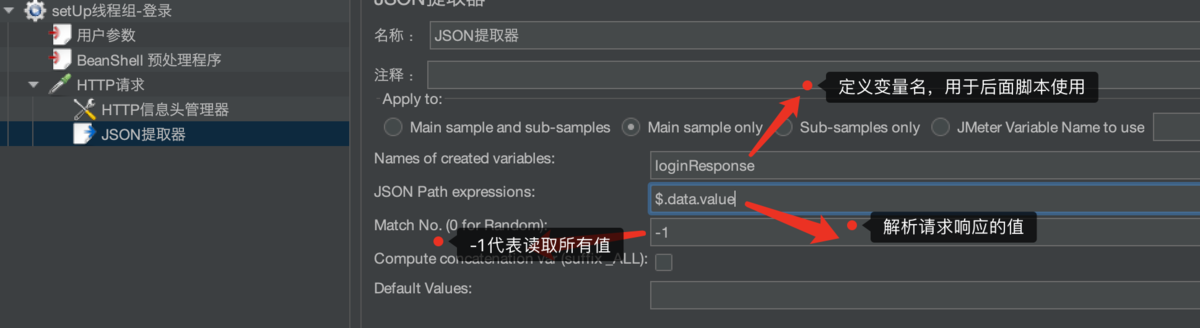
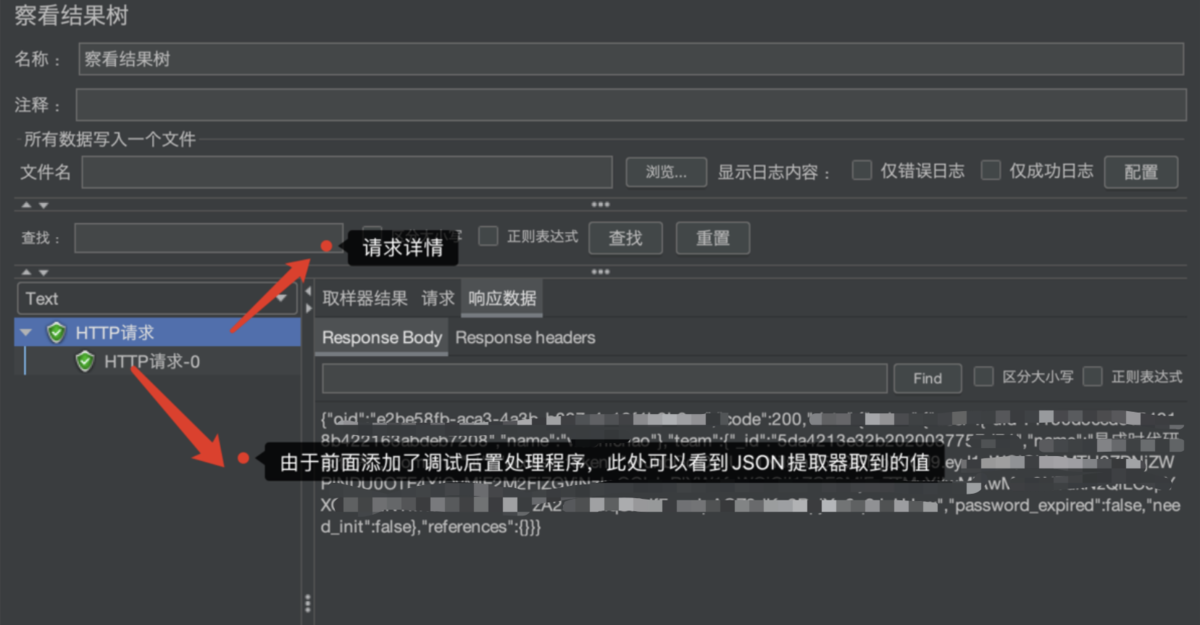
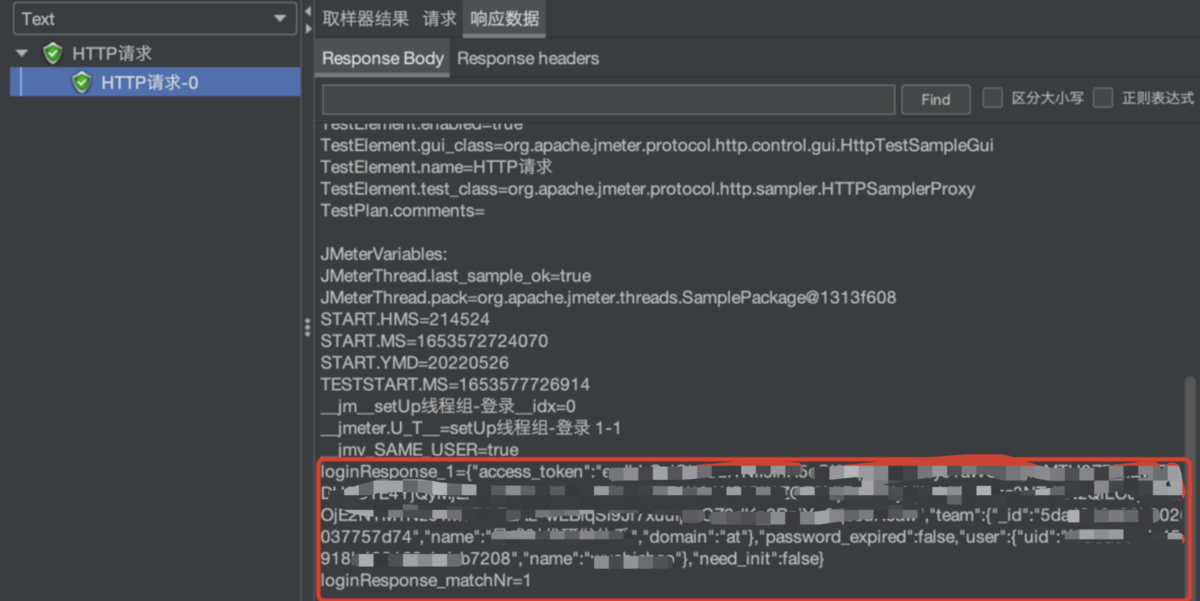
- Extract users 、 The team 、token Information
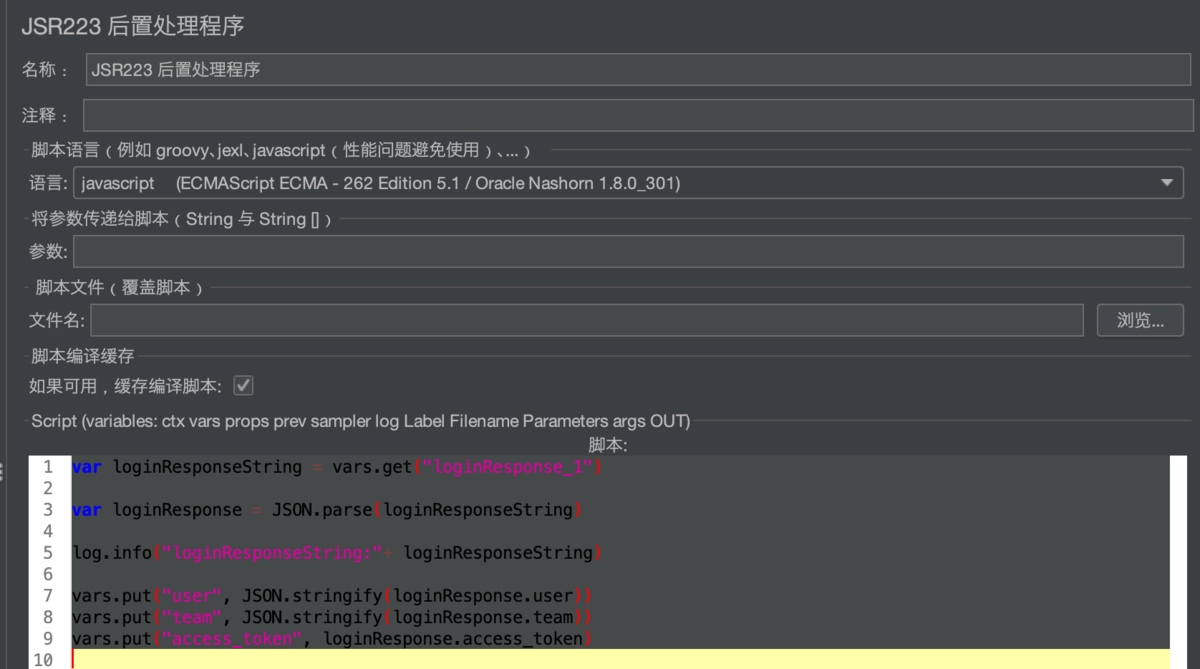
// here loginResponse_1 It's from JSON The debugging results of the extractor can be obtained
var loginResponseString = vars.get("loginResponse_1")
var loginResponse = JSON.parse(loginResponseString)
log.info("loginResponseString:"+ loginResponseString)
// Set variables in this thread group
vars.put("user", JSON.stringify(loginResponse.user))
vars.put("team", JSON.stringify(loginResponse.team))
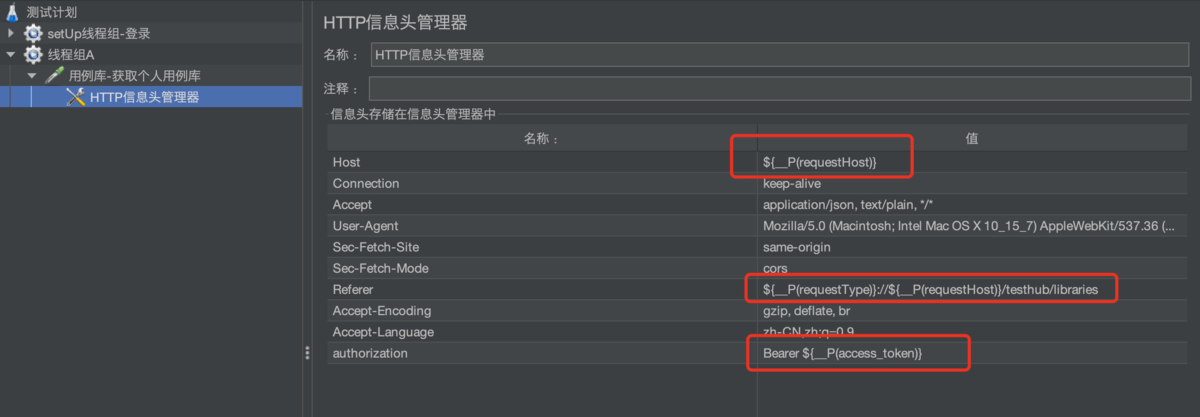
vars.put("access_token", loginResponse.access_token)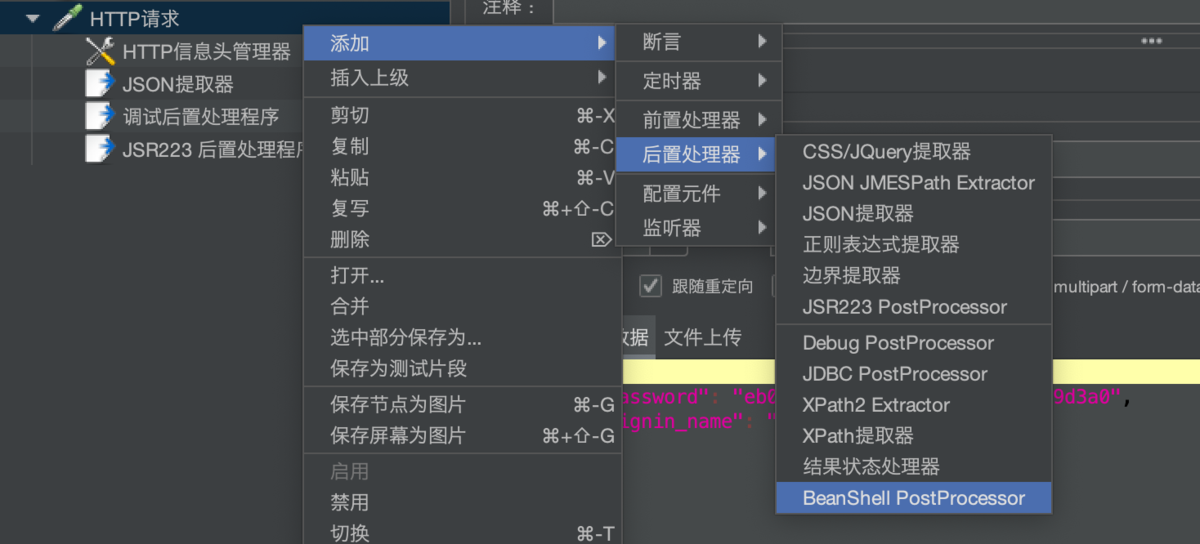
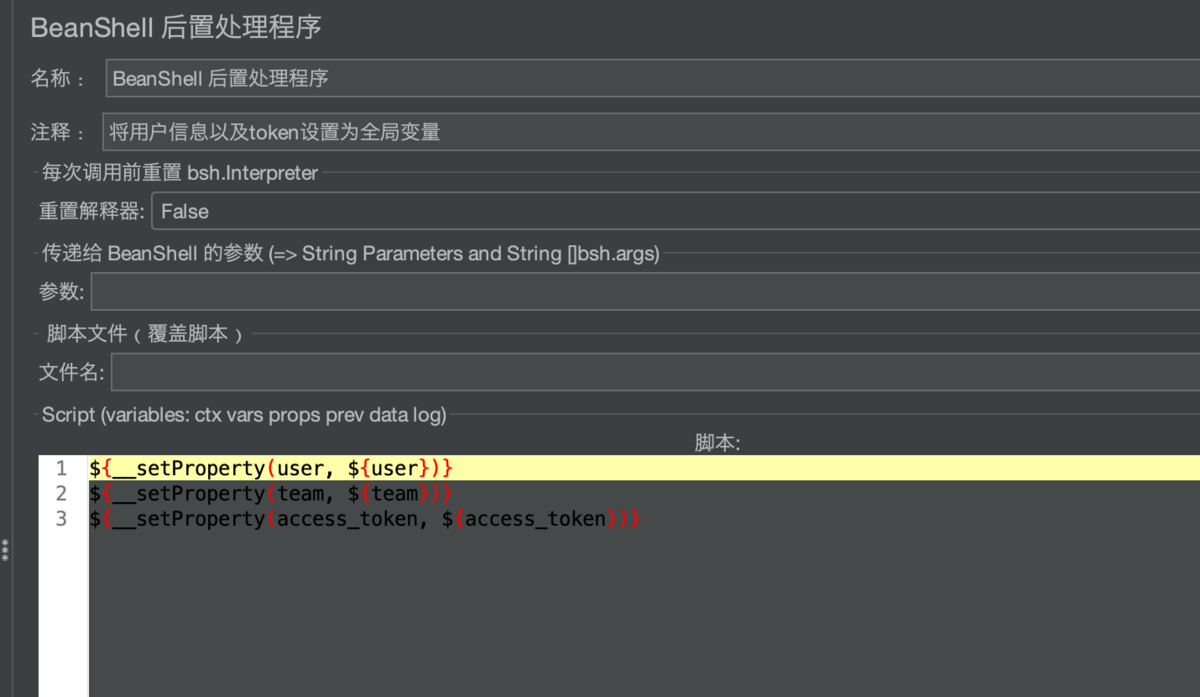
//  Will the user 、 The team 、token Information is declared as global variables , Used for later thread groups
${__setProperty(user, ${user})}
${__setProperty(team, ${team})}
${__setProperty(access_token, ${access_token})}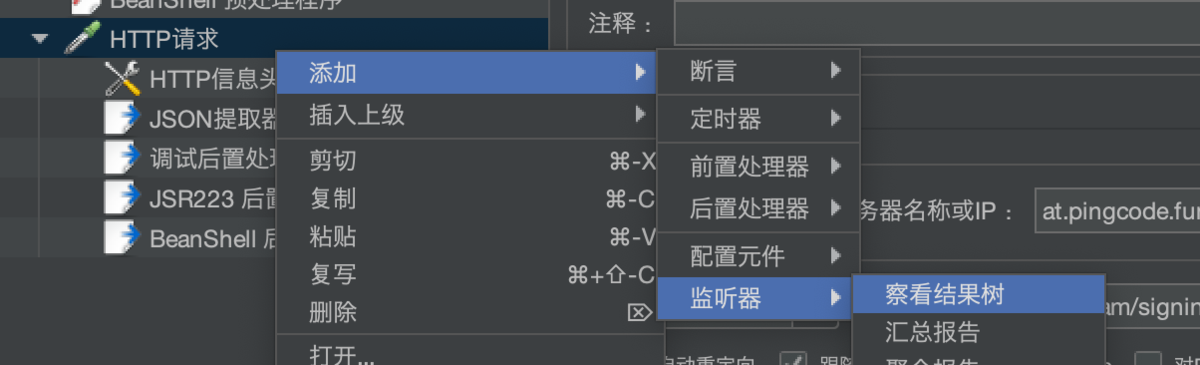
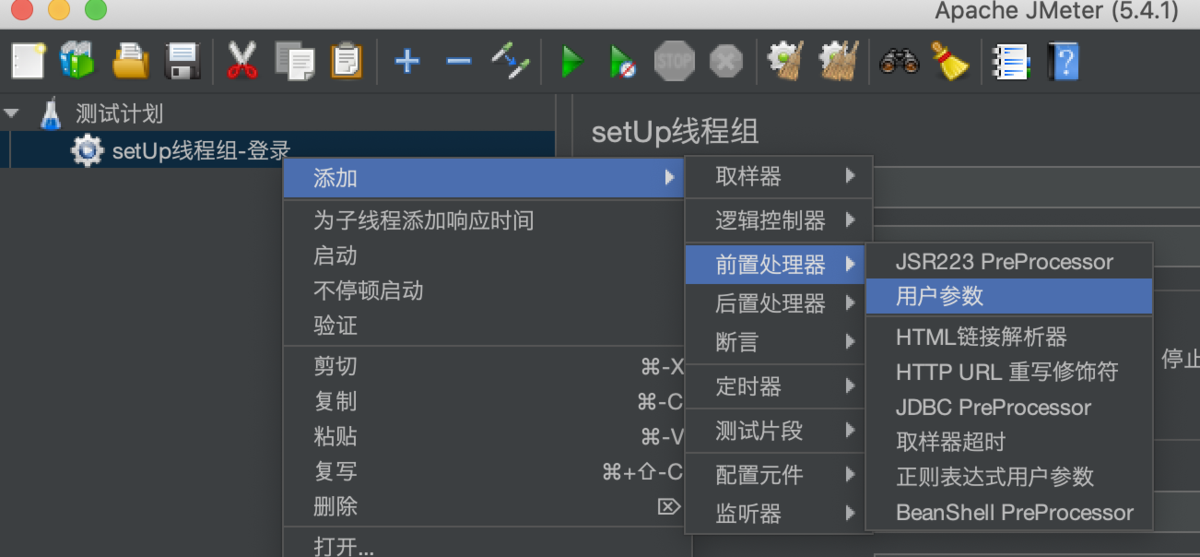
data.valueloginResponse_1- Modify user parameter processor
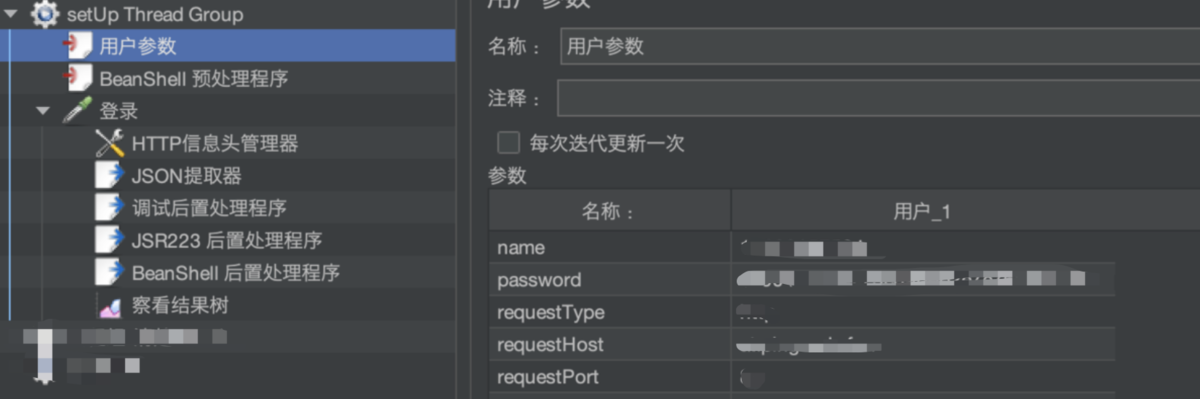
 Local variable calling method :
 Use... In components :${key}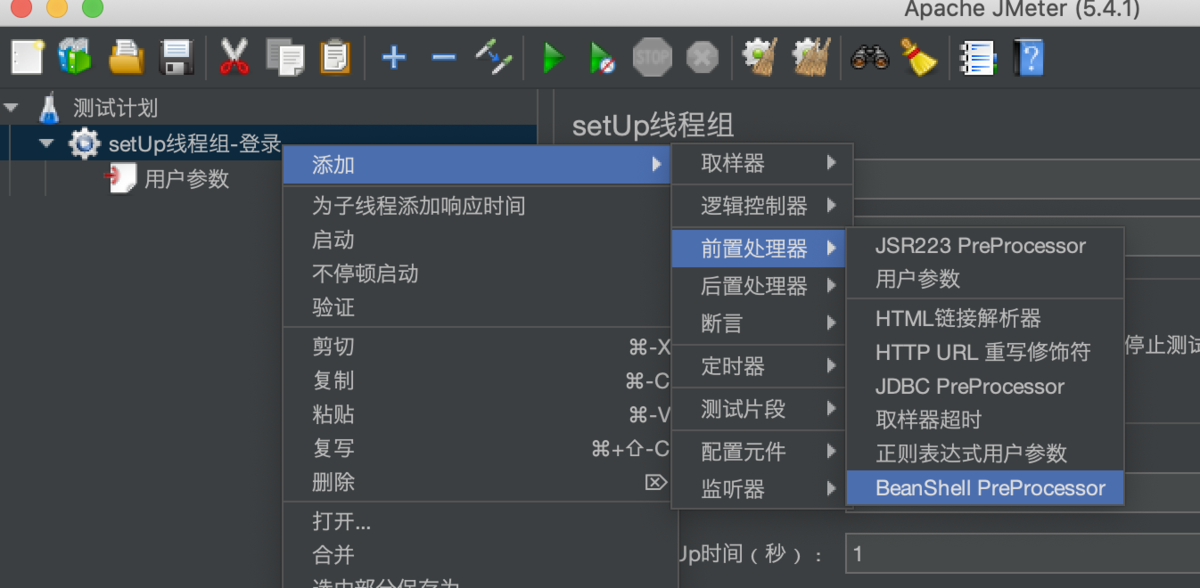
Use in script :vars.get(key)- modify BeanShell Preprocessor
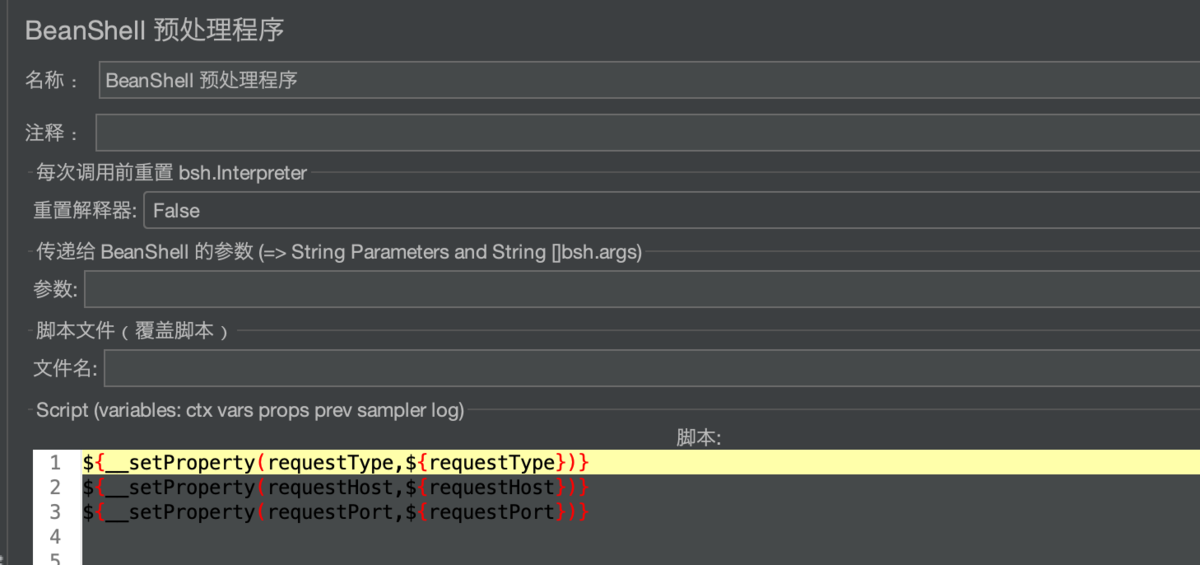
How to call global variables :
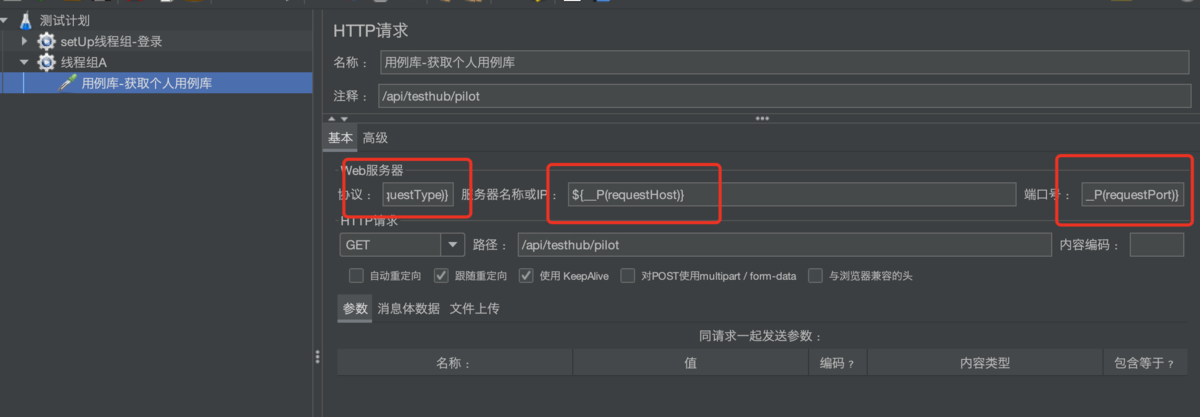
Use in components :${__P(key)}
Use... In scripts :props.get(key)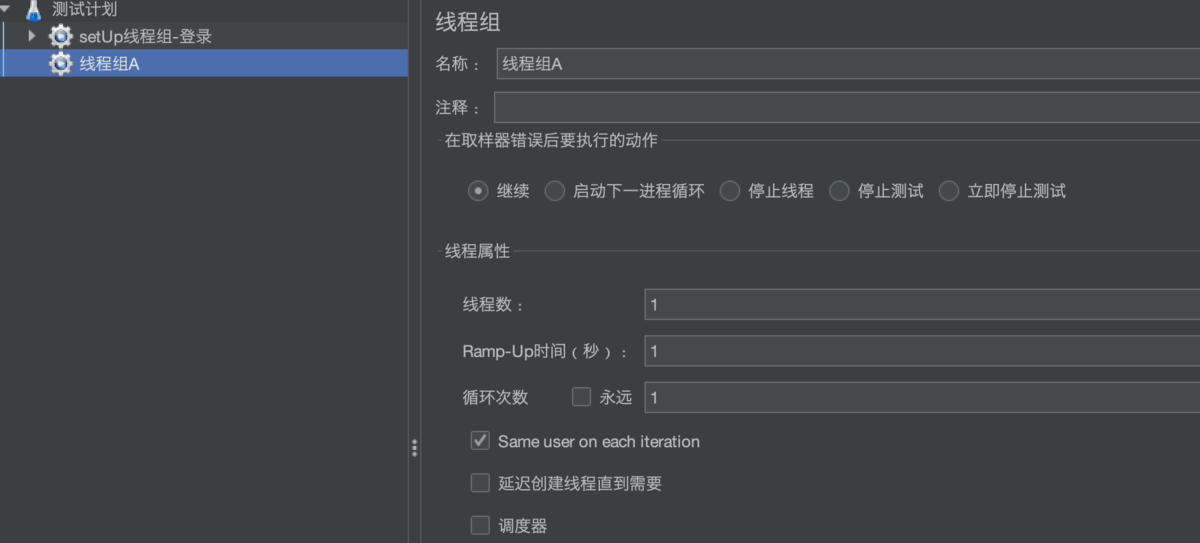

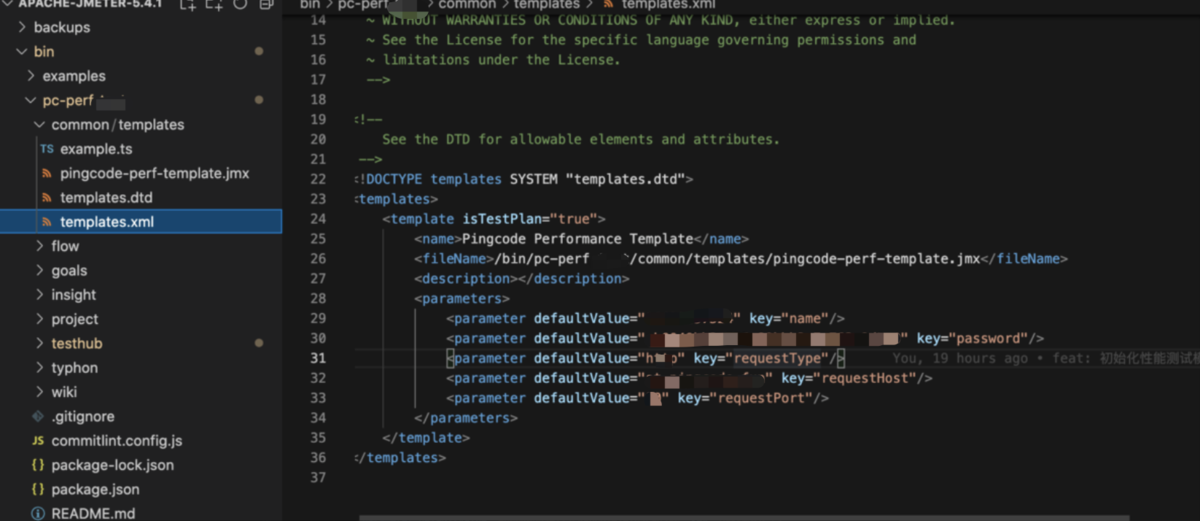
name: Template name , Used to display in the template list
fileName: The path of the test plan to be configured as a template
description: Template description
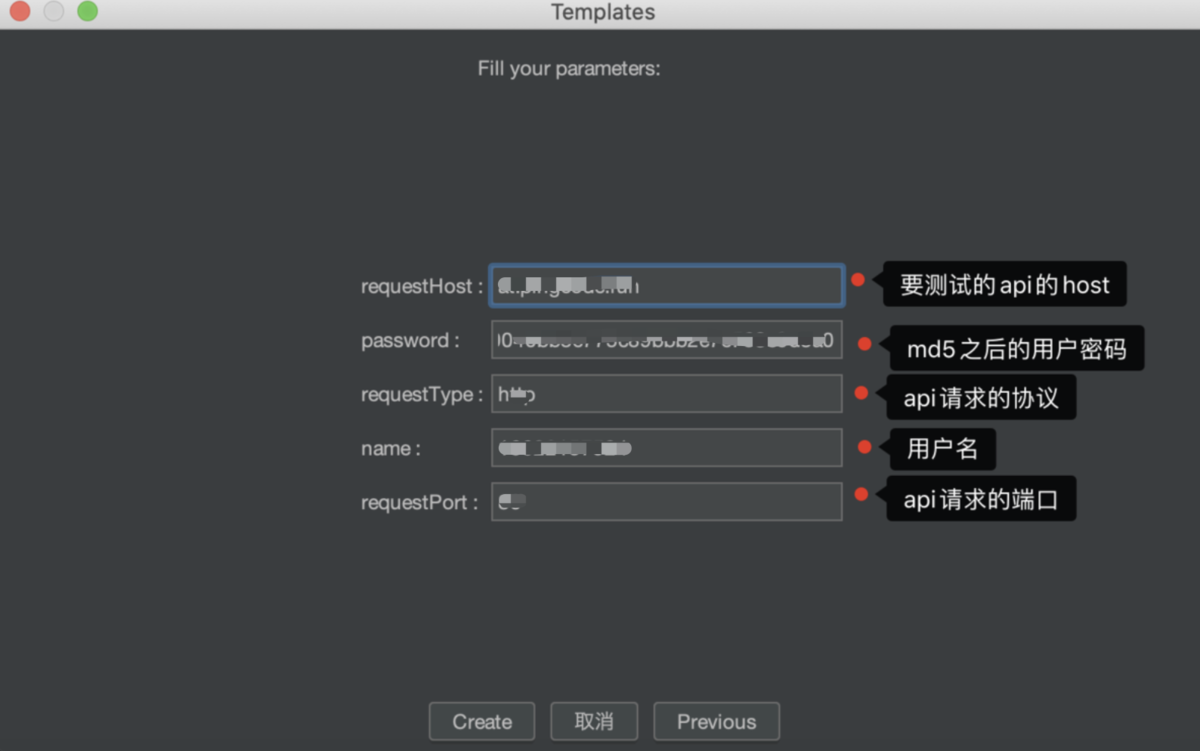
parameters: Template parameters , You can use the template UI Page to page test plan .jmx File dynamic transfer parameters .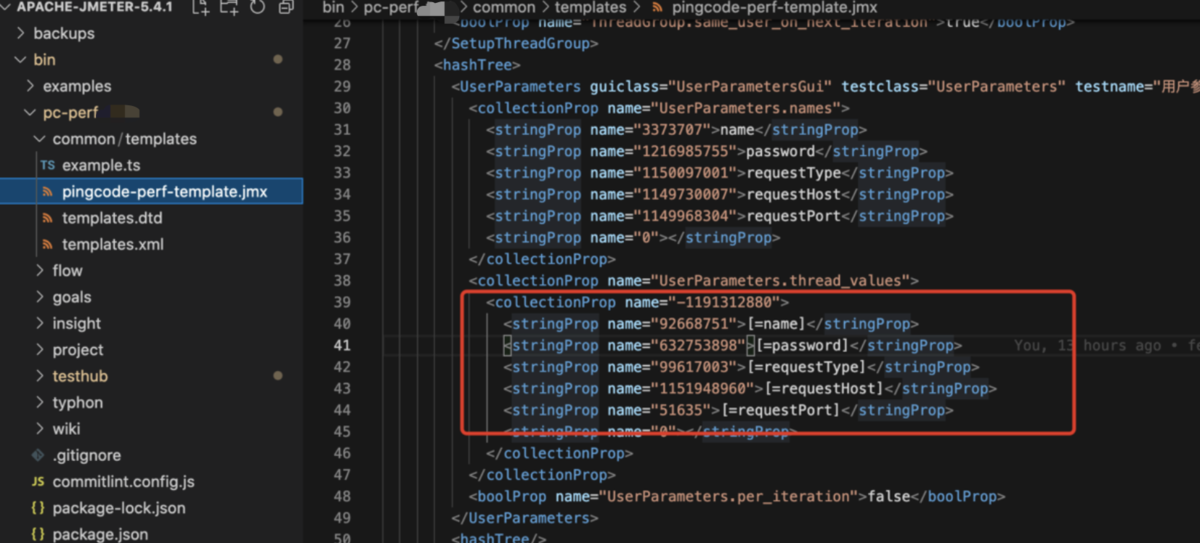
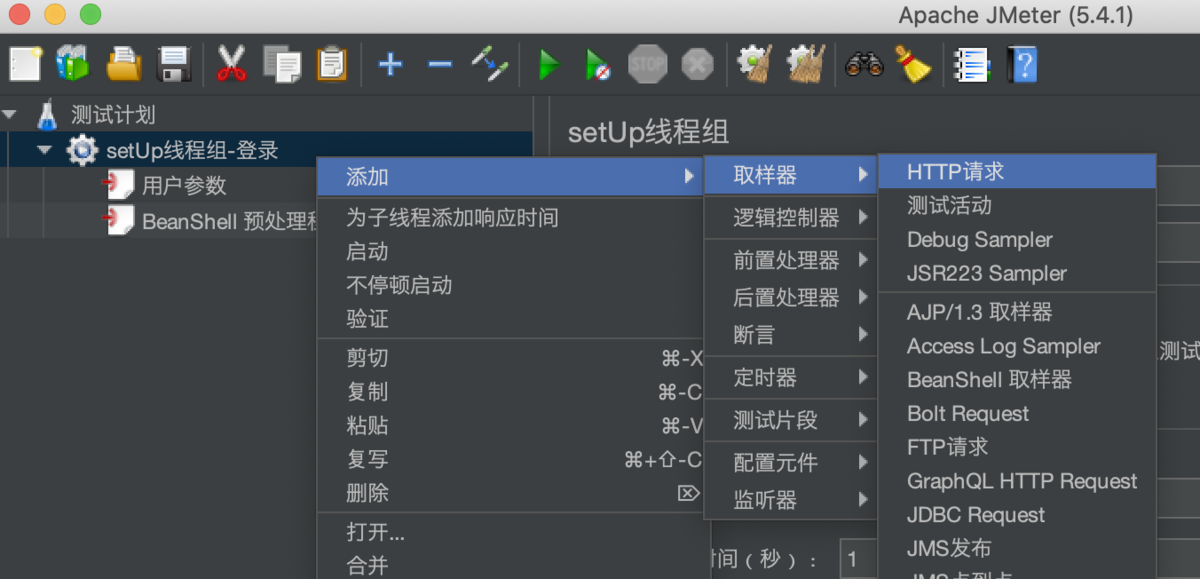
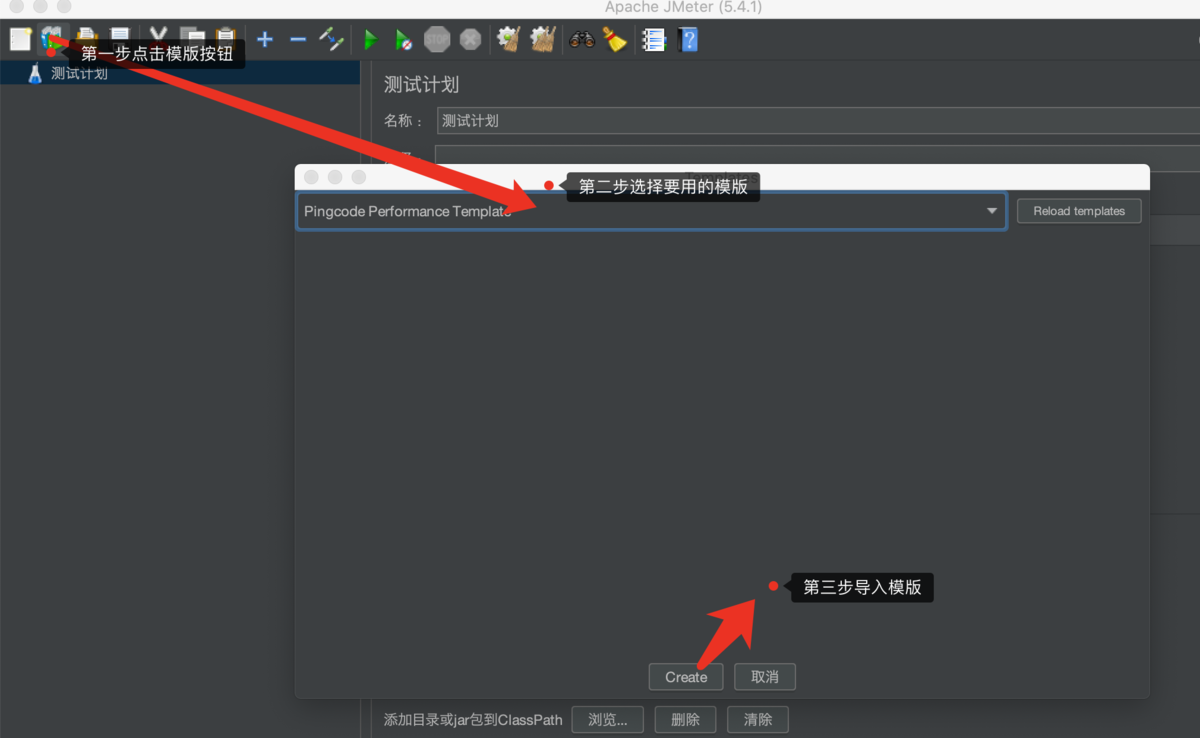
adopt [=key] Receive template parameters in the form of Development sub application API test plan
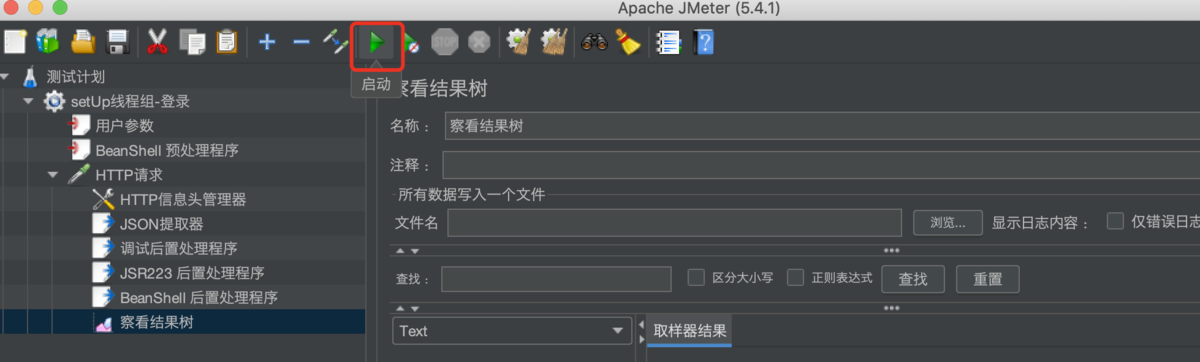
adopt Non-GUI Way to execute all test plans
jmeter -n -t <testfile> -l <logfile>

 Example :jmeter -n -t test.jmx -l test.jtl
 Explain : Run on the command line test.jmx Script and generate test.jtl Log report .

-h  Print usage information and exit
-n  Not GUI Pattern  ->  In Africa GUI Run in mode JMeter
-t  The test file < Parameters > -> To run jmeter test (.jmx) file .
-l  Log files < Parameters > -> Generated log files
-H  Set the... To use JMeter proxy server
-P Set the... To use JMeter Proxy port 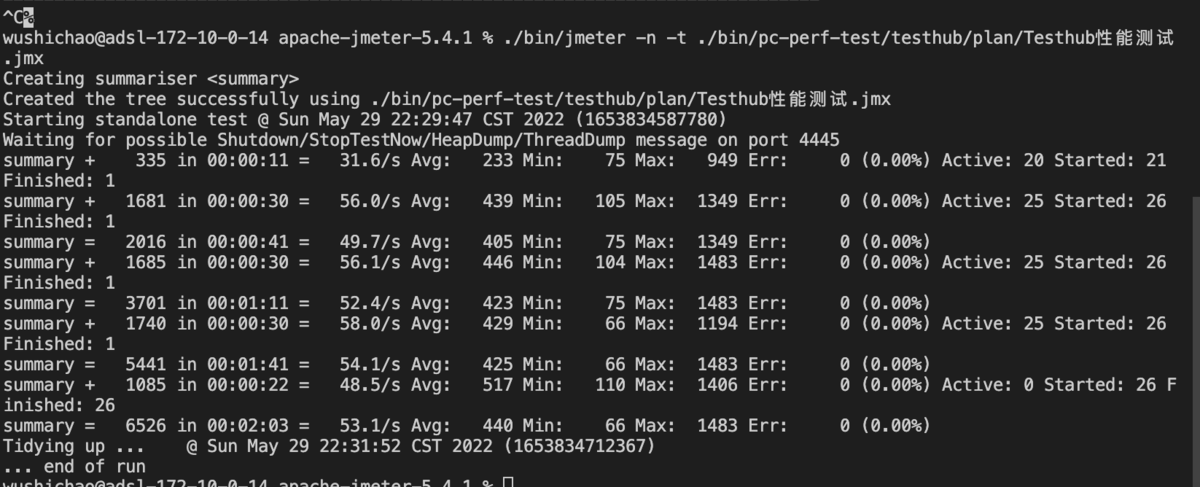
Information
- wikipedia : https://en.wikipedia.org/wiki/Software_performance_testing
- Jmeter: https://jmeter.apache.org/
- LoadRunner: https://en.wikipedia.org/wiki/LoadRunner
- NeoLoad: https://www.tricentis.com/products/performance-testing-neoload/
边栏推荐
- It's too convenient. You can complete the code release and approval by nailing it!
- detectron2安装方法
- Start by counting
- [Acwing] 58周赛 4489. 最长子序列
- Statistical learning: logistic regression and cross entropy loss (pytoch Implementation)
- How can programmers improve the speed of code writing?
- How to contribute to the source code of ongdb core project
- TP configuring multiple databases
- ECCV 2022 released: 1629 papers were selected, and the employment rate was less than 20%
- 智慧物流园区供应链管理系统解决方案:数智化供应链赋能物流运输行业供应链新模式
猜你喜欢
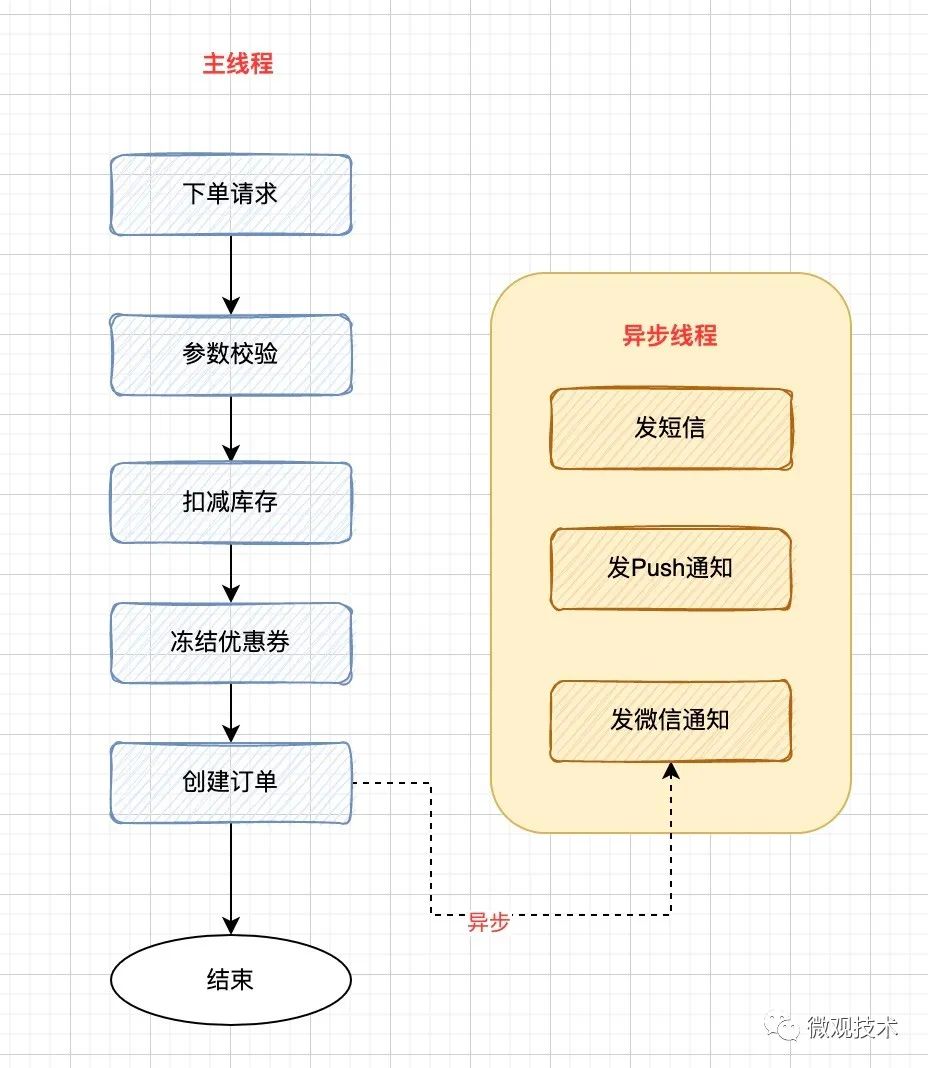
聊聊异步编程的 7 种实现方式
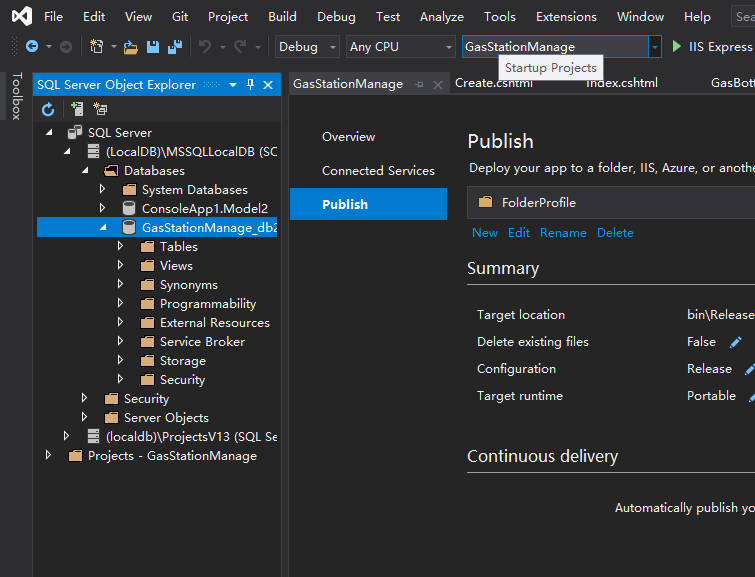
Visual Studio 2019 (LocalDB)MSSQLLocalDB SQL Server 2014 数据库版本为852无法打开,此服务器支持782
C# 更加优质的操作MongoDB数据库
从数数开始

祝贺Artefact首席数据科学家张鹏飞先生荣获 Campaign Asia Tech MVP 2022

Solution of commercial supply chain coordination system in the mineral industry: build a digital intelligent supply chain platform to ensure the safe supply of mineral resources
Go micro tutorial - Chapter 2 go micro V3 using gin and etcd
overflow:auto与felx结合的用法
Go development: how to use go singleton mode to ensure the security of high concurrency of streaming media?
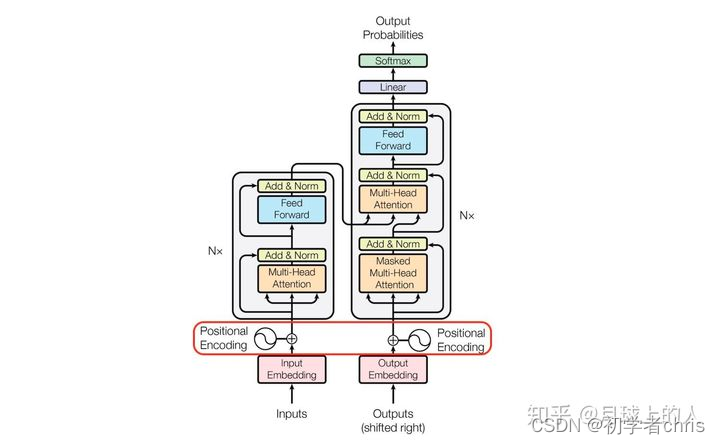
Transformer中position encoding实践
随机推荐
51 single chip microcomputer temperature alarm based on WiFi control
Solution of commercial supply chain coordination system in the mineral industry: build a digital intelligent supply chain platform to ensure the safe supply of mineral resources
C implementation defines a set of intermediate SQL statements that can be executed across libraries
Rebalance operation in spark and its difference from repartition operation
程序员怎么才能提高代码编写速度?
leetcode刷题目录总结
Is it safe for Anxin securities to open an account online? Is the account opening fee charged
China's plastic processing machinery market trend report, technological innovation and market forecast
Object. Usage of keys()
Task state rollback and data blocking tasks based on check point mechanism
PingCode 性能测试之负载测试实践
Why do you say that the maximum single table of MySQL database is 20million? Based on what?
【Go ~ 0到1 】 第六天 文件的读写与创建
7 RSA密码体制
Cypher task design and task locking mechanism of isomorphic and heterogeneous graphs
Array filter fliter in JS
Jump table instance
Understand asp Net core - Authentication Based on jwtbearer
C# 更加优质的操作MongoDB数据库
智慧物流园区供应链管理系统解决方案:数智化供应链赋能物流运输行业供应链新模式