当前位置:网站首页>Prometheus监控容器、pod、邮件告警
Prometheus监控容器、pod、邮件告警
2022-08-03 05:26:00 【养了一只皮卡丘】
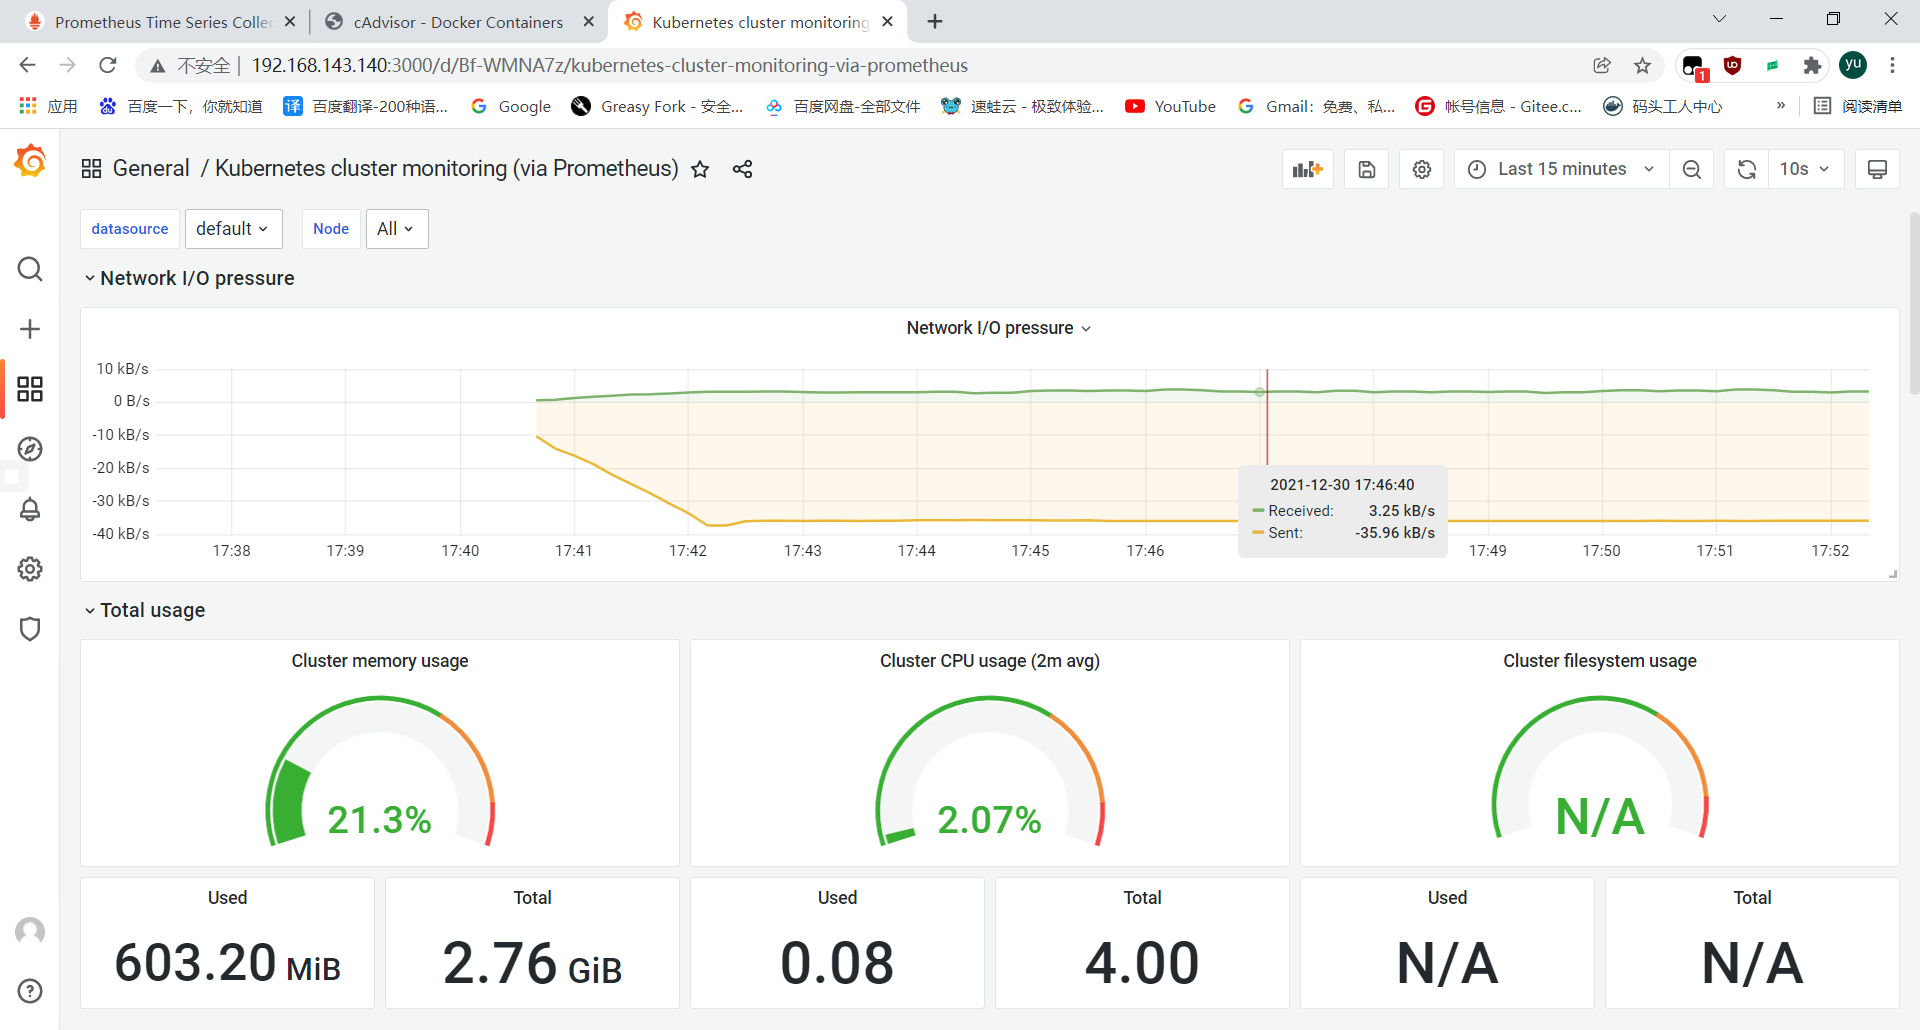
Cadvisor 进行收集,通过 Prometheus 作为数据源,利用 Grafana 进行展示。
环境说明:
已做工作可以参考上一篇文章Prometheus、Grafan基于docker部署
| 主机名 | IP | 部署功能 |
|---|---|---|
| master | 192.168.143.140 | Grafan 容器 Prometheus 容器 node_exporter |
| node1 | 192.168.143.141 | cadvisor容器 node_exporter |
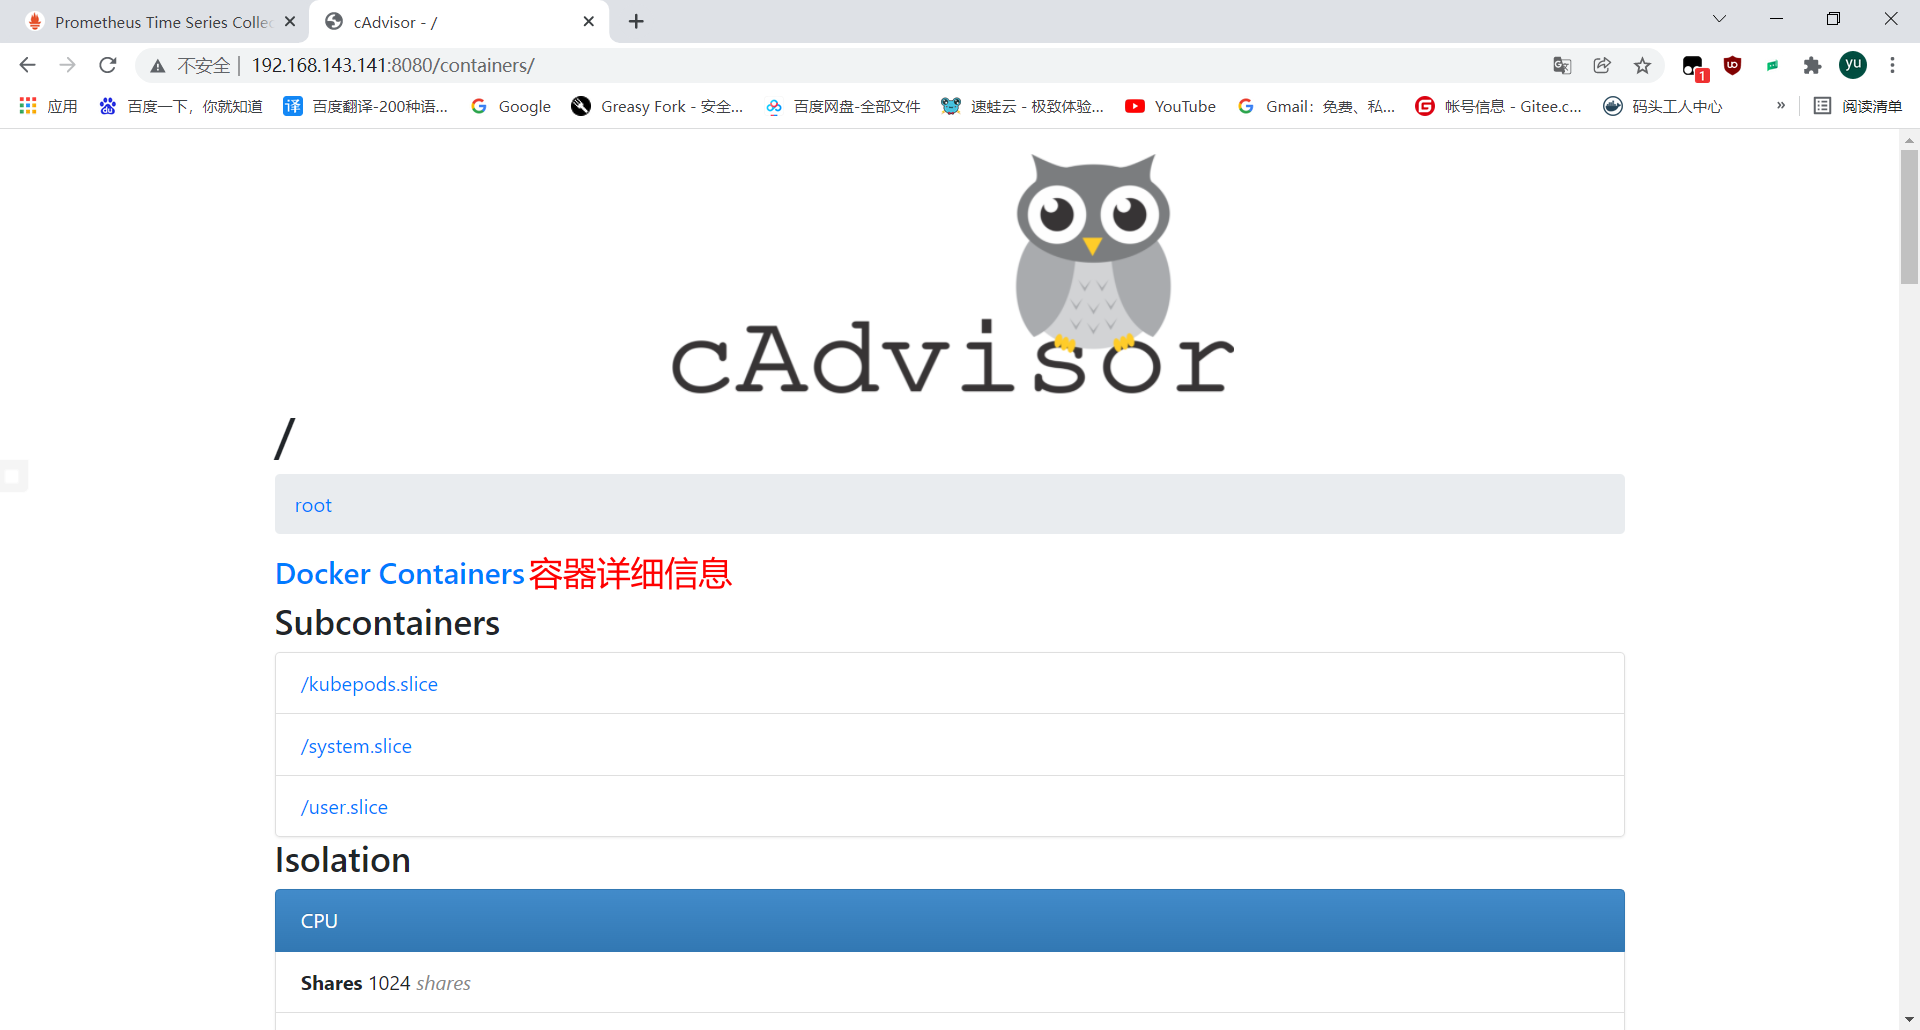
node1主机上 用此命令运行容器google/cadvisor官方镜像
docker run \
 --volume=/:/rootfs:ro \
 --volume=/var/run:/var/run:ro \
 --volume=/sys:/sys:ro \
 --volume=/var/lib/docker/:/var/lib/docker:ro \
 --volume=/dev/disk/:/dev/disk:ro \
 --publish=8080:8080 \
 --detach=true \
 --name=cadvisor \
 --privileged \
 --device=/dev/kmsg \
 google/cadvisor
[[email protected] ~]# docker run \
>  --volume=/:/rootfs:ro \
>  --volume=/var/run:/var/run:ro \
>  --volume=/sys:/sys:ro \
>  --volume=/var/lib/docker/:/var/lib/docker:ro \
>  --volume=/dev/disk/:/dev/disk:ro \
>  --publish=8080:8080 \
>  --detach=true \
>  --name=cadvisor \
>  --privileged \
>  --device=/dev/kmsg \
>  google/cadvisor
在 master 主机上配置prometheus.yml文件
使prometheus能够接受到node1采集的信息
[[email protected] ~]# vim /opt/prometheus.yml
# my global config
global:
  scrape_interval: 15s # Set the scrape interval to every 15 seconds. Default is every 1 minute.
  evaluation_interval: 15s # Evaluate rules every 15 seconds. The default is every 1 minute.
  # scrape_timeout is set to the global default (10s).

# Alertmanager configuration
alerting:
  alertmanagers:
    - static_configs:
        - targets:
          # - alertmanager:9093

# Load rules once and periodically evaluate them according to the global 'evaluation_interval'.
rule_files:
  # - "first_rules.yml"
  # - "second_rules.yml"

# A scrape configuration containing exactly one endpoint to scrape:
# Here it's Prometheus itself.
scrape_configs:
  # The job name is added as a label `job=<job_name>` to any timeseries scraped from this config.
  - job_name: "prometheus"

    # metrics_path defaults to '/metrics'
    # scheme defaults to 'http'.

    static_configs:
      - targets: ["192.168.143.140:9100"]
  - job_name: "Linux Server"
    static_configs:
      - targets:
        - 192.168.143.141:9100
        - 192.168.143.142:9100
//新增配置
  - job_name: "cadvisor Service "
    static_configs:
      - targets: ["192.168.143.141:8080"]
 //重启docker,也可以docekr restart   prometheus
[[email protected] ~]# systemctl restart docker
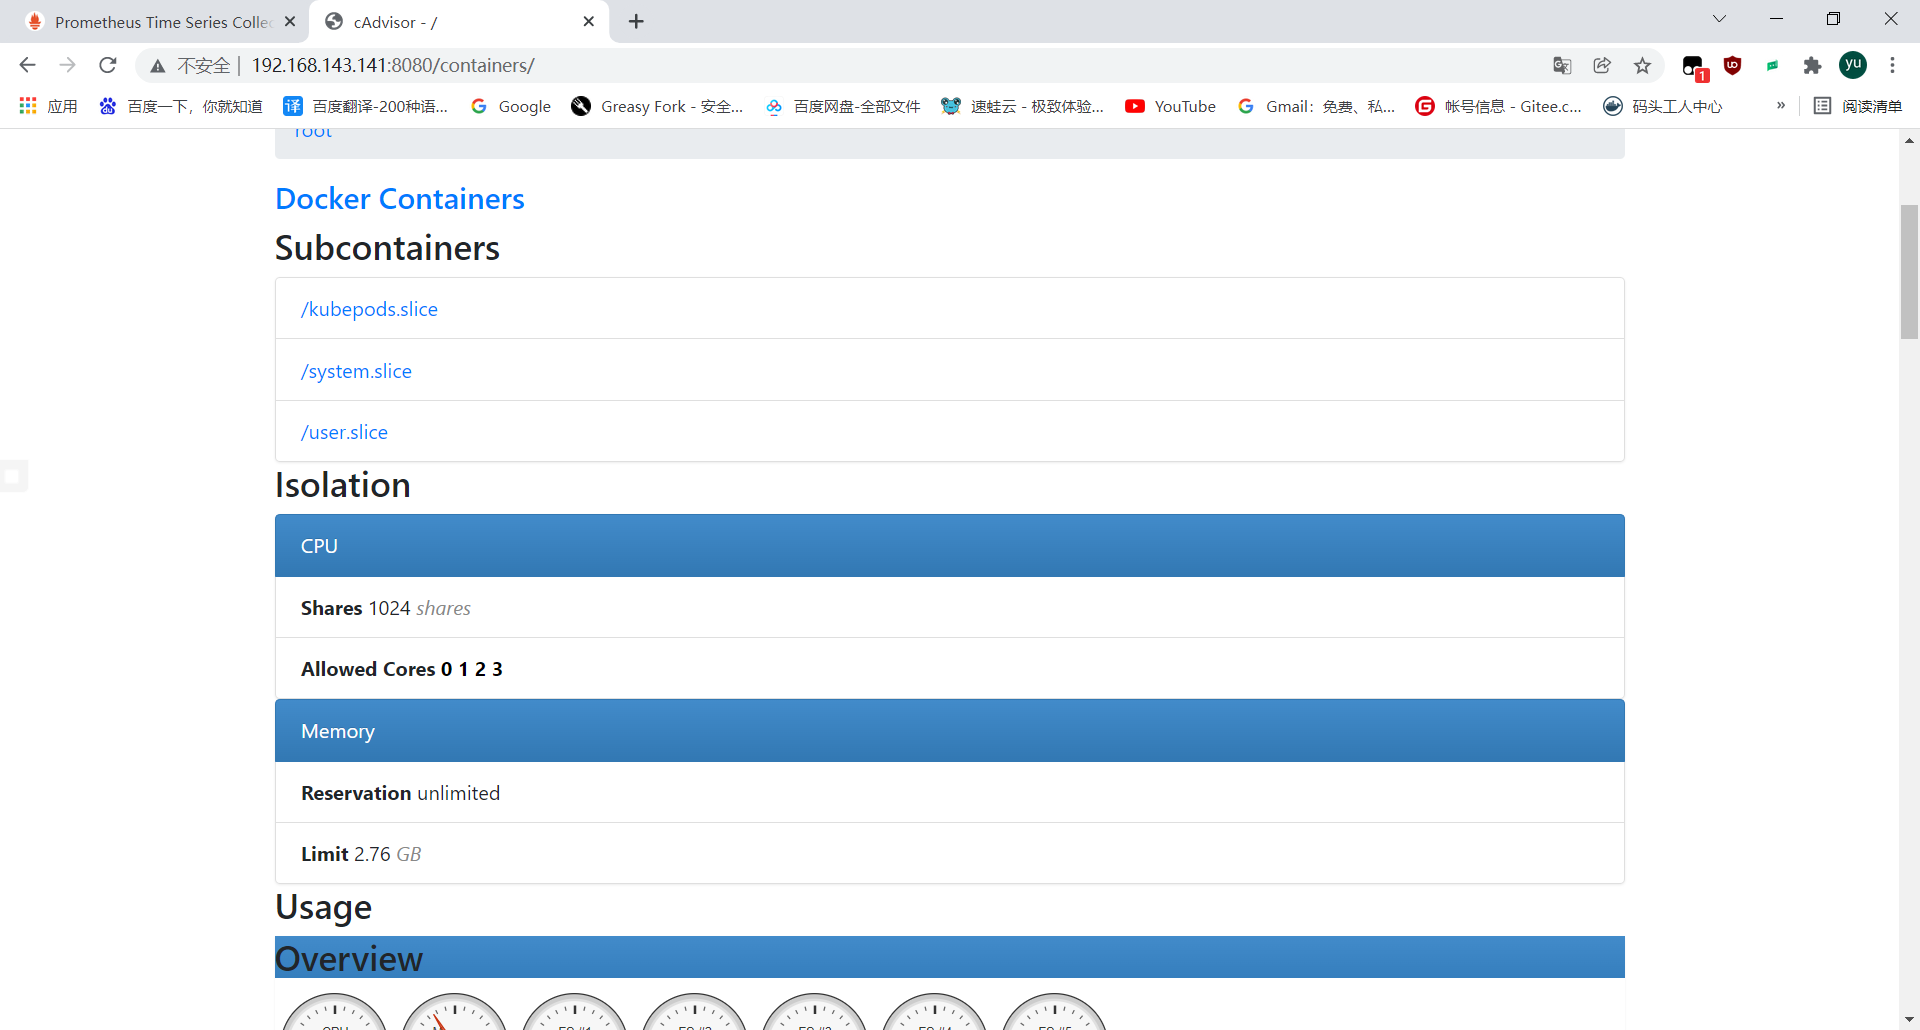
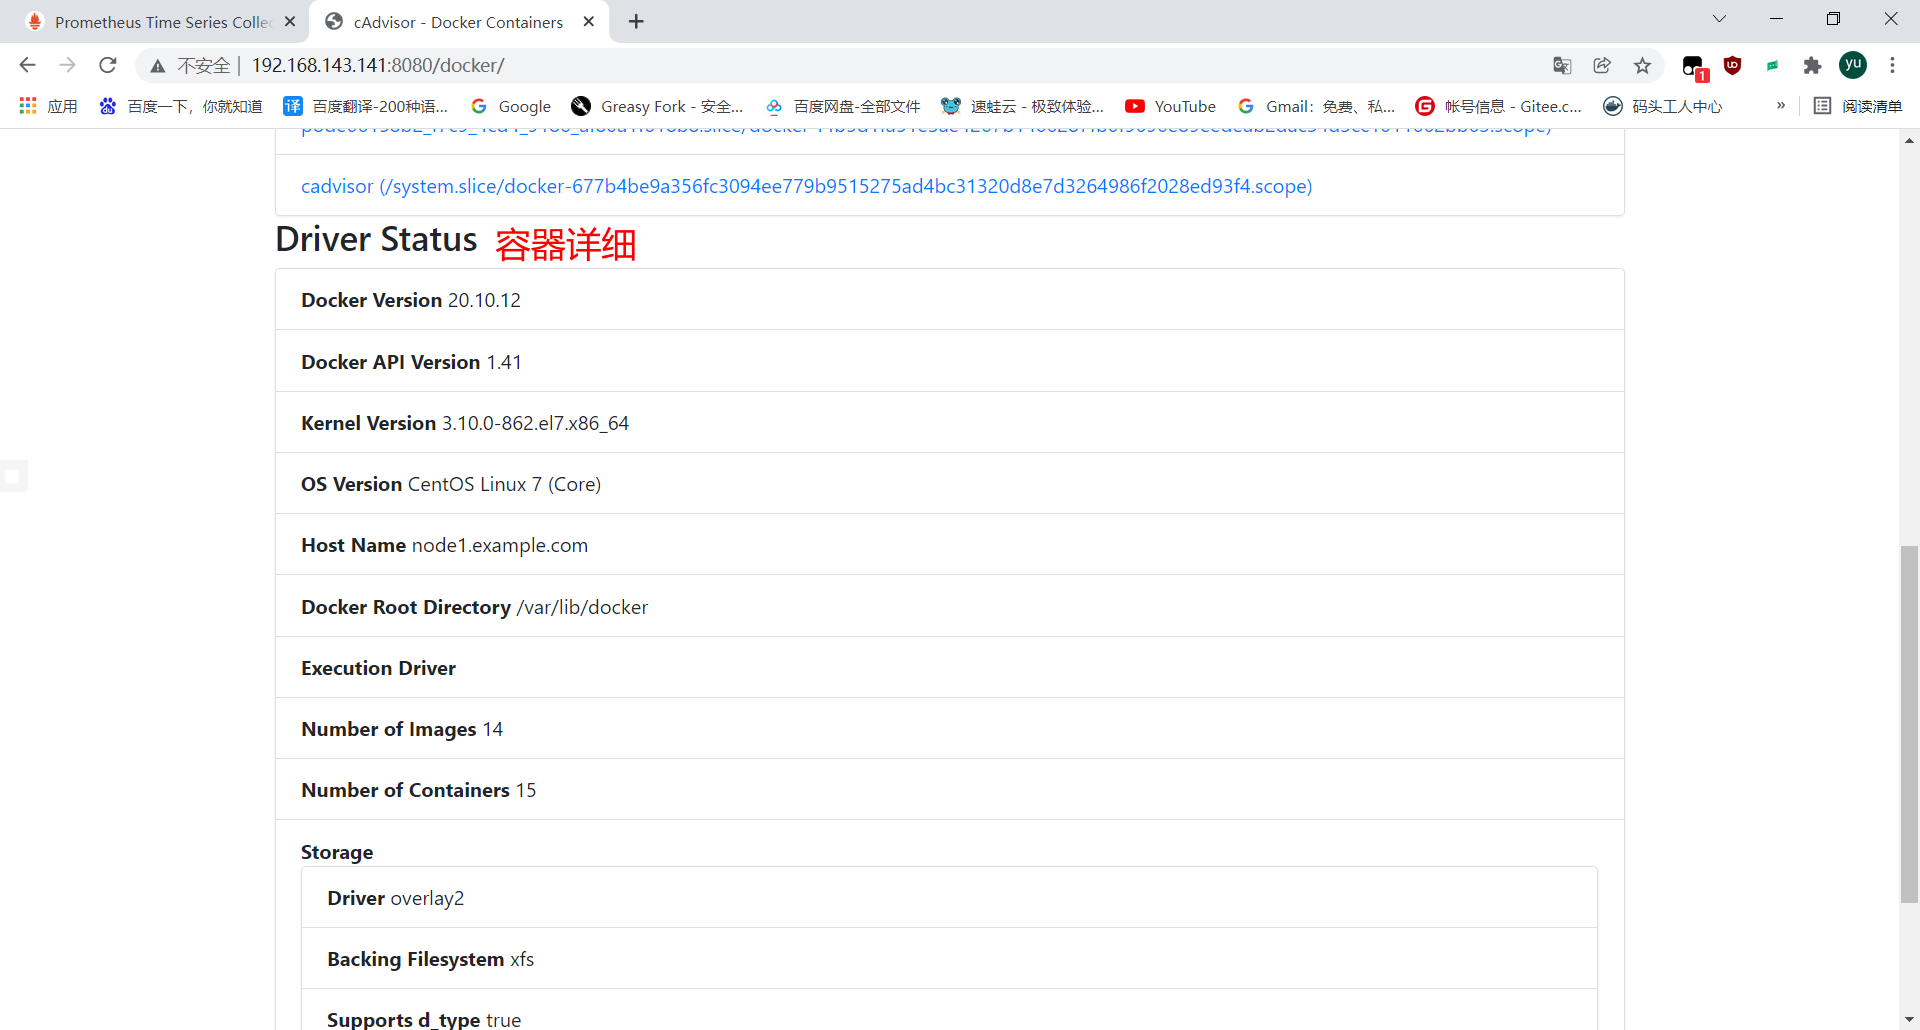
//master上面查看,监控状态发现有新的节点
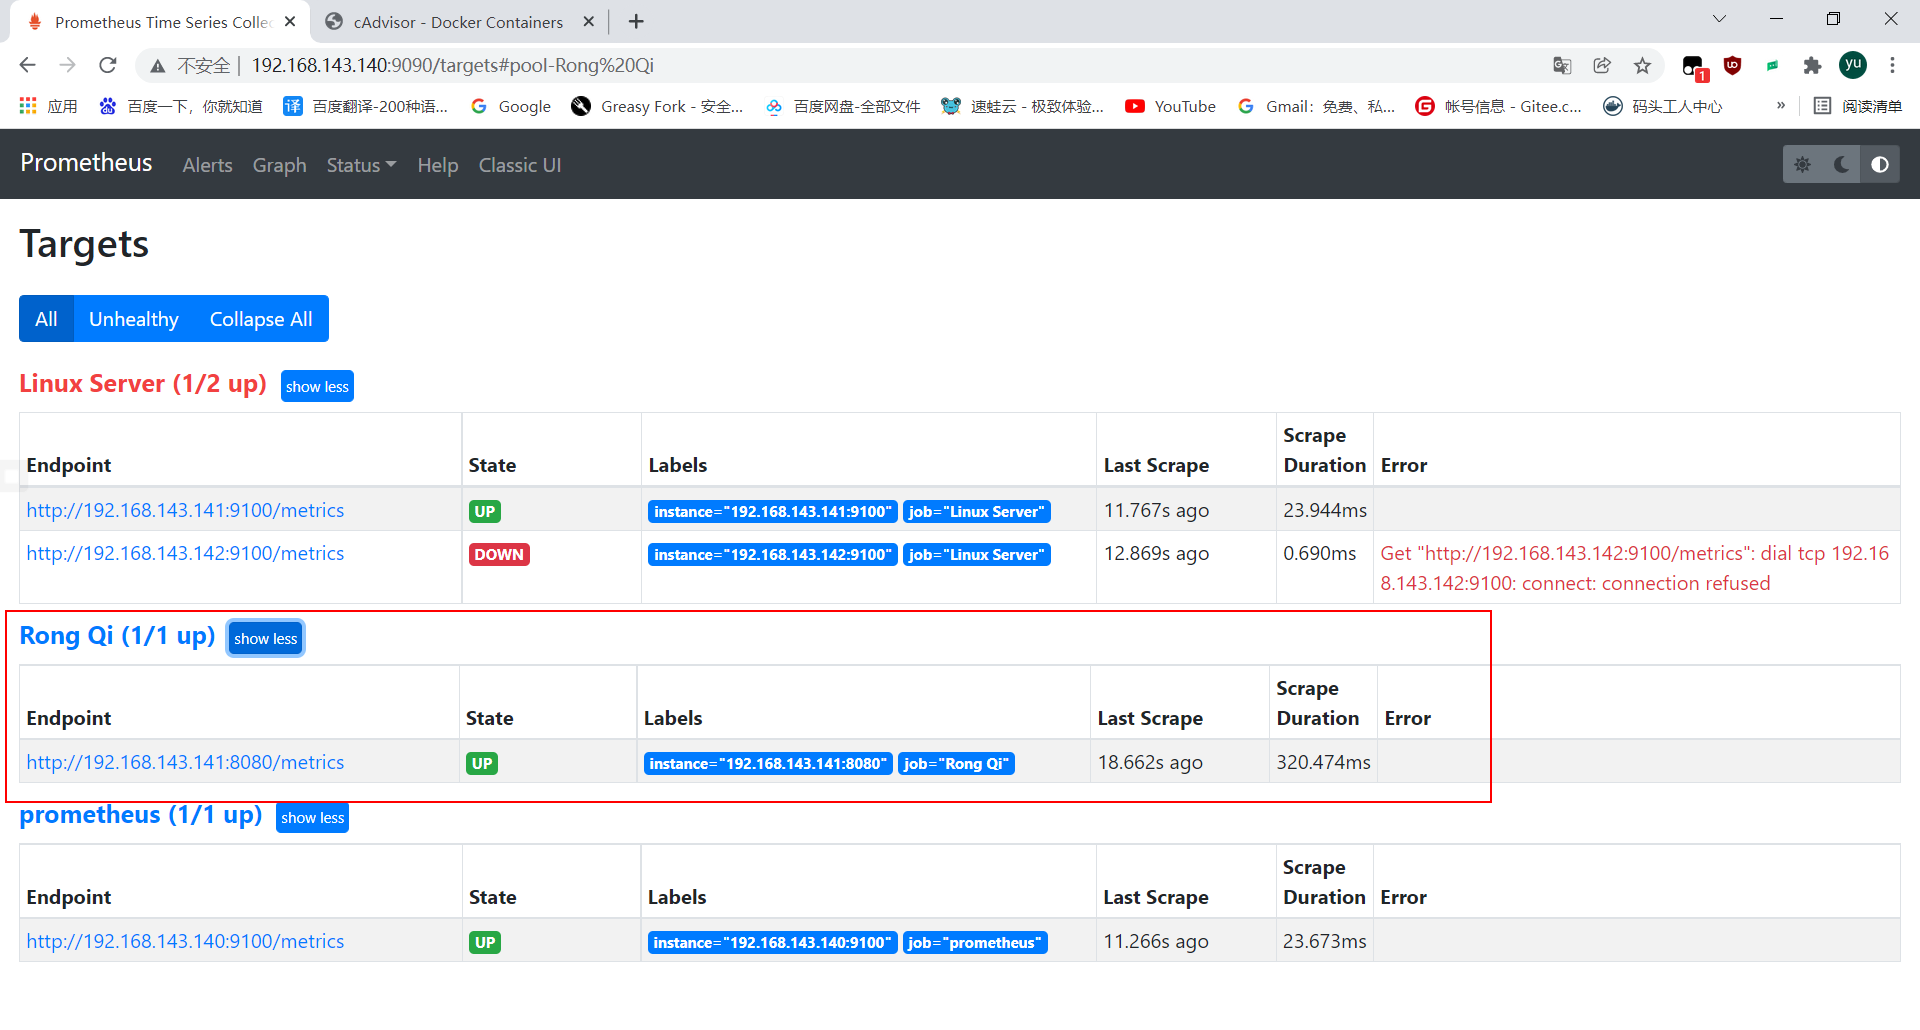
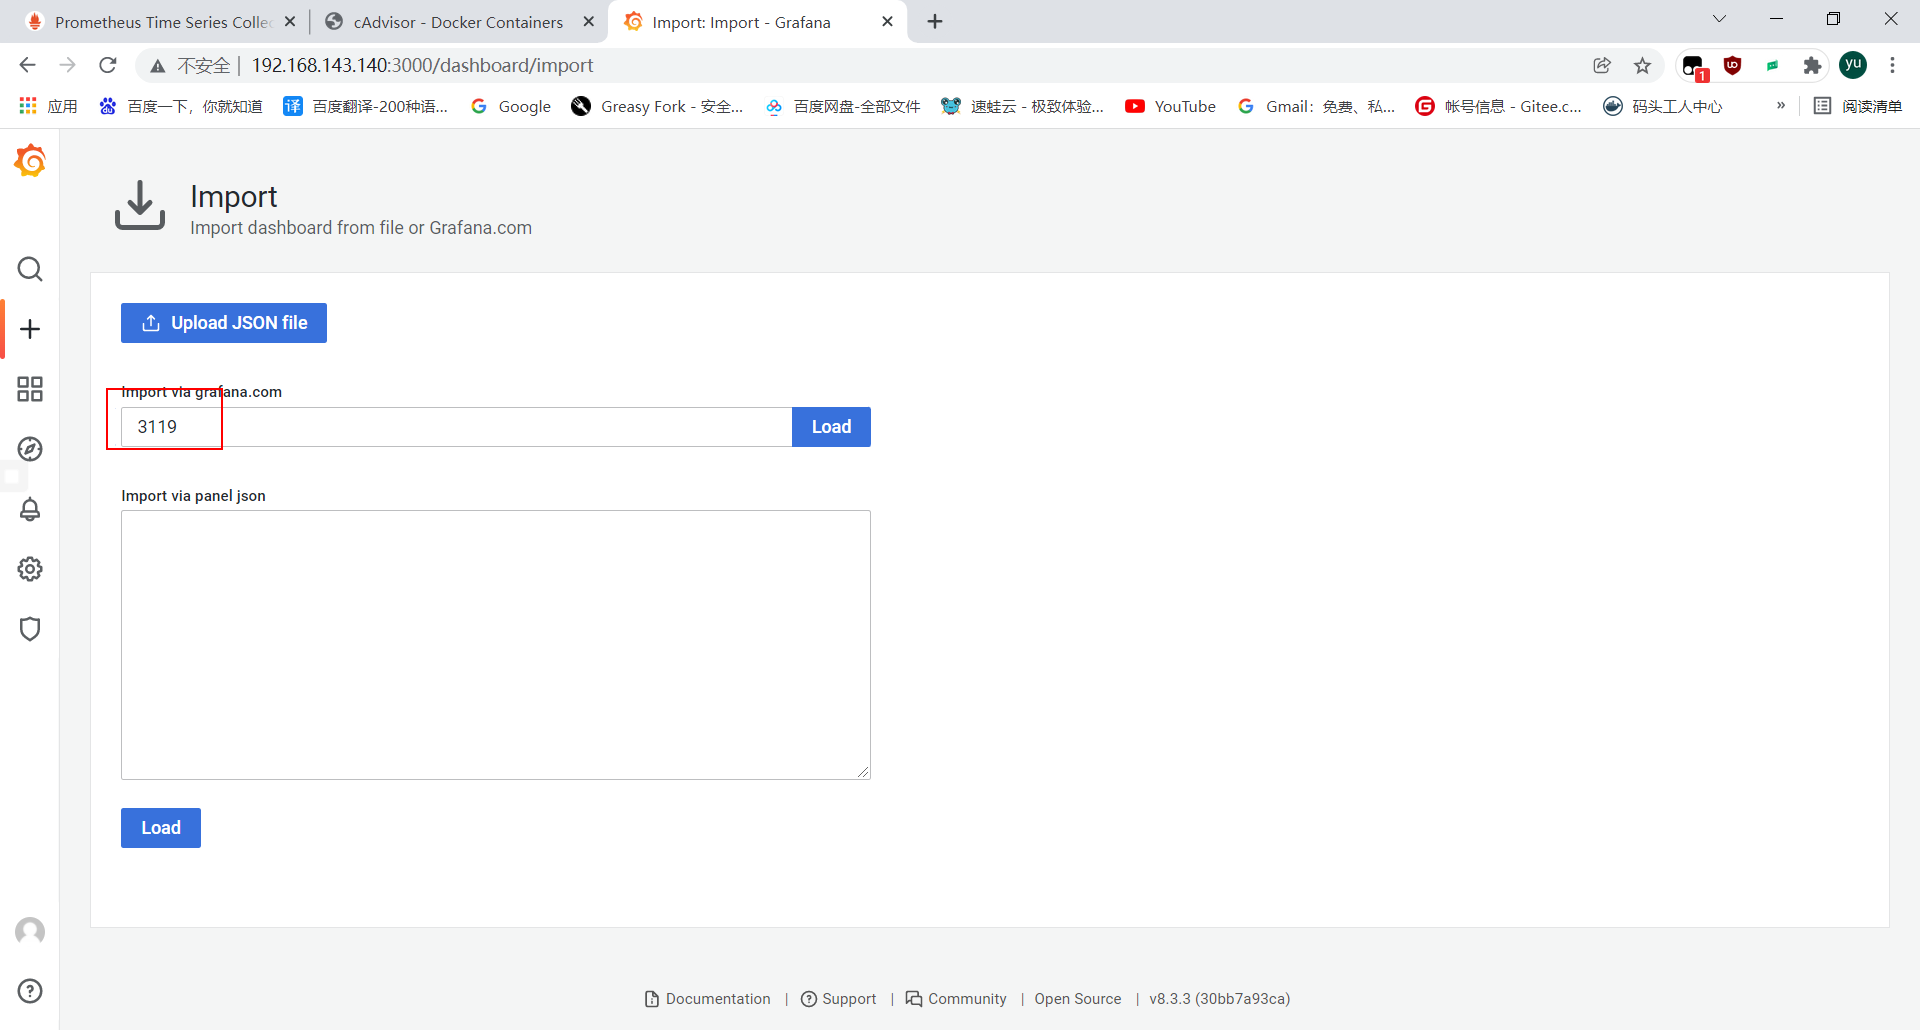
//发现原来的模板监控不了,此时添加新的模板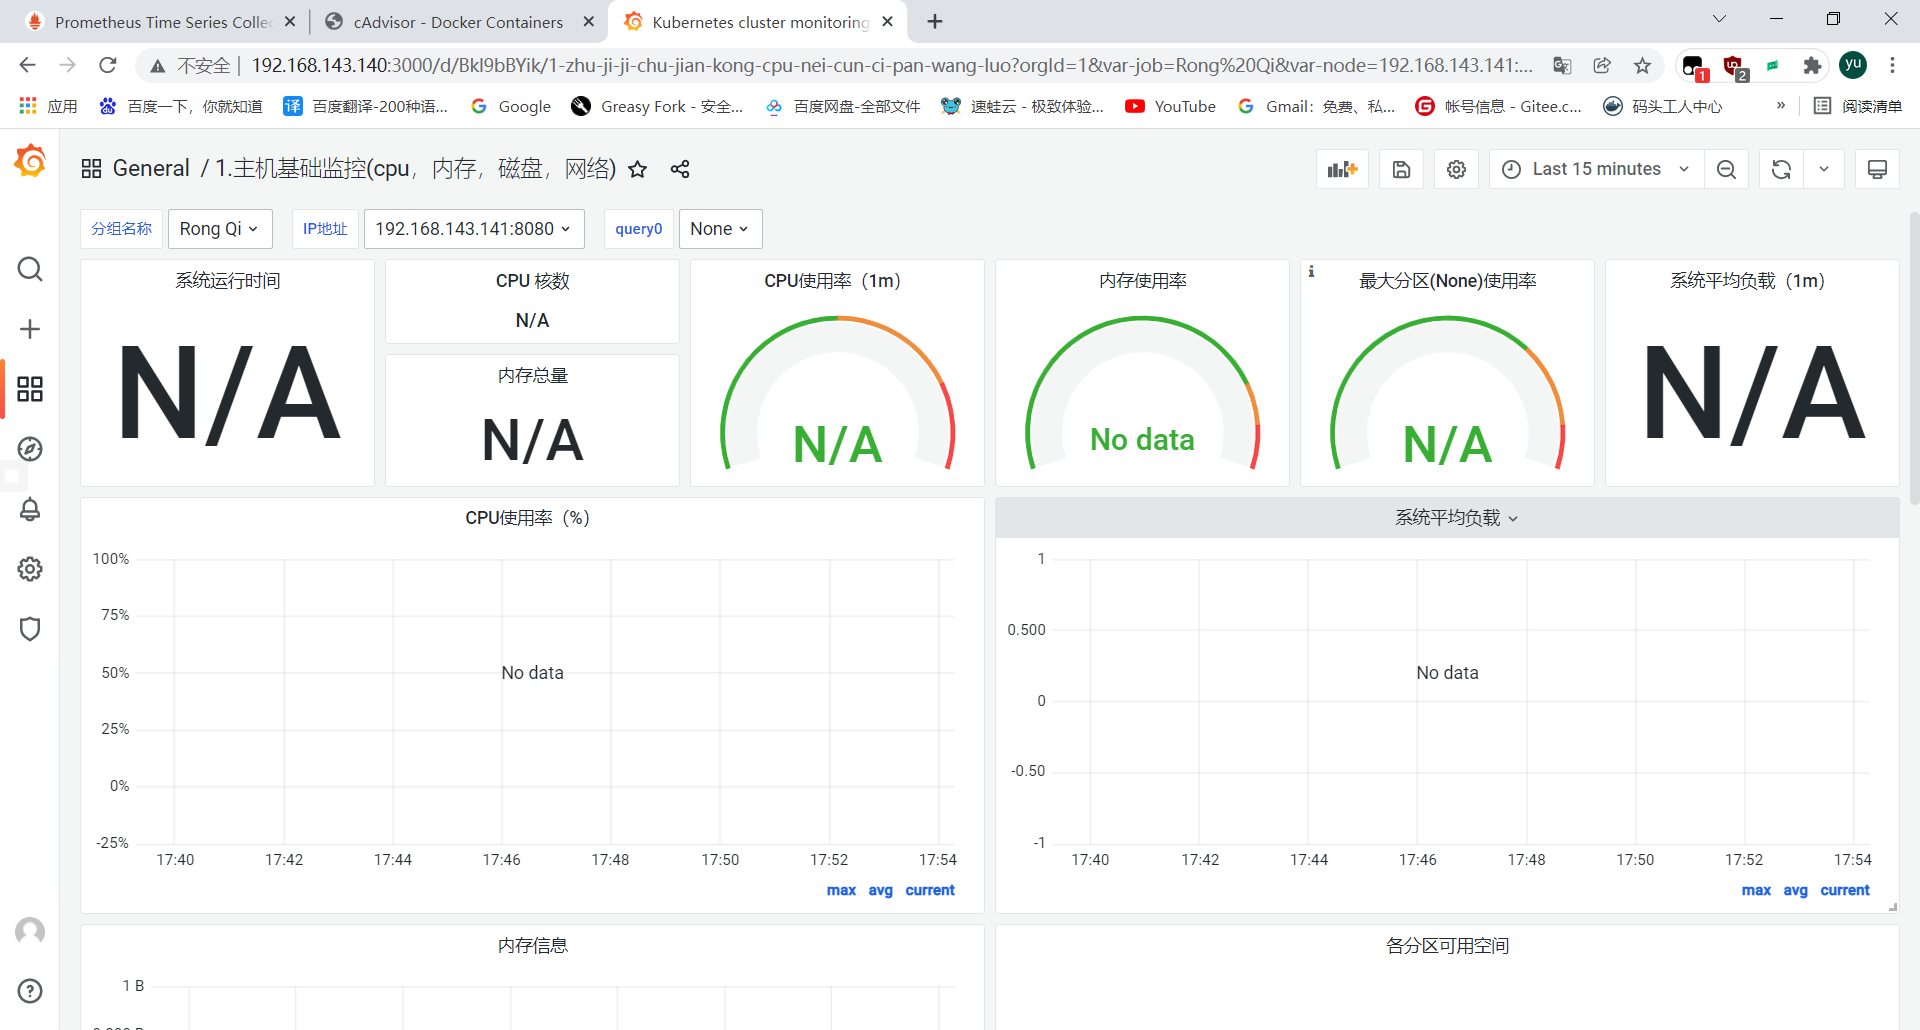
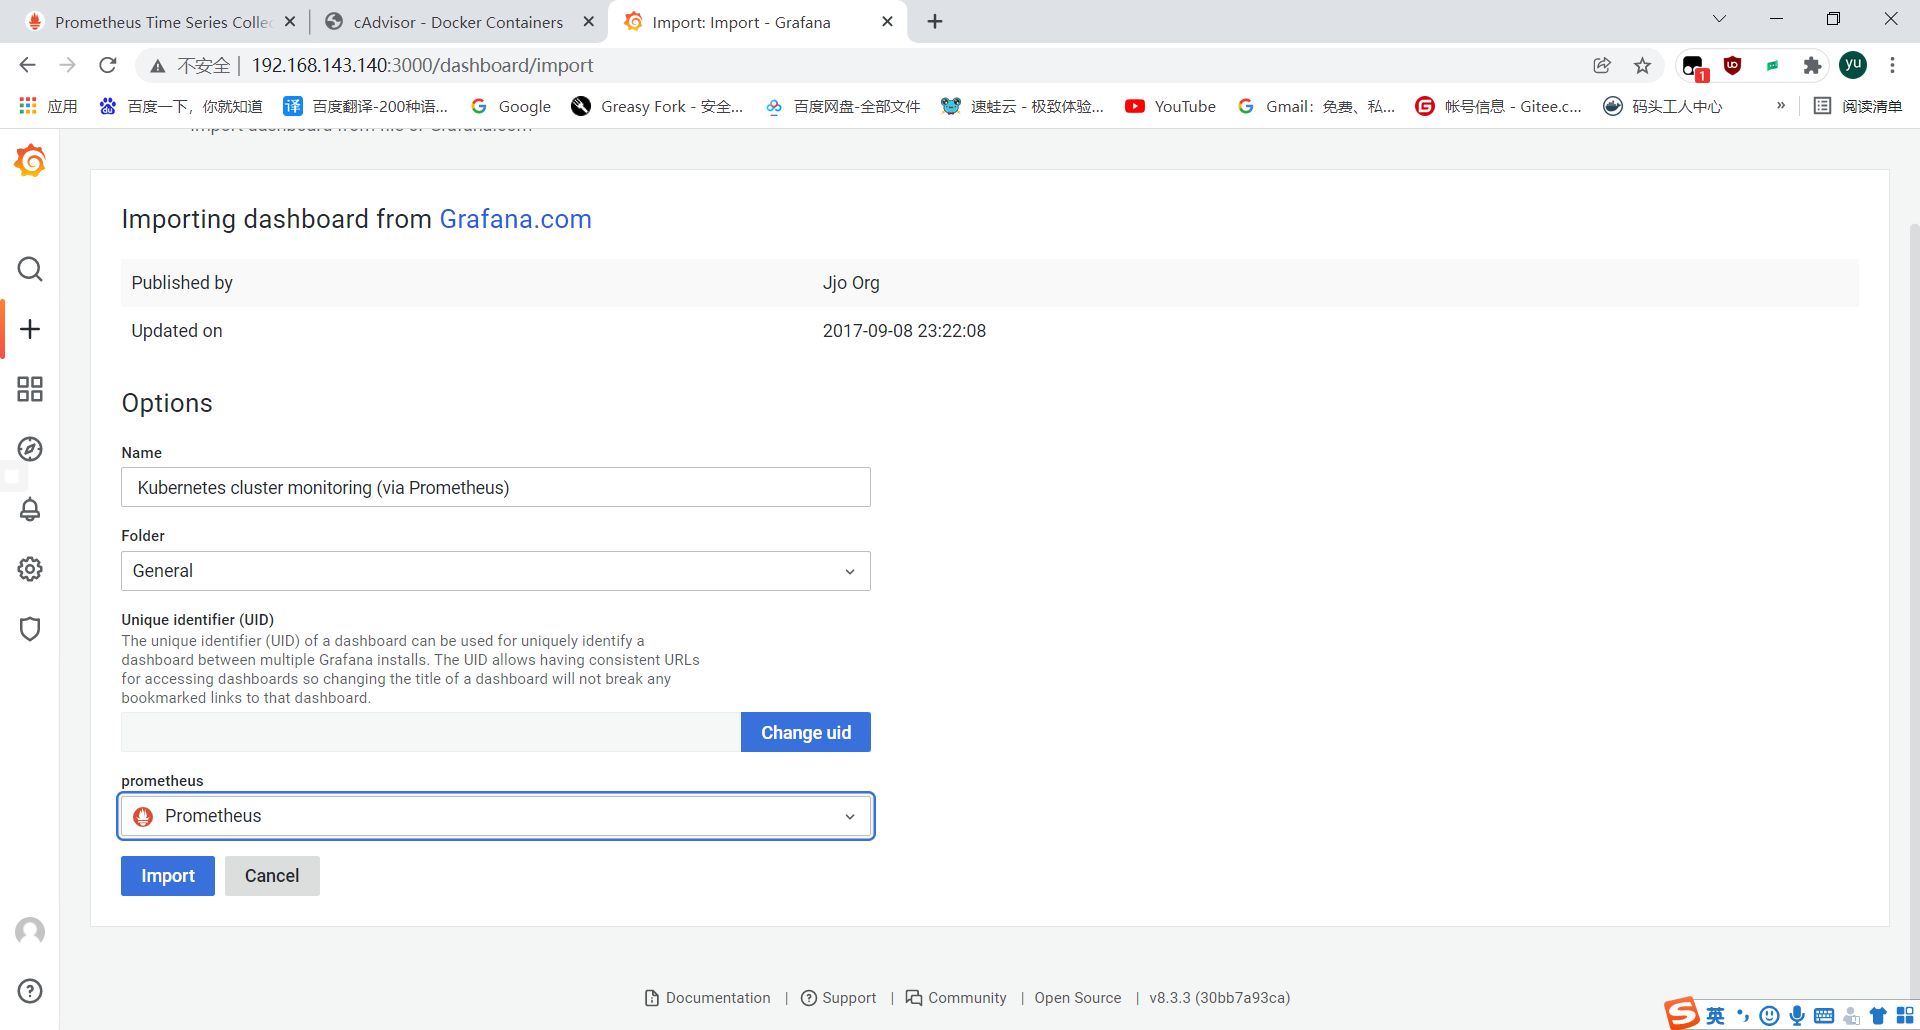
添加新的模板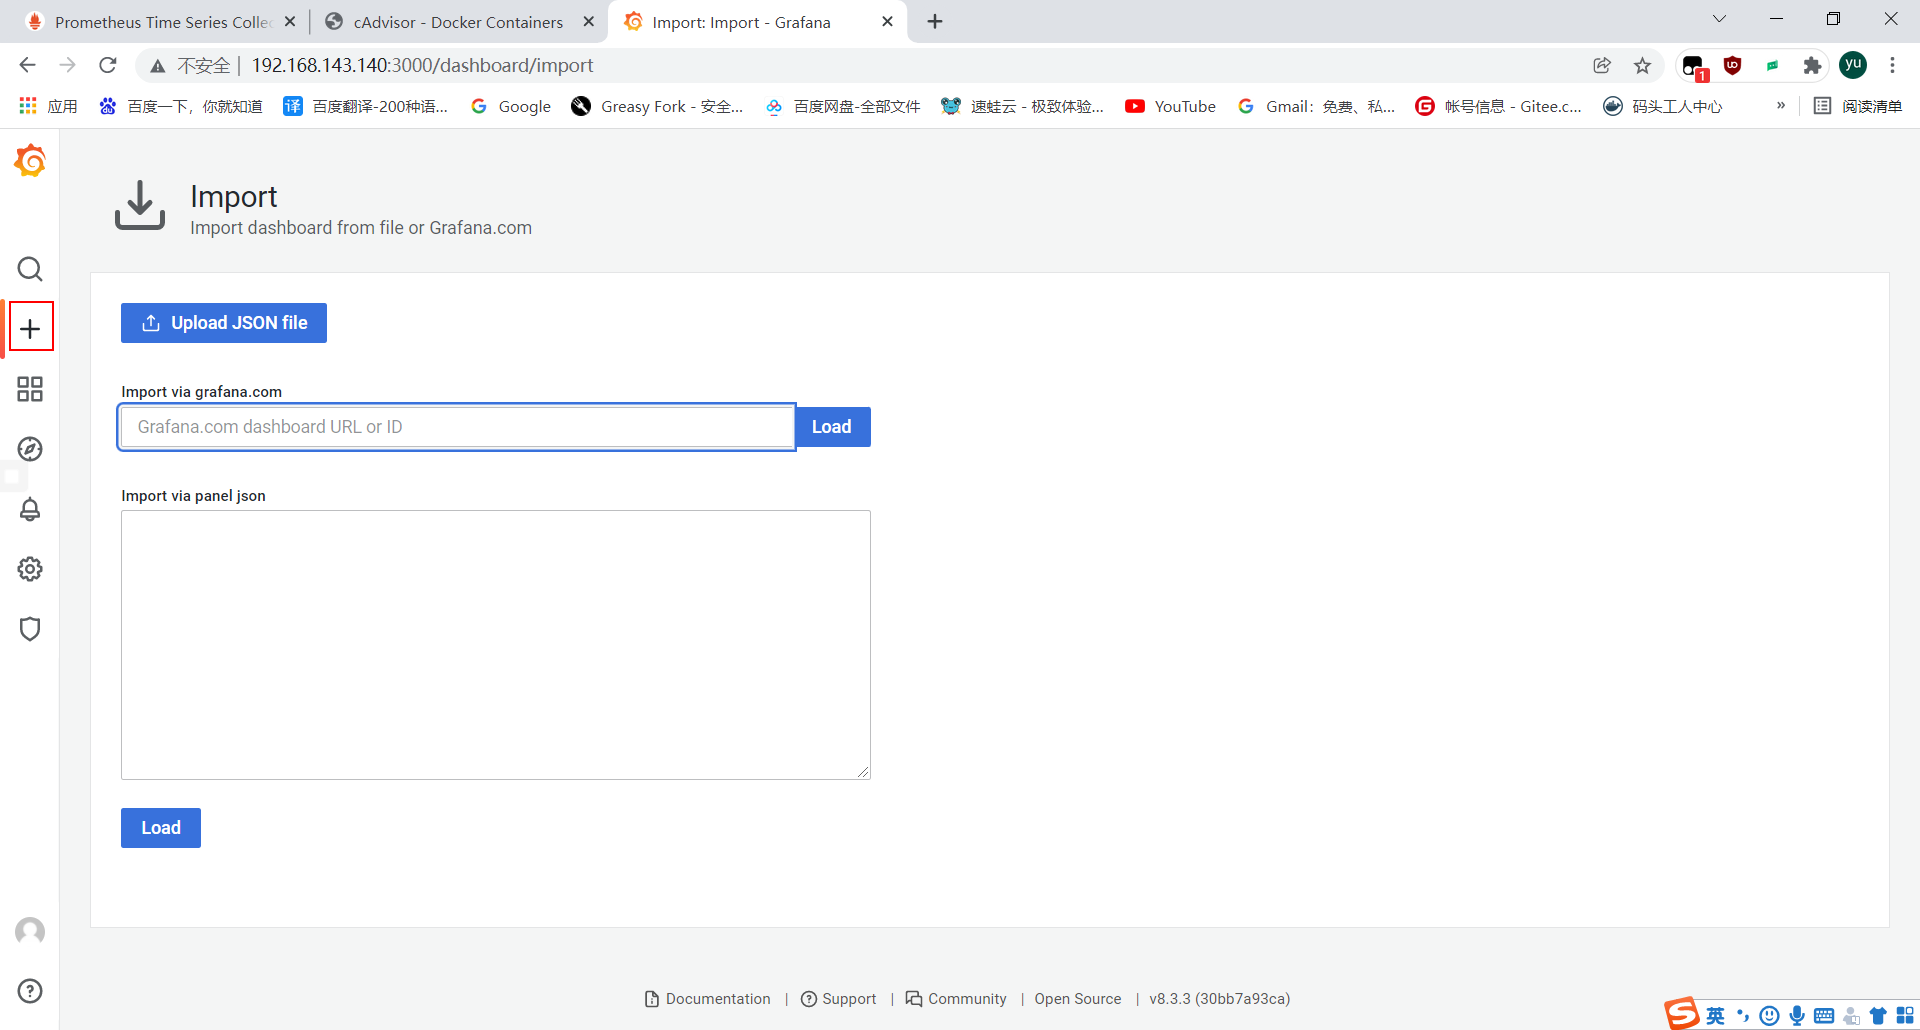
边栏推荐
猜你喜欢


随机推荐
PCB设计经验之模拟电路和数字电路区别为何那么大
3D建模为什么会变得无处不在
二层交换机,三层交换机,路由器内容总结记录
pandoc -crossref插件实现markdwon文档转word后公式编号自定义
域名管理常见问题:IP、域名和DNS之间的区别和关系
二分查找1-实现一个二分查找
二分查找2 - x的平方根
【C语言】关于数组传参问题/首地址
5. What is the difference between int and Integer?
9. Please introduce the class loading process, what is the parent delegation model?
ue4入门学习笔记1(操作界面)
六、对比Vector、ArrayList、LinkedList有何区别?(设计、性能、安全)
二分查找3 - 猜数字大小
Unity Animation从UAS获取动画资产到编制状态机控制简单的人物动画
数组与字符串15-最大连续1的个数
内网渗透信息收集
restful 常用状态码
数组与字符串12-数组拆分
次世代建模到底需要哪些美术基础
五、int和Integer有什么区别?