当前位置:网站首页>Prometheus deployment
Prometheus deployment
2022-07-02 23:04:00 【fangandpu】
Catalog
One 、Prometheus Deployment experiments
1.2 Deploy and monitor other nodes ( static state )
1.3 Deploy and monitor other nodes ( dynamic )
One 、Prometheus Deployment experiments
1.1 Deployment experiments
## Experiment preparation
## Turn off firewall
[[email protected] ~]# systemctl stop firewalld.service
[[email protected] ~]# setenforce 0
## Time synchronization
[[email protected] ~]# ntpdate ntp1.aliyun.com

## Download the installation package on the official website and unzip it
[[email protected] opt]# tar zxf prometheus-2.27.1.linux-amd64.tar.gz -C /usr/local/
[[email protected] opt]# cd /usr/local/prometheus-2.27.1.linux-amd64/

[[email protected] prometheus-2.27.1.linux-amd64]# ls
console_libraries  consoles  LICENSE  NOTICE  prometheus  prometheus.yml  promtool
## View the rule file
[[email protected] prometheus-2.27.1.linux-amd64]# cat prometheus.yml
[[email protected] prometheus-2.27.1.linux-amd64]# cat prometheus.yml
# my global config
global: // Global components
scrape_interval: 15s # Set the scrape interval to every 15 seconds. Default is every 1 minute. // How often do I grab indicators , Do not set default 15 second
evaluation_interval: 15s # Evaluate rules every 15 seconds. The default is every 1 minute.
# scrape_timeout is set to the global default (10s).# Alertmanager configuration // Butted altermanager( Third party alarm module )
alerting:
alertmanagers:
- static_configs:
- targets:
# - alertmanager:9093# Load rules once and periodically evaluate them according to the global 'evaluation_interval'.
rule_files: // Alarm rules
# - "first_rules.yml"
# - "second_rules.yml"# A scrape configuration containing exactly one endpoint to scrape:
# Here it's Prometheus itself.
scrape_configs:
# The job name is added as a label `job=<job_name>` to any timeseries scraped from this config.
- job_name: 'prometheus' // Indicators need to be labeled# metrics_path defaults to '/metrics' // The path to collect data
# scheme defaults to 'http'.static_configs: / about Prometheus The static configuration of the listening port, the specific data collection location Default port 9090
- targets: ['localhost:9090']
## Turn on monitoring
[[email protected] prometheus-2.27.1.linux-amd64]# ls
console_libraries  consoles  LICENSE  NOTICE  prometheus  prometheus.yml  promtool
[[email protected] prometheus-2.27.1.linux-amd64]# ./prometheus
Enter the monitoring address in the web page 
1.2 Deploy and monitor other nodes ( static state )
Static discovery default :static_config : Service discovery in the form of static configuration
① File based service discovery ;
② be based on DNS Service discovery of ;
③ be based on API Service discovery of :Kubernetes、Consul、Azure、 Re label 、target Re mark 、 metric Re mark
④ be based on K8S Service discovery of
##prometheus Want to monitor other nodes , You need to use node_exporter
## Put and unzip the installation package on the node server
[[email protected] opt]# tar zxf node_exporter-1.1.2.linux-amd64.tar.gz

## Toggle directory
[[email protected] opt]# cd node_exporter-1.1.2.linux-amd64
[[email protected] node_exporter-1.1.2.linux-amd64]# cp node_exporter /usr/local/bin

## Two node servers start the service
[[email protected] node_exporter-1.1.2.linux-amd64]# ./node_exporter
## close Prometheus Add node information to the server
[[email protected] prometheus-2.27.1.linux-amd64]# vim prometheus.yml
## Restart service after adding
[[email protected] prometheus-2.27.1.linux-amd64]# ./prometheus

  - job_name: 'nodes'
    static_configs:
    - targets:
        - 192.168.162.121:9100
        - 192.168.162.122:9100


The data collected by a single node is displayed

1.3 Deploy and monitor other nodes ( dynamic )
## If Prometheus Monitoring runs directly in the background
kill -9 Prometheus
File based service discovery is only slightly better than statically configured service discovery , It does not rely on any platform or third-party services , Therefore, it is also the simplest and most common implementation . prometheus server Load from file periodically target Information (pro-server pull Indicator discovery mechanism -job_name Get what I want pull The object of target) Files can be used only json and yaml Format , It contains defined target list , And optional label information ; The following is the first configuration , To be able to prometheus The default static configuration is converted to the configuration required for file based service discovery ;(prometheus Will periodically read 、 Reload the configuration in this file , So as to achieve dynamic discovery 、 Update operation )
## Create a directory to store the written yml file
[[email protected] prometheus-2.27.1.linux-amd64]# mkdir files_sd
[[email protected] prometheus-2.27.1.linux-amd64]# cd files_sd/
[[email protected] files_sd]# mkdir targets

## What will be written yml File import
[[email protected] files_sd]# ls
prometheus.yml  targets
[[email protected] files_sd]# cd targets/
[[email protected] targets]# cat prometheus_server.yaml
- targets:
  - 192.168.162.123:9090
  labels:
    app: prometheus
    job:  prometheus
[[email protected] targets]#

## Start... On the command line
[[email protected] prometheus-2.27.1.linux-amd64]# ./prometheus --config.file=./files_sd/prometheus.yml
## When a new node is added, it is directly in /usr/local/prometheus-2.27.1.linux-amd64/files_sd/targets/node Add records
[[email protected] targets]# cat nodes_centos.yaml
- targets:
- 192.168.162.101:9100
- 192.168.162.122:9100
- 192.168.162.121:9100
- 192.168.162.123:9100
labels:
app: node-exporter
job: node

1.4 Basic interface functions
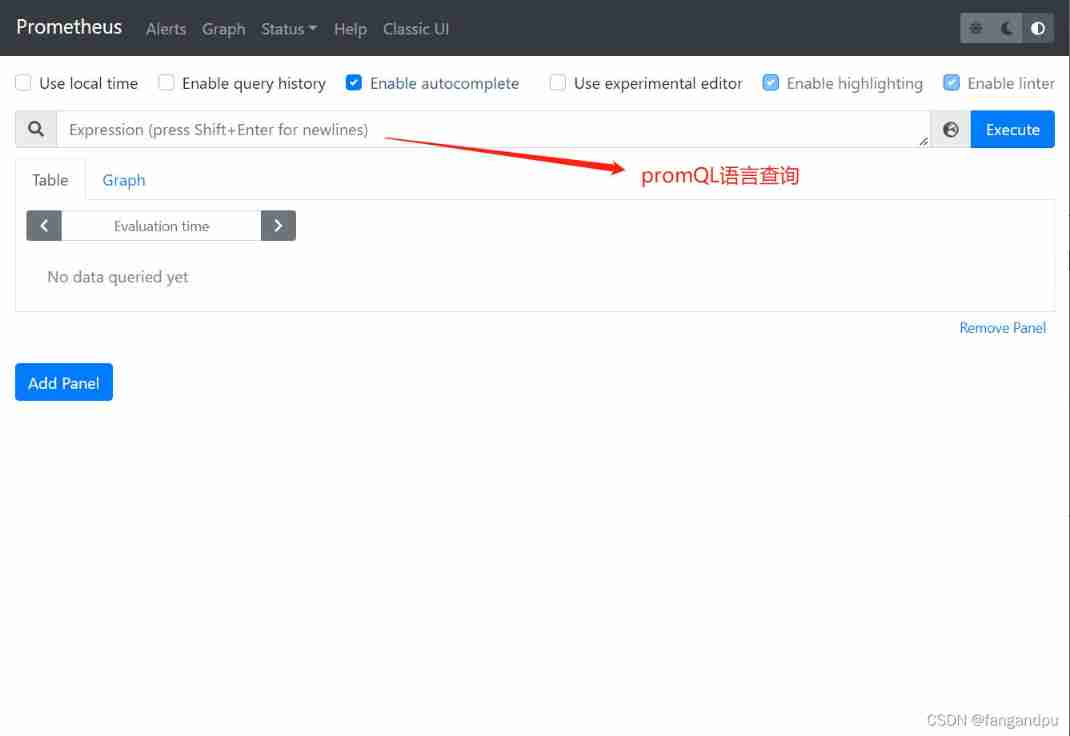


Two 、 Common query statements
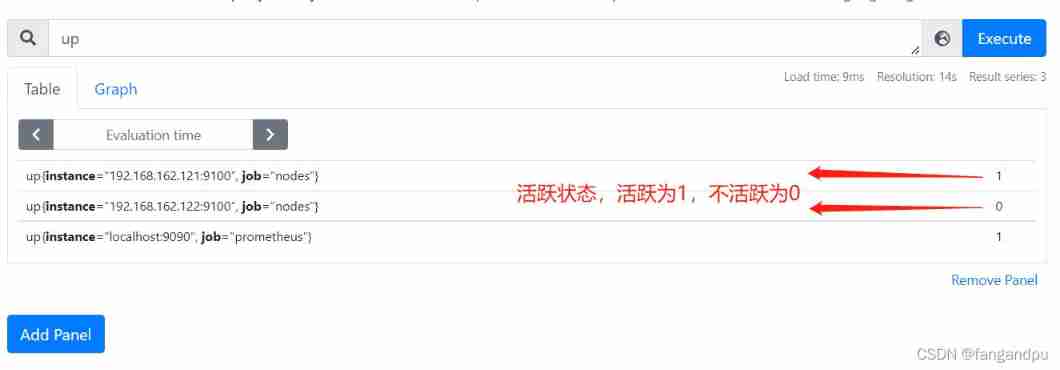
up Query active status

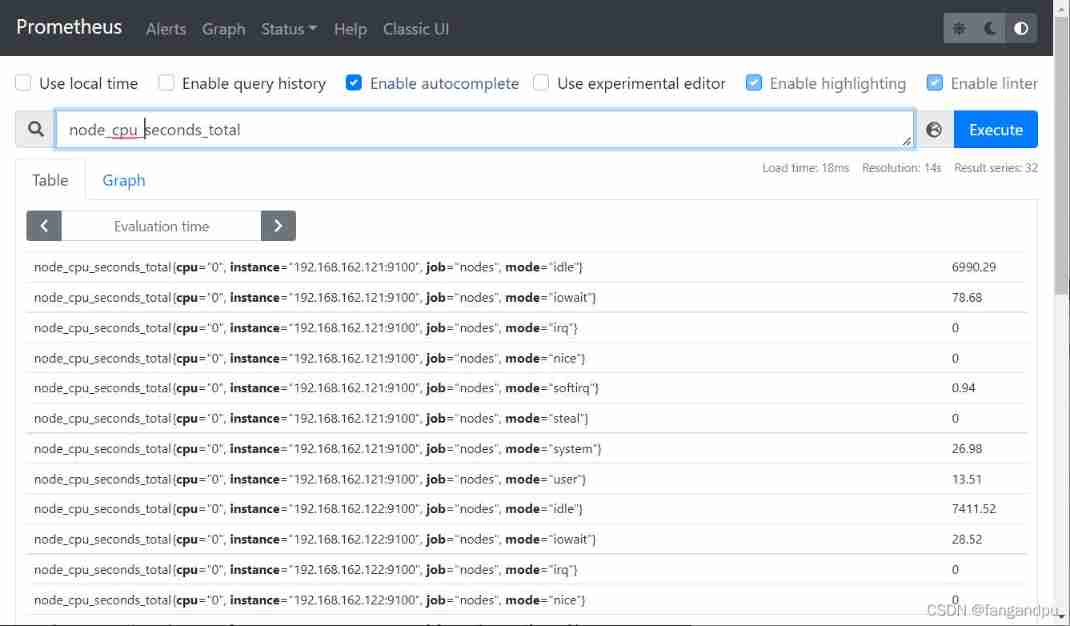
## see cpu Total amount
node_cpu_seconds_total
## Look at the first one cpu Idle state of
node_cpu_seconds_total{cpu="0",mode="idle"}

## Count the first cpu In the past 5 Minutes of the CPU Rate of use ( The data queried is double precision floating point )
irate(node_cpu_seconds_total{cpu="0",mode="idle"}[5m])
analysis :
irate: Rate calculation function ( Very sensitive )
node_cpu_seconds_total:node node CPU Total usage
mode="idle" Idle indicator 5m: In the past 5 Within minutes , all CPU Sample value of idle number , Do rate calculation for each value

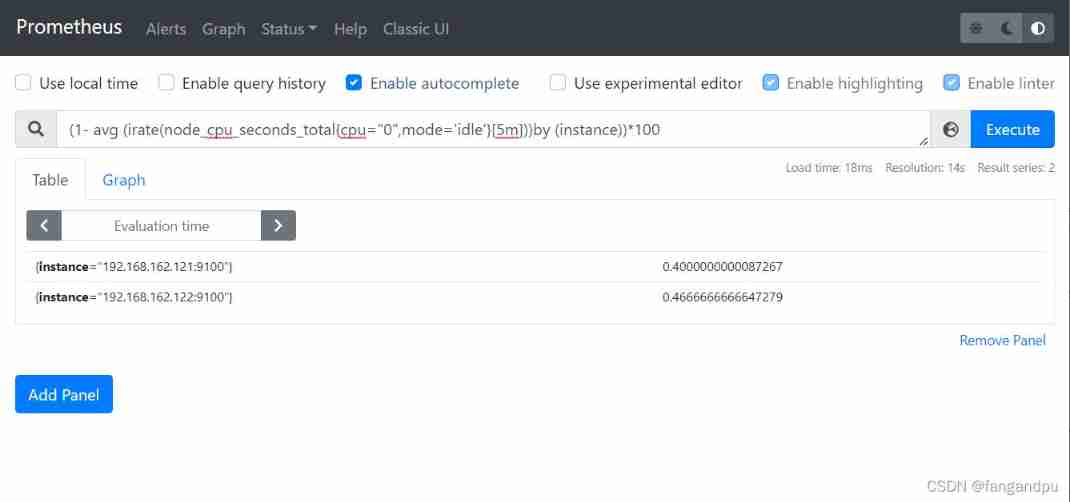
## first cpu The average usage rate of
1- avg(irate(node_cpu_seconds_total{cpu="0",mode="idle"}[5m]))

## Every mainframe CPU One of the first cpu stay 5 Average usage within the group
(1- avg (irate(node_cpu_seconds_total{cpu="0",mode='idle'}[5m]))by (instance))*100
边栏推荐
- PMP project integration management
- 详解Promise使用
- 力扣刷题(2022-6-28)
- Jerry's prototype will trigger shutdown after multiple touches [chapter]
- boot actuator - prometheus使用
- [chestnut sugar GIS] ArcScene - how to make elevation map with height
- Qt QScrollArea
- Jerry's fast touch does not respond [chapter]
- Introduction and response to high concurrency
- 数据分析学习记录--用EXCEL完成简单的单因素方差分析
猜你喜欢
![[hardware] origin of standard resistance value](/img/d1/b9184c508d363eb0fa018ea6a57a10.png)
[hardware] origin of standard resistance value

Introduction to the latest plan of horizon in April 2022

Lambda expression: an article takes you through

Data analysis learning records -- complete a simple one-way ANOVA with Excel

严守工期,确保质量,这家AI数据标注公司做到了!
Odoo13 build a hospital HRP environment (detailed steps)

AES高級加密協議的動機闡述

Higher order operation of bits

力扣刷题(2022-6-28)
MySQL queries nearby data And sort by distance
随机推荐
[leetcode] most elements [169]
[NPUCTF2020]ezlogin xPATH注入
Learning records of data analysis (II) -- simple use of response surface method and design expert
Innovation strength is recognized again! Tencent security MSS was the pioneer of cloud native security guard in 2022
Strictly abide by the construction period and ensure the quality, this AI data annotation company has done it!
QT qpprogressbar details
STM32之ADC
大一学习分享
Tronapi-波场接口-源码无加密-可二开--附接口文档-基于ThinkPHP5封装-作者详细指导-2022年7月1日08:43:06
Construction of Hisilicon 3559 universal platform: rotation operation on the captured YUV image
Splunk audit 的设定
Higher order operation of bits
力扣刷题(2022-6-28)
ServletContext learning diary 1
The motivation of AES Advanced Encryption Protocol
mysql重置密码,忘记密码,重置root密码,重置mysql密码
[Yangcheng cup 2020] easyphp
Hanging mirror security won four global infosec awards on rsac2022
详解Promise使用
静态文件显示问题