当前位置:网站首页>Troubleshooting of high CPU load but low CPU usage
Troubleshooting of high CPU load but low CPU usage
2022-07-03 06:49:00 【The way of research and development】
Tell a story
Recently, services have always appeared cpu load High alert , And the alarm often appears in the early morning of low peak period , Therefore, it is obviously not the high load caused by user traffic , however cpu buzy But very low . View memory usage :mem.memused near 100%, Check the disk status :swap.used periodic (30 About minutes ) Higher , disk.io.util low , however disk.io.avgqu-sz( Average request queue length ) periodic (30 About minutes ) Higher , And and cpu load high Same frequency . The machine was checked later crontab -l, The viewing cycle is 30 Minutes of scheduled tasks , It is found that the scheduled task is puppet, And check the execution time and cpu load High is also right . Therefore, many of the above phenomena resonate at the same frequency , We can only show that these phenomena are strongly correlated , It's like “ The story of beer and diapers “, But what is the specific logical attribution chain ? Every link in the chain needs evidence .
Conclusion
`mem.memused`  high (OS Out of memory )
			-> `swap.used` high  -> `disk.io.avgqu-sz` Disk operation queued  -> "cpu load" high  ->  Trigger alarm
`puppet` Periodic tasks a large number of disk reads
To analyze problems
Our machine memory 8G.JVM Parameters :
-Xmx6g -Xms6g -Xmn3g
- Question 1 : Why?
mem.memusedHave been steadily approaching 8G? and jvm Definition 6G Only half used , It's impossible to fill up 8G?memused = MemTotal - MemFree - Buffers/Cached. Look at the formula of statistical method , as long as jvm Do not release memory to the operating system ,Buffers/CachedandMemFreeThe size of will not change .jvm Of GC Just logical memory release , But still jvm Managed by , It's not a physical release ( therefore top View the Java process RES Columns use memory 6G about ). So it's likejvm.memory.usedIndicators will be sensitive to tracking GC It brings jvm Memory changes . From the operating system level, it is close to use 6G 了 . - Question two : Why is memory usage so high that swap Partition ?
When applying for the machine, you installed tomcat( In fact, you don't need ), After service deployment , There are two on the machine Java process , One of them is tomcat Starting up , Observe its memory usage through the following command 1.5G about .
[[email protected] ~]$ ps -p 3408 -o rss,vsz
  RSS    VSZ
1554172 8672328
With business services JVM Memory more and more memory is requested from the operating system , Can pass top Command to see RES The columns gradually grow to close 6G. Total memory usage = JVM1(6G) + JVM2(tomcat 1.5G)+ Not JVM Memory . Lead to OS Finally, the available memory is insufficient , And then use swap Partition
- Question 3 : Why?
cpu loadHigh and highcpu usage low ?
Waiting disk I/O Too many processes completed , The length of the process queue is too large , however cpu Very few processes are running , The load is too large ,cpu Low usage . - Question 4 : Why are there many disk request queues It can lead to
cpu loadhigh ?
uptime and top You can see it when you wait for orders load average indicators , Three numbers from left to right represent 1 minute 、5 minute 、15 Minutes of load average:
$ uptime
11:44:47  up 46 days 14:54,  2 users,  load average: 2.98, 3.08, 3.02
- If the average is 0.0, It means that the system is idle
- If 1min The average is higher than 5min or 15min Average , Then the load is increasing
- If 1min The average value is lower than 5min or 15min Average , Then the load is decreasing
- If they are higher than the system CPU The number of , Then the system is likely to encounter performance problems ( As the case may be )
stay Linux in , For the whole system ,load averages yes “system load averages”, Measure the number of running and waiting threads (CPU, disk , Uninterrupted lock ), Include uninterruptible sleep The number of processes . Unlike other operating systems cpu load The definition of ,Linux It's not just about CPU The load of resources . advantage : It includes the demand for different resources .
When you see load average When it's high , You don't know it's runnable Too many processes or uninterruptible sleep There are too many processes , It is impossible to judge CPU Not enough or IO The device has a bottleneck .
The process is in cpu The above operation requires access to disk files , This is the time cpu Will make a request to the kernel to call the file , Let the kernel pass DMA Way to get files from disk , At this time, it will switch to other processes or idle , This task will be transformed into uninterruptible sleep state . When there are too many read and write requests, it will lead to uninterruptible sleep There are too many processes in the state , This results in a high load ,cpu Low case .
#define LOAD_FREQ (5*HZ+1) /* 5 sec intervals */
* The global load average is an exponentially decaying average of nr_running +
 * nr_uninterruptible.
 *
 * Once every LOAD_FREQ:
 *
 *   nr_active = 0;
 *   for_each_possible_cpu(cpu)
 *  nr_active += cpu_of(cpu)->nr_running + cpu_of(cpu)->nr_uninterruptible;
 *
 *   avenrun[n] = avenrun[0] * exp_n + nr_active * (1 - exp_n)
HZ is the kernel timer frequency, which is defined when compiling the kernel. On my system, it’s 250:
% grep "CONFIG_HZ=" /boot/config-$(uname -r)
CONFIG_HZ=250
solve the problem
- Remove the pre installed tomcat Software
- Reduce JVM Maximum heap usage configured
Problem solved . ️ !
Reference material :
appendix :
top command :
[[email protected] ~]# top
top - 12:13:22 up 167 days, 20:47,  2 users,  load average: 0.00, 0.01, 0.05
Tasks: 272 total,   1 running, 271 sleeping,   0 stopped,   0 zombie
%Cpu(s):  0.0 us,  0.1 sy,  0.0 ni, 99.9 id,  0.0 wa,  0.0 hi,  0.0 si,  0.0 st
KiB Mem : 65759080 total, 58842616 free,   547908 used,  6368556 buff/cache
KiB Swap:  2097148 total,  2097148 free,        0 used. 64264884 avail Mem
................

 The explanation for the third line above :
us(user cpu time): In user mode cpu Time ratio . When the value is high , Explain what the user process consumes  CPU  More time , such as , If the value exceeds for a long time  50%, We need to optimize the program algorithm or code .
sy(system cpu time): System state cpu Time ratio .
ni(user nice cpu time): Used as a nice Weighted process assigned user state cpu Time ratio
id(idle cpu time): Idle cpu Time ratio . If the value continues to be 0, meanwhile sy yes us Twice as many , Generally speaking, the system is faced with  CPU  The shortage of resources .
wa(io wait cpu time):cpu Wait for disk write completion time . When the value is high , explain IO Waiting is more serious , This may be caused by random access to a large number of disks , Or there may be a bottleneck in disk performance .
hi(hardware irq): Hard interrupts take time
si(software irq): Soft interrupt consumes time
st(steal time): Virtual machines steal time
边栏推荐
- Unit test framework + Test Suite
- The 10000 hour rule won't make you a master programmer, but at least it's a good starting point
- Example of joint use of ros+pytoch (semantic segmentation)
- [open source project recommendation colugomum] this group of undergraduates open source retail industry solutions based on the domestic deep learning framework paddlepadddle
- Software testing learning - the next day
- Pytorch exercise items
- POI dealing with Excel learning
- UNI-APP中条件注释 实现跨段兼容、导航跳转 和 传参、组件创建使用和生命周期函数
- Abstract learning
- Hands on redis master-slave replication, sentinel master-slave switching, cluster sharding
猜你喜欢

Use selenium to climb the annual box office of Yien

100000 bonus is divided up. Come and meet the "sister who braves the wind and waves" among the winners
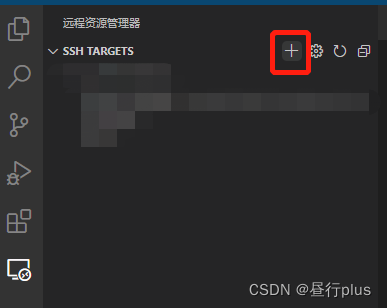
SSH link remote server and local display of remote graphical interface
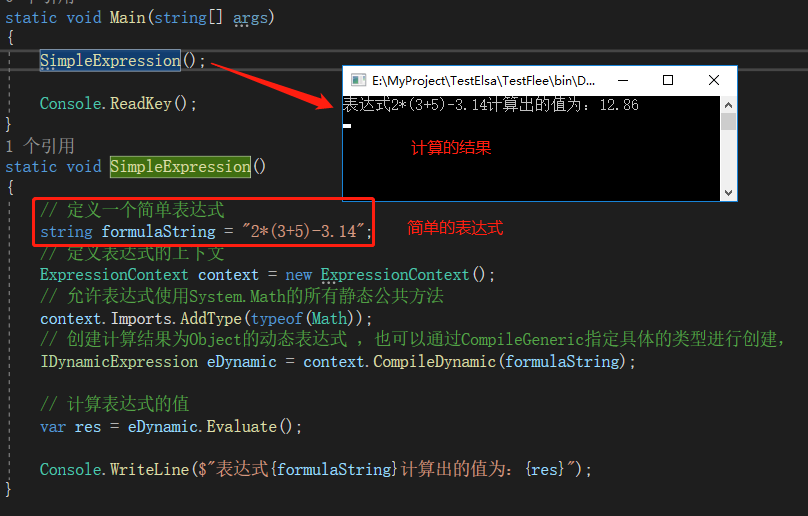
The dynamic analysis and calculation of expressions are really delicious for flee
![[classes and objects] explain classes and objects in simple terms](/img/41/250457530880dfe3728432c2ccd50b.png)
[classes and objects] explain classes and objects in simple terms
【类和对象】深入浅出类和对象
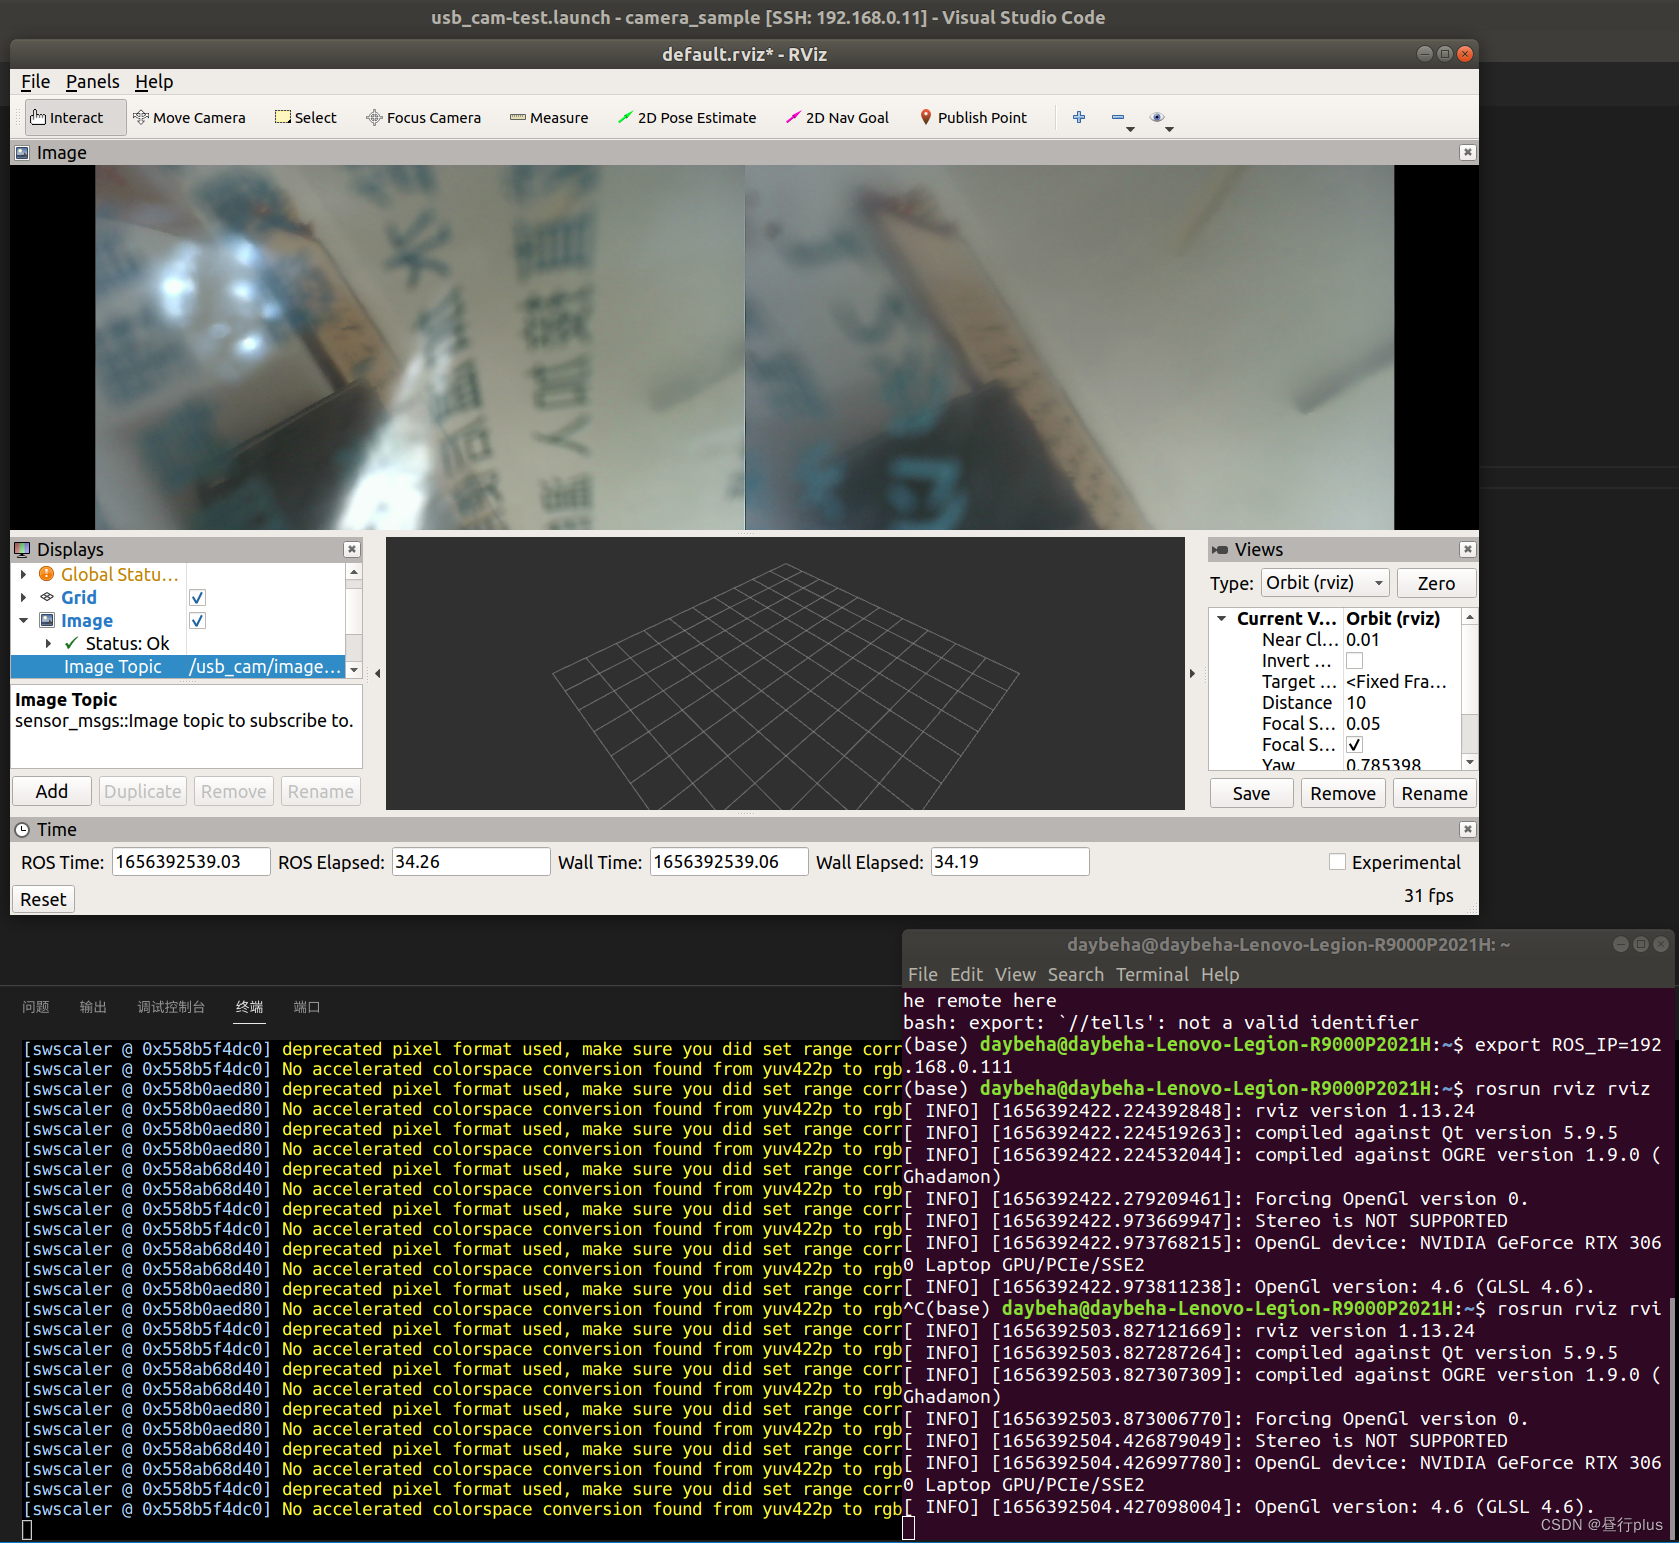
Local rviz call and display of remote rostopic

Summary of UI module design and practical application of agent mode

【开源项目推荐-ColugoMum】这群本科生基于国产深度学习框架PaddlePadddle开源了零售行业解决方案

How to scan when Canon c3120l is a network shared printer
随机推荐
The win7 computer can't start. Turn the CPU fan and stop it
【无标题】
Stream stream
Request weather interface format, automation
Software testing assignment - day 1
Ruoyi interface permission verification
[5g NR] UE registration process
The difference between CONDA and pip
Winter vacation work of software engineering practice
方差迭代公式推导
The most classic 100 sentences in the world famous works
opencv
Operation principle of lua on C: Foundation
Unit test framework + Test Suite
opencv
Unittest attempt
These two mosquito repellent ingredients are harmful to babies. Families with babies should pay attention to choosing mosquito repellent products
[Code] if (list! = null & list. Size() > 0) optimization, set empty judgment implementation method
Pytest -- write and manage test cases
Summary of UI module design and practical application of agent mode