当前位置:网站首页>Bank marketing predicts the success rate of a customer's purchase of financial products
Bank marketing predicts the success rate of a customer's purchase of financial products
2022-07-27 23:47:00 【biyezuopin】
Bank Marketing Predict the success rate of a customer buying financial products
One 、 The experiment purpose
- Be familiar with the basic methods of data preprocessing , Include missing value padding 、 Data encoding .
- be familiar with pandas、scikit Such as the use of data analysis library .
- Familiar with machine learning algorithm cross validation method .
- Familiar with confusion matrix 、PR curve 、ROC Curves and AUC value .
- Analyze regular term parameter pairs Logistic Regression The impact of performance .
- Analyze the influence of maximum tree depth on decision tree performance .
- Analyze the performance convergence of random forest with the number of individuals , And the influence of individual tree depth on random forest performance .
- Compare decision trees 、 Random forest in Bank Marketing Differences in data sets , And analyze the reasons for this difference .
Two 、 Data preprocessing
2.1 Data description
Bank Marketing The data set is used to predict the success rate of a customer purchasing financial products .
The attributes of data input include basic customer information , Current marketing campaign information , Other information and socio-economic background information .
Age Age ( Numbers )
Job Type of work ( classification :“ Administrators ”,“ Blue collar ”,“ entrepreneurs ”,“ maid ”,“ management ”,“ retired ”,“ Self employment ”,“ service ”,“ Student ” “ Technical personnel ”, “ unemployment ”, “ Unknown ”)
Marital Marital status ( classification :“ divorce ”,“ married ”,“ single ”,“ Unknown ”; notes :“ divorce ” It refers to divorce or widowhood )
Education education ( class :“basic.4y”,“basic.6y”,“basic.9y”,“high.school”,“illiterate”,“professional.course”,“university.degree”,“unknown”)
Default Default credit limit ? ( classification :“ No ”,“ yes ”,“ Unknown ”)
Housing Do you have a housing loan ? ( classification :“ No ”,“ yes ”,“ Unknown ”)
Loan Do you have a personal loan ? ( classification :“ No ”,“ yes ”,“ Unknown ”)
Contact Contact communication type ( classification :“ mobile phone ”,“ Cable telephone ”)
Month Last contact month ( classification :“jan”,“feb”,“mar”,…,“nov”,“dec”)
Day_of_week Last contact day ( classification :“mon”,“tue”,“wed”,“thu”,“fri”)
Duration Last contact duration , In seconds ( Numbers ).
Campaign Number of contacts with this customer during this campaign series ( Numbers , Including the last contact )
Pdays The number of days since the last contact with the customer in the last marketing campaign ( Numbers ;999 The customer has not been contacted before )
Previous Number of customer contacts before this campaign
Poutcome The results of the last marketing campaign ( classification :‘ Failure ’,‘ non-existent ’,‘ success ’)
emp.var.rate: Employment change rate - Quarterly indicators ( Numbers )
cons.price.idx: Consumer price index - Monthly indicators ( Numbers )
cons.conf.idx: Consumer confidence index - Monthly indicators ( Numbers )
euribor3m:euribor 3 Monthly rate - Daily indicators ( Numbers )
nr.employed: Number of employees - Quarterly indicators ( Numbers )
Data output includes :
Whether the customer will buy the product ( classification : yes 、 no )
in addition , There may be missing values in the data ( use unknown Express )
2.2 Data preview
The experiment is based on pandas Can read in data , Can pass tail Methods to obtain some data of the sample :

Chart 1 be based on pandas Conduct data overview
Further analyze the proportion of positive and negative samples in the data , You can see , The proportion of positive and negative samples is not very uniform , Customers who buy products account for a small proportion .

Chart 2 Positive sample ratio
2.3 Missing value processing
First, analyze which columns exist unknown data :

Chart 3 Possible attributes with missing values
You can see ,job、marital、education、default、housing、loan These attributes have missing values . We first pass pandas Of value_counts Analyze the quantity distribution of each classification of attributes with missing values .

Chart 4 Job Attribute classification distribution

Chart 5 marital Attribute classification distribution

Chart 6 education Attribute classification distribution 
Chart 7 loan Attribute classification distribution
job、marital、education、loan These attributes , The proportion of classification with the highest proportion is much higher than that of other attributes , Therefore, we directly use the classification with the highest proportion as the filling value of the missing value .
Chart 8 housing Attribute classification distribution
Housing attribute yes and no The proportion of is relatively similar , Therefore, the method of random selection is adopted yes and no The choice of .

Chart 9 Data missing value processing method

Chart 10 default Attribute classification distribution
Also note that default Properties of the yes Only 3 individual . This attribute has no meaning for machine learning algorithm , So we discard this attribute directly .

Chart 11 discarded default attribute
2.4 Data encoding
Numerical data does not need to be encoded , Therefore, it is not elaborated here .
The second category variables include housing and loan, Directly coded as 0 and 1 that will do .
Chart 12 Binary variable coding method
Ordered category variables include education, month, day_of_week, This kind of data can be encoded according to the order of classification :

Chart 13 Ordinal category variable coding
Unordered classification data includes job, contact, poutcome, marital. It is impossible to classify directly as ordered category variables , It needs to be converted into multidimensional data . Here the pandas Of get_dummies Help to encode unordered variables :

Chart 14 Generate dummy data for unordered classification
After coding , It can analyze the correlation coefficient between each attribute and classification :

Chart 15 Each attribute and y Correlation coefficient of classification
3、 ... and 、 Algorithm evaluation method
3.1 Cross validation
We are based on scikit Of ShuffleSplit Define the cross validation method . We define five 50% cross validation :

Chart 16 Define cross validation
3.2 Confusion matrix
A correct value cannot reflect the real performance of the model , We introduce confusion matrix , It can analyze the classification performance of customers who have purchased and customers who have not purchased :

Chart 17 The drawing of confusion matrix
3.3 PR curve 、ROC Curves and AUC
We are based on PR curve 、ROC Curves and AUC To further analyze the performance of the algorithm .

Chart 18 PR curve 、ROC Curves and AUC
Four 、Logistic Regression
4.1 Adjustment of regularization coefficient
We analyze the regularization coefficient pair Logistic Regression Performance impact , You can see , The regularization coefficient has little effect on the performance of the algorithm .

Chart 19 Relationship between regularization coefficient and model accuracy
4.2 The accuracy varies with the number of training samples

Chart 20 LR The accuracy varies with the number of training samples
4.3 Confusion matrix
It can be seen that although the overall accuracy of the model is high , However, the uneven classification makes the classification performance of unsubscribed customers better , However, the classification performance of ordering customers is poor .

Chart 21 LR Confusion matrix
4.4 PR curve 、ROC Curves and AUC value

Chart 22 LR Of PR curve

Chart 23 LR Of ROC Curve and AUC
5、 ... and 、 Decision tree experiment
5.1 The effect of maximum tree depth on performance
When the height of the tree is less than 5 When , Increasing the height of the tree can reduce generalization error and empirical error . But when the height of the tree is greater than 5 When , Although the increase of tree height can reduce the empirical error , But the generalization error is beginning to increase , It shows that the height of decision tree is too high, which is easy to cause over fitting .

Chart 24 The influence of maximum tree depth on the performance of decision tree
5.2 The effect of the number of training samples on performance
With the increase of training samples , The generalization error of the tree is reduced , Experience error has increased .
Chart 25 The influence of the number of training samples on the performance of decision tree
5.3 Confusion matrix
and LR equally , The performance of unsubscribed customer classification in decision tree classification is still poor . It shows that the uneven data set has a great impact on training .

Chart 26 Confusion matrix
5.4 PR curve 、ROC Curves and AUC value
Decision tree AUC and LR Almost the same .

Chart 27 Decision tree PR curve

Chart 28 Decision tree ROC Curves and AUC value
5.5 Decision tree visualization
From the decision tree visualization, we can see , The attributes that have the greatest impact on decision-making focus on duration、 Socio economic attributes, etc .

Chart 29 Decision tree visualization
6、 ... and 、 Random forest experiment
6.1 Learning the convergence of individual and random forest performance
The number of individuals reached 30 The performance of the model basically converges .

Chart 30 Learning the convergence of individual and random forest performance
6.2 Relationship between maximum tree height and model performance
Different from the decision tree , The increase of tree height in random forest has not caused the fitting problem , contrary , The higher the height of the tree , The better the performance of the model .

Chart 31 Relationship between maximum tree height and model performance
6.3 Effect of sample number on random forest performance

Chart 32 Effect of sample number on random forest performance
6.4 Confusion matrix
The confusion matrix shows , More instances in the random forest are divided into customers who will not buy products . Although the model accuracy of random forest and decision tree is basically the same , But the random forest model will make banks lose more customers .

Chart 33 Random forest confusion matrix
6.5 PR curve 、ROC Curves and AUC

Chart 34 Random forests PR curve

Chart 35 Random forests ROC and AUC value
边栏推荐
- Under the epidemic, TSMC's growth in the first quarter exceeded expectations, with 7Nm accounting for 35%! Second quarter or record high
- 苹果发布新款iPhone SE:搭载A13仿生处理器,售价3299元起
- Zabbix4.0使用SNMP代理方式监控vcenter6.5
- TCP的粘包拆包问题+解决方案
- 突发,微信重要通知
- Arm32 for remote debugging
- QT with OpenGL(Shadow Mapping)(平行光篇)
- 解决5G使用痛点,魅族17 mSmart 5G快省稳技术发布
- Elk log analysis system installation and deployment
- reduce错误示范
猜你喜欢
![[number recognition] handwritten number recognition based on knowledge base with matlab code](/img/06/6adab955a339f453249543baab1dc6.png)
[number recognition] handwritten number recognition based on knowledge base with matlab code

Normality of confidence interval

五子棋人机对战实现

Interviewer: let's talk about the specific process of network data transmission

NDK series (6): let's talk about the way and time to register JNI functions

消息队列常见的几种使用场景介绍
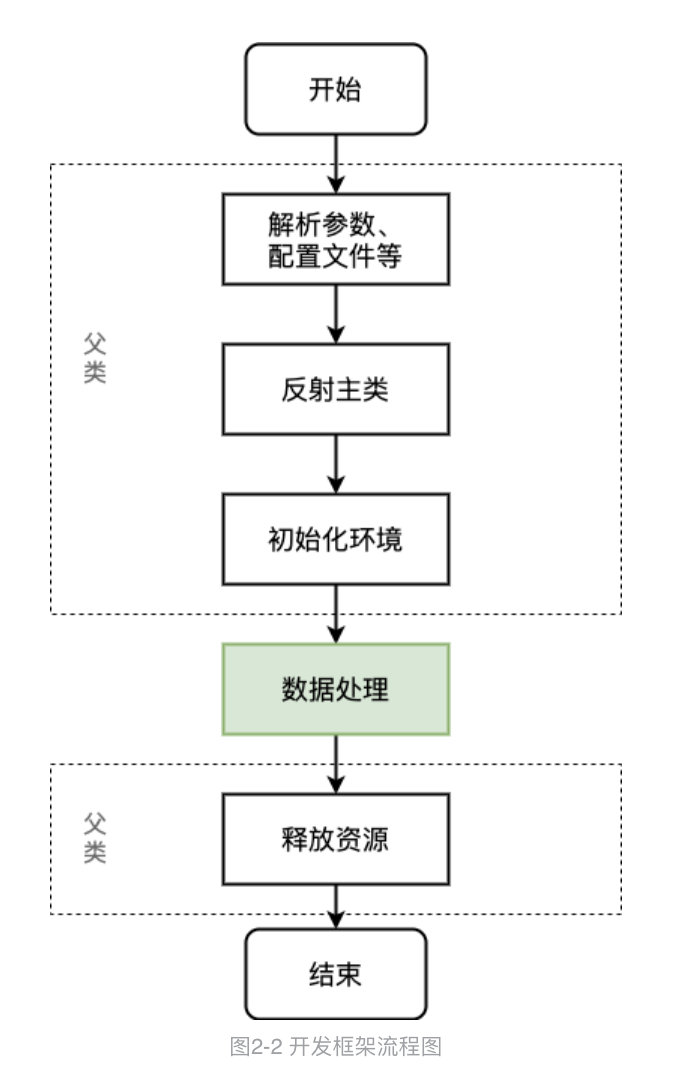
Design and implementation of spark offline development framework

Nature review: preferential effects in the formation of microbial communities

JUC工具包学习

Lua基础语法学习
随机推荐
采用汇顶屏下光学指纹方案,三星Galaxy A71 5G上市
台积电3nm细节曝光:晶体管密度高达2.5亿个/mm²,性能及能效大幅提升
Current situation and future of Nb IOT industry: cross the threshold of 100million shipments and rush to 5g connection!
2022 summer vacation daily question (5)
[elm classification] classification of UCI data sets based on nuclear limit learning machine and limit learning machine, with matlab code
Under the epidemic, TSMC's growth in the first quarter exceeded expectations, with 7Nm accounting for 35%! Second quarter or record high
js数组复制速度测试220320
Zabbix4.0 uses SNMP agent to monitor vcenter6.5
TSMC 3nm detail exposure: transistor density as high as 250million /mm ², Greatly improved performance and energy efficiency
苹果发布新款iPhone SE:搭载A13仿生处理器,售价3299元起
Flutter pull_to_refresh-1.6.0/lib/src/internals/slivers.dart:164:13: Error: Method not found: ‘descr
The technology of applet container is very promising, which can greatly improve the efficiency of mobile R & D
并发和并行有什么区别?
[signal processing] weak signal detection in communication system based on the characteristics of high-order statistics with matlab code
Xu Jinbo: AI protein prediction and design
proteus仿真arduino中调用DHT11/22温湿度传感器
[C language] address book (dynamic version)
携手长江存储,江波龙推出全球最小扩展卡
【12月海口】2022年第六届船舶,海洋与海事工程国际会议(NAOME 2022)
Redis 哈希Hash底层数据结构