当前位置:网站首页>对node工程进行压力测试与性能分析
对node工程进行压力测试与性能分析
2022-08-02 05:04:00 【程序员威子】
在系统上线前,为了看下系统能承受多大的并发和并发下的负载情况,进行了一轮压测。在压测过程中,发现服务器的cpu飚的的非常高,而tps,接口耗时、服务可用等都是正常的,卧槽,这就奇了怪了,自己想了半天也没想出为啥,不得已求助了大佬,大佬说先查看 cpu processor what?这是啥??虽然听不懂,但可以查嘛╭(╯^╰)╮,可还没等我查出来,大佬直接上手,一顿骚操作,便找出了原因~ 这着实让自己汗颜啊,内功远远不足啊,回来网上找了资料,恶补一把如何分析node工程中的性能问题。
在开发过程中,因为过于只关注了业务逻辑的实现,一些可能出现性能的点被忽略掉,而且这些点只能在量稍微大些的并发场景下才会出现,忘了在哪看到一句话 可能会出问题的点,便一定会出问题 性能问题进行分析必不可少。
样例项目
为了便于演示,写了个简单的小例子:
// app.js
  const crypto = require('crypto')
  const Koa = require('koa')
  const Router = require('koa-router');
  const app = new Koa();
  const router = new Router();
  router.get('/crypto', async(ctx, next) => {
      const salt = crypto.randomBytes(128).toString('base64')
      const hash = crypto.pbkdf2Sync('crypto', salt, 10000, 64, 'sha512').toString('hex')
      ctx.body = { hash: hash }
      console.log(hash)
      ctx.status = 200
      next()
  });
  let reqNum = 0
  router.get('/empty', async(ctx, next) => {
      ctx.body = { hash: 'empty' }
      reqNum++;
      ctx.status = 200
      next()
  });
  app.use(router.routes()).use(router.allowedMethods());
  app.listen(3000, () => {
      console.log("listen 3000")
  })
复制代码
基于koa2,有两个路由,一个/crypto,其中的业务逻辑是,使用crypto库对字符串加密;一个是 /empty,没有业务逻辑的接口,就是个空接口。
压力测试
压力测试工具市面上有很多种,就不一一列举了,在社区看到有人推荐 autocannon ,就对这个工具做个介绍,官方的简介是 fast HTTP/1.1 benchmarking tool written in Node.js ,使用node编写的压测工具,能比wrk生成更多负载。
install
npm i autocannon -g
npm i autocannon --save
use
提供两种使用方式:
1. 命令行 autocannon -c 100 -d 5 -p 2 http://127.0.0.1:3000/test 简单快速。
2. api调用 autocannon(opts[, cb]) 便于编写脚本。
关键参数有这么几个:
-c/--connections NUM 并发连接的数量,默认10。
-p/--pipelining NUM 每个连接的流水线请求请求数。默认1。
-d/--duration SEC 执行的时间,单位秒。
-m/--method METHOD 请求类型 默认GET。
-b/--body BODY 请求报文体。
还有很多参数,大家可以查看官网文档。
这个库目前只能支持一个接口压测,我写了个脚本,可以支持批量压测和生成测试报告,具体代码见文末。
report
下图是对 /empty 接口压测 autocannon -c 100 -d 5 -p 1 http://127.0.0.1:3000/empty 结果如下:
可看到,每秒有100个链接,每个链接一个请求,持续5秒,一共产生 31k 次请求。
报告分三部分,第一行表示接口的延迟,第二行表示每秒的请求数(tps),第三行表示每秒返回的字节数。那么,延迟越低,tps越高,就表示接口性能越好,因为empty 是个空接口,所以它的tps=6221还不错,响应时间也很快,我们换成 /crypto 接口在试试。
立马看出差距了,这个接口tps只有77,接口耗时达到了1100ms,说明这个接口有很大的优化空间啊。
生成性能文件与分析
通过压测工具我们找到了有问题的接口,那接下来,就要对接口进行剖析了,可是光看接口代码,不好分析啊,毕竟没有说服力,我们就需要一份性能报告,用数据说话,下面介绍这个两个方法给大家。
V8 Profiler
V8 官方已经为大家考虑到这点了,提供了Profiler工具 使用方式也很快捷,步骤如下。以app.js为例)
生成报告
在启动命令中加上 --prof ,如 node --prof app.js ,在项目根目录会生成isolate-xxxxxxx-v8.log格式的文件,用来记录运行期间的调用栈和时间等信息,其中内容如下。(文件较大,就截取最顶端一小截)
v8-version,6,1,534,47,0
  shared-library,"C:\Program Files\nodejs\node.exe",0x7ff7505f0000,0x7ff751c0f000,0
  shared-library,"C:\WINDOWS\SYSTEM32\ntdll.dll",0x7ff8718a0000,0x7ff871a61000,0
  shared-library,"C:\WINDOWS\system32\KERNEL32.DLL",0x7ff870590000,0x7ff87063d000,0
  shared-library,"C:\WINDOWS\system32\KERNELBASE.dll",0x7ff86e830000,0x7ff86ea18000,0
  shared-library,"C:\WINDOWS\system32\WS2_32.dll",0x7ff86ee00000,0x7ff86ee6b000,0
分析报告
对刚刚生成的log文件分析,还是使用官方提供的工具 node --prof-process isolate-xxxxxxxx-v8.log,生成结果如下。(去掉无用的部分)
Statistical profiling result from isolate-00000209B99A60A0-v8.log, (17704 ticks, 8 unaccounted, 0 excluded).
   [Shared libraries]:
     ticks  total  nonlib   name
    13795   77.9%          C:\WINDOWS\SYSTEM32\ntdll.dll
    ...
   [JavaScript]:
     ticks  total  nonlib   name
       12    0.1%   11.3%  Builtin: CallFunction_ReceiverIsAny
       ...
   [C++]:
     ticks  total  nonlib   name
   [Summary]:
     ticks  total  nonlib   name
       94    0.5%   88.7%  JavaScript
        0    0.0%    0.0%  C++
        8    0.0%    7.5%  GC
    17598   99.4%          Shared libraries
        8    0.0%          Unaccounted
   [C++ entry points]:
     ticks    cpp   total   name
   [Bottom up (heavy) profile]:
    Note: percentage shows a share of a particular caller in the total
    amount of its parent calls.
    Callers occupying less than 1.0% are not shown.
     ticks parent  name
    13795   77.9%  C:\WINDOWS\SYSTEM32\ntdll.dll
     3795   21.4%  C:\Program Files\nodejs\node.exe
     3768   99.3%    C:\Program Files\nodejs\node.exe
     3287   87.2%      Function: ~pbkdf2 crypto.js:633:16
     3287  100.0%        Function: ~exports.pbkdf2Sync crypto.js:628:30
     3287  100.0%          Function: ~router.get D:\github\webapp\js\usen\app.js:8:23
     3287  100.0%            Function: ~dispatch D:\github\webapp\js\usen\node_modules\[email protected]@koa-compose\index.js:37:23
      ...
报告包含六部分:Shared libraries、JavaScript、C++、Summary、C++ entry points 和 Bottom up (heavy) profile,[JavaScript] 部分列出了 JavaScript 代码执行所占用的 CPU ticks(CPU 时钟周期),[C++] 部分列出了 C++ 代码执行所占用的 CPU ticks,[Summary] 列出了各个部分的占比,[Bottom up] 列出了所有 CPU 占用时间从大到小的函数及堆栈信息。
根据 3287 87.2% Function: ~pbkdf2 crypto.js:633:16 可看出这个函数消耗了 87.2% 的cpu。
文件的方式不直观,那我们换个UI界面的,步骤如下:
·先clone v8的仓库下来 git clone GitHub - v8/v8: The official mirror of the V8 Git repository
· 将日志文件转换成 json格式 node --prof-process --preprocess isolate-xxxxxxxxxx-v8.log > v8.json
· 打开 v8/tools/profview/index.html 文件,是个静态界面,在界面中心选择刚生成的 v8.json文件,文件解析成功后,界面如下:
具体的功能就不一一解释啦,我们逐层展开,寻找耗时的点,很快便找到耗cpu的地方,如下图:
node占比是45%,其中 pbkdf2 crypto.js便占用了92%。
v8-profiler
除了官方提供之外,我们还可以选择开源大佬的库,v8-profiler ,这个库的创建的时间比较早,6年前便创建了,最近一次更是在一年半前,社区评价还是不错的。
生成报告
生成方式很简单,不足的是,需要硬编码在项目中,如下:
profiler.startProfiling('', true);
  setTimeout(function() {
    var profile = profiler.stopProfiling('');
    profile.export()
       .pipe(fs.createWriteStream(`cpuprofile-${Date.now()}.cpuprofile`))
       .on('finish', () => profile.delete())
  }, 1000);
解析报告
·Chrome
我们的大Chrome要出马啦,在Chrome的控制台,有一栏 JavaScript Profile 如下图:
点击load,选择刚刚生成的文件,解析后如下:
逐层查看,便了然。
· flamegraph-火焰图
使用 flamegraph 生成酷炫的火焰图,用在报告那是酷炫的一逼,官网图如下:
使用方式就不细说啦。
· v8-analytics
这个是社区大佬们,写的一个开源库 v8-analytics,官方介绍如下
解析v8-profiler和heapdump等工具输出的cpu & heap-memory日志,可以提供:
1)v8引擎逆优化或者优化失败的函数标红展示以及优化失败原因展示;
2)函数执行时长超过预期标红展示;
3)当前项目中可疑的内存泄漏点展示。
对应的命令如下:
va test bailout --only 这个命令可以只把那些v8引擎逆优化的函数列出来展示。
va test timeout 200 --only 这个命令可以只把那些执时长超过200ms的函数列出来展示。
va test leak 可疑展示出测试的heapsnapshot文件中可疑的内存泄漏点。
这个库的好处是,省的我们一个个去点开查找,这样可以更加便于我们筛选问题啦~
批量压力测试及生成报告
autocannon 只能运行一个接口,要想在测试下一个接口,就得修改代码,比如想批量测试多个接口,就需要来回改代码,操作就比较麻烦,所以我基于 autocannon 写了个脚本,可以逐一压测定义好的接口,同时还可以生成测试报告。
'use strict'
  const autocannon = require('autocannon')
  const reporter = require('autocannon-reporter')
  const path = require('path')
  const sleep = ms => new Promise(resolve => setTimeout(resolve, ms));
  /**
   * @description
   * 运行autocannon
   * [url=home.php?mod=space&uid=267564]@Author[/url] lizc
   * @param {*} param
   */
  function makeAutocannon(param) {
      autocannon(param).on('done', handleResults)
  }
  /**
   * @description
   * 处理接口
   * @author lizc
   * @param {*} result
   */
  function handleResults(result) {
      const reportOutputPath = path.join(`./${result.title}_report.html`)
      reporter.writeReport(reporter.buildReport(result), reportOutputPath, (err, res) => {
          if (err) console.err('Error writting report: ', err)
          else console.log('Report written to: ', reportOutputPath)
      })
  }
  // 请求参数
  const autocannonParam = {
      url: 'http://127.0.0.1:6100/',
      connections: 100,
      duration: 10,
      headers: {
          type: 'application/x-www-form-urlencoded'
      }
  }
  // 请求报文参数
  const requestsParam = {
      method: 'POST', // this should be a put for modifying secret details
      headers: { // let submit some json?
          'Content-type': 'application/json; charset=utf-8'
      }
  }
  /**
   * @description
   * 启动批量压测
   * @author lizc
   * @param {*} methodList 接口列表
   */
  async function run(methodList) {
      const autocannonList = methodList.map(val => {
          return {
              ...autocannonParam,
              url: autocannonParam.url + val,
              title: val,
              requests: [
                  {
                      ...requestsParam,
                  }
              ],
          }
      })
      for (let i = 0; i < autocannonList.length; i++) {
          if (i !== 0) {
              await sleep((autocannonList[i - 1].duration + 2) * 1000)
              makeAutocannon(autocannonList[i])
          } else {
              makeAutocannon(autocannonList[i])
          }
      }
  }
  // 启动
  run(['order', 'crypto'])
最后感谢每一个认真阅读我文章的人,礼尚往来总是要有的,虽然不是什么很值钱的东西,如果你用得到的话可以直接拿走:938856006资料在裙里,需要可以自取

这些资料,对于【软件测试】的朋友来说应该是最全面最完整的备战仓库,这个仓库也陪伴上万个测试工程师们走过最艰难的路程,希望也能帮助到你!
既然都看到这里啦,请你帮个忙:
1、点赞,让更多小伙伴看到;
2、关注我,持续更新测试干货。
边栏推荐
猜你喜欢
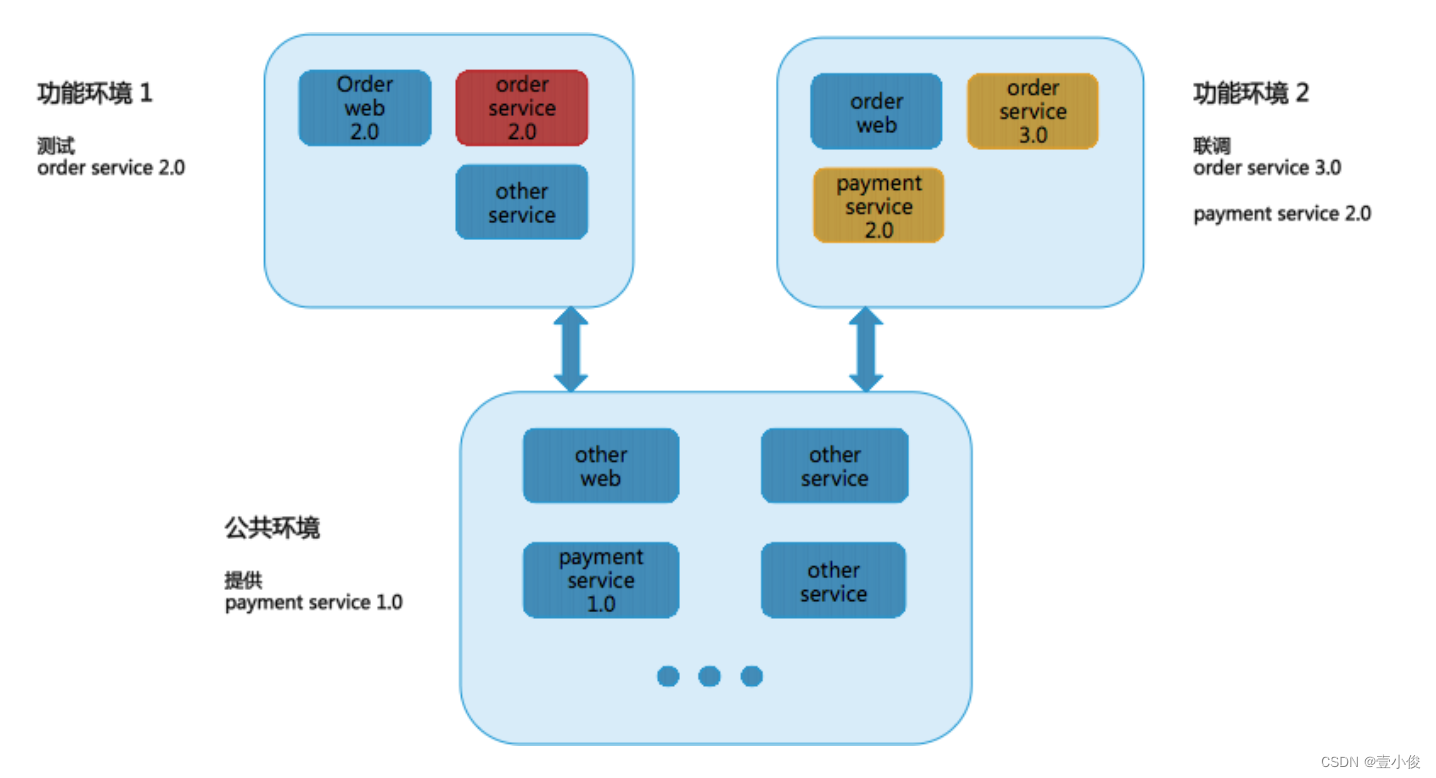
How much does a test environment cost? Start with cost and efficiency

navicat connects to MySQL and reports an error: 1045 - Access denied for user 'root'@'localhost' (using password YES)

MYSQL 唯一约束

浏览器的onload事件
力扣 2127. 参加会议的最多员工数 拓扑剪枝与2360补充

区块元素、内联元素(<div>元素、span元素)

Review: image saturation calculation formula and image signal-to-noise (PSNR) ratio calculation formula
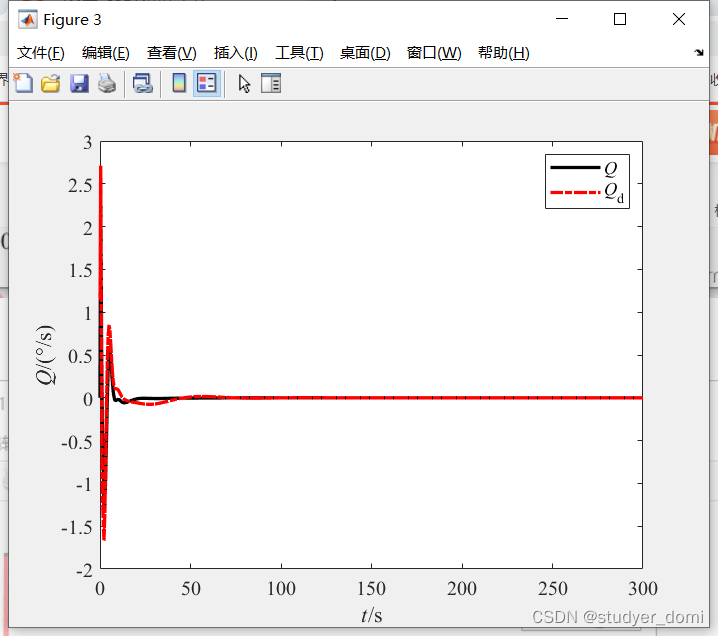
matlab simulink 飞机飞行状态控制

MySQL 多表关联一对多查询实现取最新一条数据
MySQL multi-table association one-to-many query to get the latest data
随机推荐
matlab simulink 模糊pid结合smith控制温度
自动化运维工具——ansible、概述、安装、模块介绍
Mysql存储json格式数据
牛客-TOP101-BM41
系统(层次)聚类
从DES走到AES(现代密码的传奇之路)
Mysql实现乐观锁
MySQL 8.0.29 set and modify the default password
18年程序员生涯,读了200多本编程书,挑出一些精华分享给大家
ApiPost 真香真强大,是时候丢掉 Postman、Swagger 了
JUC(一)- JUC学习概览 - 对JUC有一个整体的认识
prisma使用mongodb副本集群报错引发的一些列问题
复盘:图像饱和度计算公式和图像信噪(PSNR)比计算公式
合作的小伙伴,缺乏主人翁(owner)意识,好苦恼
Packaging and deployment of go projects
【语义分割】FCN
12个MySQL慢查询的原因分析
Mysql common commands
navicat connects to MySQL and reports an error: 1045 - Access denied for user 'root'@'localhost' (using password YES)
golang的time包:时间间隔格式化和秒、毫秒、纳秒等时间戳格式输出的方法