当前位置:网站首页>Matplotlib--plot markers
Matplotlib--plot markers
2022-07-30 10:14:00 【Zhuangluo orange】
目录
Draw a filled circle marker'o'
Draw a lower solid triangle marker based on the coordinate point
fmt 参数定义了基本格式,如标记、线条样式和颜色.格式fmt = '[marker][line][color]
属性
属性marker
标记 符号 描述 "."
点 ","
像素点 "o"
实心圆 "v"
下三角 "^"
上三角 "<"
左三角 ">"
右三角 "1"
下三叉 "2"
上三叉 "3"
左三叉 "4"
右三叉 "8"
八角形 "s"
正方形 "p"
五边形 "P"
加号(填充) "*"
星号 "h"
六边形 1 "H"
六边形 2 "+"
加号 "x"
乘号 x "X"
乘号 x (填充) "D"
菱形 "d"
瘦菱形 "|"
竖线 "_"
横线 0 (TICKLEFT)
左横线 1 (TICKRIGHT)
右横线 2 (TICKUP)
上竖线 3 (TICKDOWN)
下竖线 4 (CARETLEFT)
左箭头 5 (CARETRIGHT)
右箭头 6 (CARETUP)
上箭头 7 (CARETDOWN)
下箭头 8 (CARETLEFTBASE)
左箭头 (中间点为基准) 9 (CARETRIGHTBASE)
右箭头 (中间点为基准) 10 (CARETUPBASE)
上箭头 (中间点为基准) 11 (CARETDOWNBASE)
下箭头 (中间点为基准) "None", " " or "" 没有任何标记 '$...$'
渲染指定的字符.例如 "$f$" 以字母 f 为标记. 属性line
线类型标记 描述 '-' 实线 ':' 虚线 '--' 破折线 '-.' 点划线 属性color
颜色标记 描述 'r' 红色 'g' 绿色 'b' 蓝色 'c' 青色 'm' 品红 'y' 黄色 'k' 黑色 'w' 白色


Draw a filled circle marker'o'
代码
import matplotlib.pyplot as plt
import numpy as np

ypoints = np.array([1,3,4,5,8,9,6,1,3,4,5,2,4])

plt.plot(ypoints, marker = 'o')
plt.show()

绘制*标记
代码
import matplotlib.pyplot as plt
import numpy as np

ypoints = np.array([1,3,4,5,8,9,6,1,3,4,5,2,4])

plt.plot(ypoints, marker = '*')
plt.show()

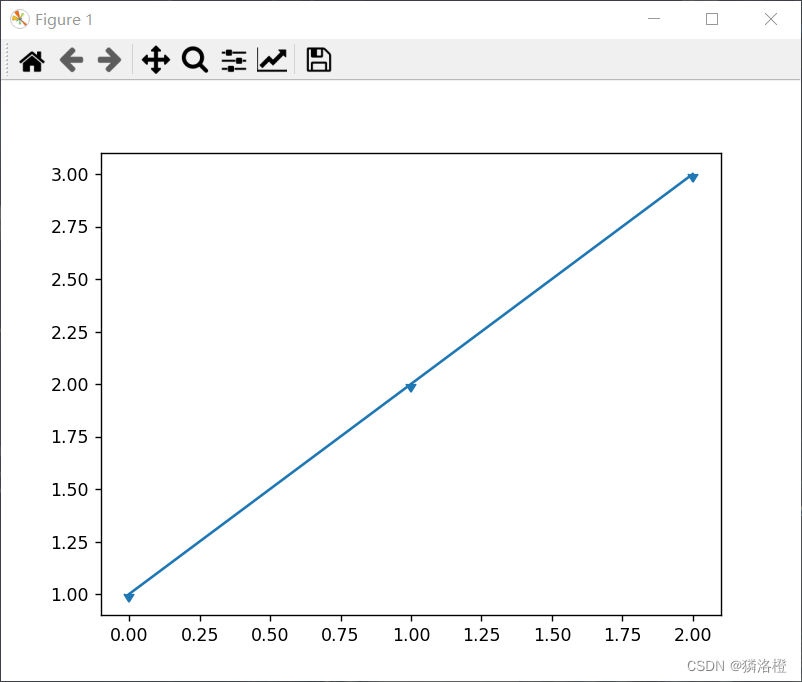
Draw a lower solid triangle marker based on the coordinate point
代码
import matplotlib.pyplot as plt
import matplotlib.markers

plt.plot([1, 2, 3], marker=matplotlib.markers.CARETDOWNBASE)
plt.show()
fmt 参数定义了基本格式,如标记、线条样式和颜色.格式fmt = '[marker][line][color]
代码
import matplotlib.pyplot as plt
import numpy as np

ypoints = np.array([6, 2, 13, 10])

plt.plot(ypoints, 'o:r')
plt.show()

标记大小与颜色
我们可以自定义标记的大小与颜色,使用的参数分别是:
- markersize,简写为 ms:定义标记的大小.
- markerfacecolor,简写为 mfc:定义标记内部的颜色.
- markeredgecolor,简写为 mec:定义标记边框的颜色.
代码
import matplotlib.pyplot as plt
import numpy as np

ypoints = np.array([6, 2, 13, 10])

plt.plot(ypoints, marker = 'o', ms = 20)
plt.show()
代码
import matplotlib.pyplot as plt
import numpy as np

ypoints = np.array([6, 2, 13, 10])

plt.plot(ypoints, marker = 'o', ms = 20, mec = 'r')
plt.show()
代码
import matplotlib.pyplot as plt
import numpy as np

ypoints = np.array([6, 2, 13, 10])

plt.plot(ypoints, marker = 'o', ms = 20, mfc = 'r')
plt.show()
代码
import matplotlib.pyplot as plt
import numpy as np

ypoints = np.array([6, 2, 13, 10])
plt.plot(ypoints, marker = 'o', ms = 20, mec = '#4CAF50', mfc = '#4CAF50')
plt.show()


边栏推荐
猜你喜欢

ospf2双点双向重发布(题2)

死锁的理解

Day113.尚医通:微信登录二维码、登录回调接口

Multithreading--the usage of threads and thread pools

Matplotlib--绘图标记

New in GNOME: Warn users when Secure Boot is disabled
容器技术 -- 简单了解 Kubernetes 的对象

In the robot industry professionals, Mr Robot industry current situation?

(C语言)文件操作

Re16:读论文 ILDC for CJPE: Indian Legal Documents Corpus for Court Judgment Prediction and Explanation

随机推荐
Redis Desktop Manager 2022.4.2 released
New in GNOME: Warn users when Secure Boot is disabled
kubernetes的一些命令
Quick Start Tutorial for flyway
北京突然宣布,元宇宙重大消息
多线程保证单个线程开启事务并生效的方案
EViews 12.0软件安装包下载及安装教程
GNOME 新功能:安全启动被禁用时警告用户
容器技术 -- 简单了解 Kubernetes 的对象
4、yolov5-6.0 ERROR: AttributeError: ‘Upsample‘ object has no attribute ‘recompute_scale_factor‘ 解决方案
OC-手动引用计数内存管理
梅科尔工作室-看鸿蒙设备开发实战笔记四——内核开发
百度推广助手遇到重复关键字,验证错误,怎么一键删除多余的
debian10 install djando
nacos实战项目中的配置
JVM内存布局、类加载机制及垃圾回收机制详解
这种叫什么手法
PyQt5-用像素点绘制正弦曲线
软考 系统架构设计师 简明教程 | 系统运行与软件维护
梅科尔工作室-看鸿蒙设备开发实战笔记五——驱动子系统开发