当前位置:网站首页>Matplotlib--绘图标记
Matplotlib--绘图标记
2022-07-30 09:05:00 【獜洛橙】
目录
fmt 参数定义了基本格式,如标记、线条样式和颜色。格式fmt = '[marker][line][color]
属性
属性marker
标记 符号 描述 "."
点 ","
像素点 "o"
实心圆 "v"
下三角 "^"
上三角 "<"
左三角 ">"
右三角 "1"
下三叉 "2"
上三叉 "3"
左三叉 "4"
右三叉 "8"
八角形 "s"
正方形 "p"
五边形 "P"
加号(填充) "*"
星号 "h"
六边形 1 "H"
六边形 2 "+"
加号 "x"
乘号 x "X"
乘号 x (填充) "D"
菱形 "d"
瘦菱形 "|"
竖线 "_"
横线 0 (TICKLEFT)
左横线 1 (TICKRIGHT)
右横线 2 (TICKUP)
上竖线 3 (TICKDOWN)
下竖线 4 (CARETLEFT)
左箭头 5 (CARETRIGHT)
右箭头 6 (CARETUP)
上箭头 7 (CARETDOWN)
下箭头 8 (CARETLEFTBASE)
左箭头 (中间点为基准) 9 (CARETRIGHTBASE)
右箭头 (中间点为基准) 10 (CARETUPBASE)
上箭头 (中间点为基准) 11 (CARETDOWNBASE)
下箭头 (中间点为基准) "None", " " or "" 没有任何标记 '$...$'
渲染指定的字符。例如 "$f$" 以字母 f 为标记。 属性line
线类型标记 描述 '-' 实线 ':' 虚线 '--' 破折线 '-.' 点划线 属性color
颜色标记 描述 'r' 红色 'g' 绿色 'b' 蓝色 'c' 青色 'm' 品红 'y' 黄色 'k' 黑色 'w' 白色


绘制实心圆标记'o'
代码
import matplotlib.pyplot as plt
import numpy as np

ypoints = np.array([1,3,4,5,8,9,6,1,3,4,5,2,4])

plt.plot(ypoints, marker = 'o')
plt.show()

绘制*标记
代码
import matplotlib.pyplot as plt
import numpy as np

ypoints = np.array([1,3,4,5,8,9,6,1,3,4,5,2,4])

plt.plot(ypoints, marker = '*')
plt.show()

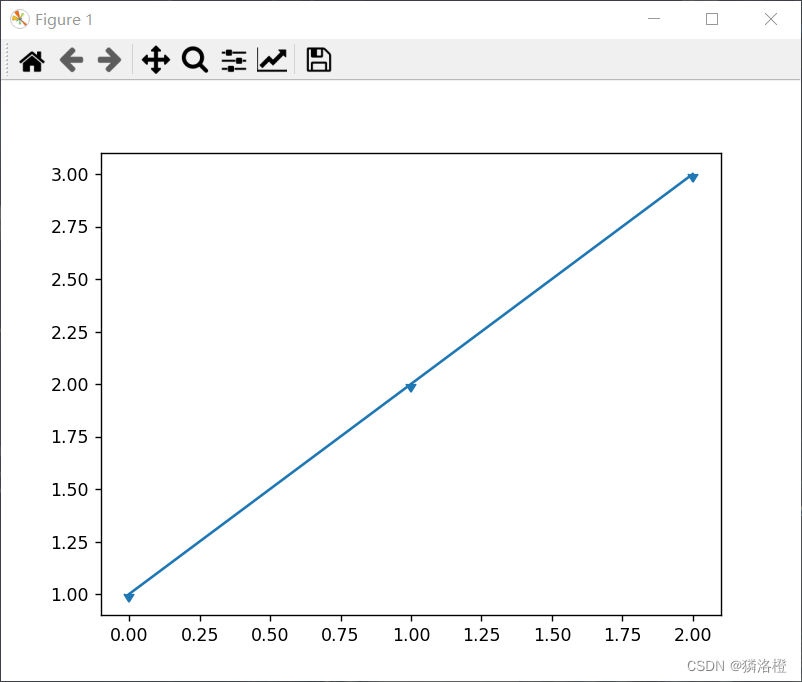
绘制以坐标点为基准的下实心三角标记
代码
import matplotlib.pyplot as plt
import matplotlib.markers

plt.plot([1, 2, 3], marker=matplotlib.markers.CARETDOWNBASE)
plt.show()
fmt 参数定义了基本格式,如标记、线条样式和颜色。格式fmt = '[marker][line][color]
代码
import matplotlib.pyplot as plt
import numpy as np

ypoints = np.array([6, 2, 13, 10])

plt.plot(ypoints, 'o:r')
plt.show()

标记大小与颜色
我们可以自定义标记的大小与颜色,使用的参数分别是:
- markersize,简写为 ms:定义标记的大小。
- markerfacecolor,简写为 mfc:定义标记内部的颜色。
- markeredgecolor,简写为 mec:定义标记边框的颜色。
代码
import matplotlib.pyplot as plt
import numpy as np

ypoints = np.array([6, 2, 13, 10])

plt.plot(ypoints, marker = 'o', ms = 20)
plt.show()
代码
import matplotlib.pyplot as plt
import numpy as np

ypoints = np.array([6, 2, 13, 10])

plt.plot(ypoints, marker = 'o', ms = 20, mec = 'r')
plt.show()
代码
import matplotlib.pyplot as plt
import numpy as np

ypoints = np.array([6, 2, 13, 10])

plt.plot(ypoints, marker = 'o', ms = 20, mfc = 'r')
plt.show()
代码
import matplotlib.pyplot as plt
import numpy as np

ypoints = np.array([6, 2, 13, 10])
plt.plot(ypoints, marker = 'o', ms = 20, mec = '#4CAF50', mfc = '#4CAF50')
plt.show()


边栏推荐
- XP电源维修fleXPower电源X7-2J2J2P-120018系列详解
- leetcode 剑指 Offer 12. 矩阵中的路径
- The FPGA based protocol 2: the I2C read and write E squared PROM
- Taosi TDengine 2.6+ optimization parameters
- 积分简明笔记-第一类曲线积分的类型
- 怎么在本地电脑上运行dist文件
- 无法定位程序输入点ucrtbase.abort于动态链接库api-ms-win-crt-runtime-|1-1-0.dll上
- 快解析结合泛微OA
- 初识Apifox——如何使用Apifox做一个简单的接口测试
- Using IN in MySQL will not go through index analysis and solutions
猜你喜欢


随机推荐
Two solutions for Excel xlsx file not supported
Excel xlsx file not supported两种解决办法【杭州多测师】【杭州多测师_王sir】
pnpm简介
内卷下的智能投影行业,未来何去何从?
Windows 下安装 MySQL
conda 导出/导出配置好的虚拟环境
leetcode 剑指 Offer 22. 链表中倒数第k个节点
百度paddleocr检测训练
Apache DolphinScheduler新一代分布式工作流任务调度平台实战-上
STM8L_库函数-模板搭建
leetcode 剑指 Offer 52. 两个链表的第一个公共节点
包、类及四大权限和static
Only after such a stage of development can digital retail have a new evolution
公共Jar包的版本管理
C#中Config文件中,密码的 特殊符号的书写方法。
HR团队如何提升效率?人力资源RPA给你答案
How to run dist file on local computer
嘉为鲸翼·多云管理平台荣获信通院可信云技术服务最佳实践
els 方块停在方块上。
Using IN in MySQL will not go through index analysis and solutions