当前位置:网站首页>Top command details
Top command details
2022-07-06 18:15:00 【Beiming Muzhi】
One 、 brief introduction
top Commands are often used to monitor Linux The operation of the server , It can display the memory usage of each process of the server in real time .
top [-d number] | top [-bnp]Easy to use :
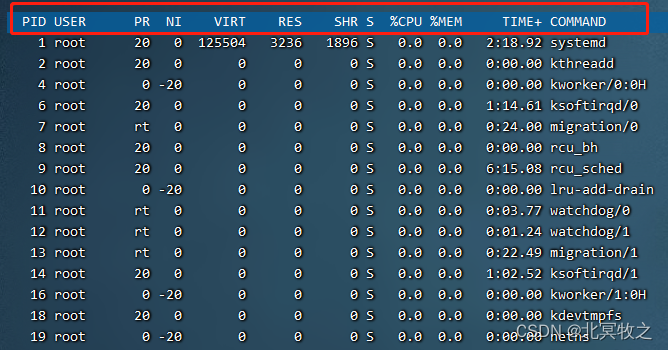
topThe results are as follows :
If we want to know top Details of the command , You can use commands :
info topThe result is shown in Fig. :
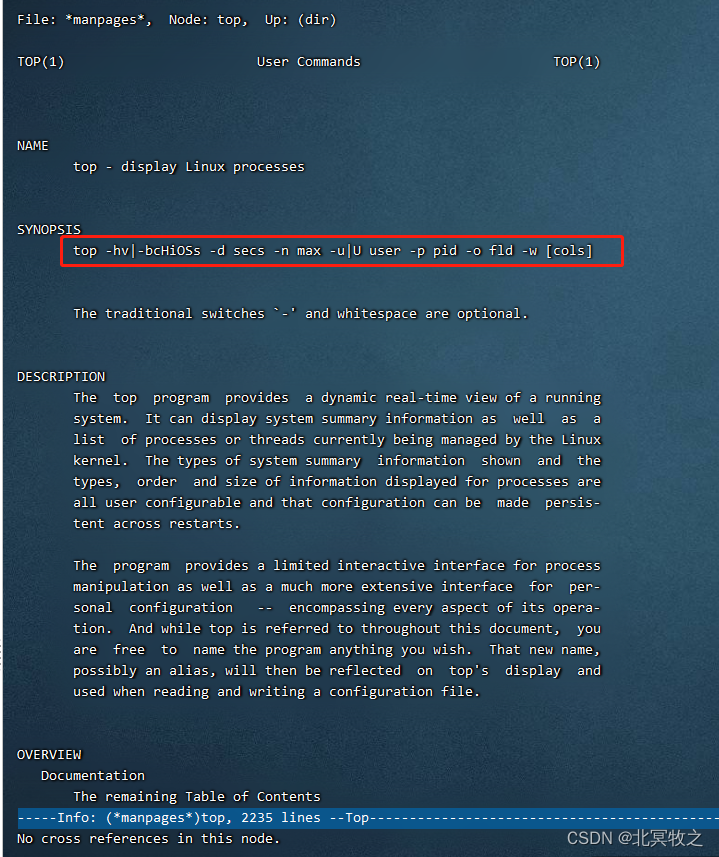
The red box in the above figure shows top Some parameters of the command , The specific meaning of parameters will be explained later .
We see one above DESCRIPTION, Translate as follows :
top The program provides a dynamic real-time view of the running system .
It can display system summary information as well as the current Linux A list of processes or threads managed by the kernel . The type of system summary information displayed and the type of information displayed for the process 、 The order and size are user configurable , And it can be configured during restart .
The program provides a limited interactive interface for process operation , It provides a broader interface for personal configuration , It covers all aspects of its operation . Although mentioned in this document top, But you can name the program as you like . The new name ( It could be an alias ) Will be reflected in top On the screen , And use... When reading and writing configuration files .
Two 、 Detailed explanation of output parameters
We use top After the command , stay linux Dynamically refresh the resource usage of each process on the server , So many parameters above , What do you mean by that ?
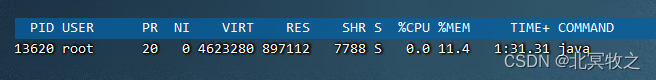
1.PID
Name meaning
PID process id
PPID The parent process id
RUSER Real user name
UID The user of the process owner id
USER User name of the process owner
GROUP The group name of the process owner
TTY The terminal name of the startup process . Processes that are not started from the terminal are shown as ?
PR priority
NI nice value . Negative value indicates high priority , A positive value indicates a low priority
P Last used CPU, Only in many CPU It makes sense in the environment
%CPU Last updated to now CPU Percentage of time used
TIME Used by process CPU Total time , Unit second
TIME+ Used by process CPU Total time , Company 1/100 second
%MEM Percentage of physical memory used by the process
VIRT Total virtual memory used by the process , Company kb.VIRT=SWAP+RES
SWAP The virtual memory used by the process , The size changed out , Company kb
RES Used by process 、 Physical memory size not swapped out , Company kb.RES=CODE+DATA
CODE The size of the physical memory occupied by the executable code , Company kb
DATA Beyond the executable code ( Data segment + Stack ) The amount of physical memory occupied , Company kb
SHR Shared memory size , Company kb
nFLT Number of page errors
nDRT Last write to now , Number of pages modified .
S Process status .D= Uninterrupted sleep R= function S= sleep T= track / stop it Z= Zombie process
COMMAND Command name / Command line
WCHAN If the process is sleeping , The system function name in sleep is displayed
Flags Mission signs
3、 ... and 、 Parameters,
1. -d
If we add -d Parameters , The display is the same as above , It's just that the dynamic refresh time is different .-d The parameter represents the number of seconds to refresh the page , The default is 5 Second . If you want to change it to 10 Seconds to refresh , Then you can :
top -d 102. ?
In the use of top On the dynamic page after the command , If we want to see the sort parameters , We can use ?, It is shown as follows :
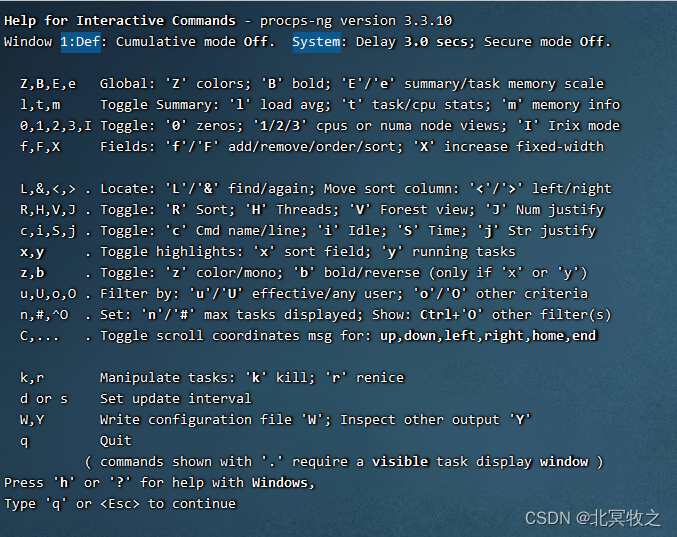
Like the bottom q , It means we are top Display page of command , Press q Then exit the display .
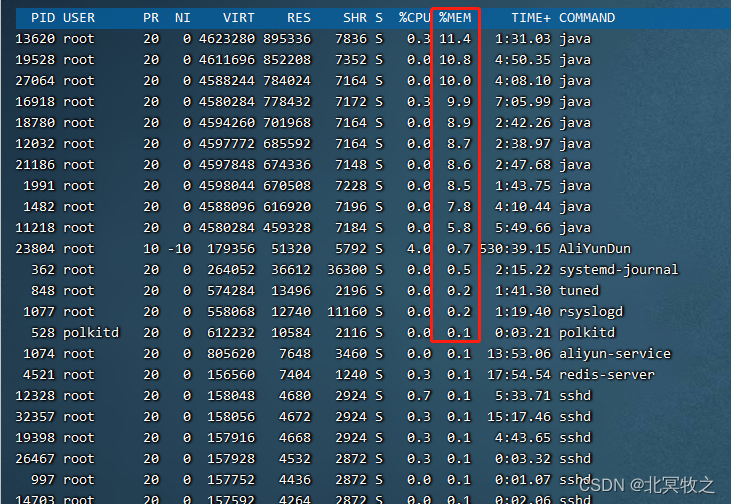
3. M
ditto . stay top Command display page , The default is CPU The load is highly ordered , If we want to sort by memory usage , stay top The display page after the command , We press M( Be case sensitive ):
4. Other commands that can be used to display pages
P In order to CPU The load used is highly ordered .N With pid Order of size .T The cumulative time sequence used by the process .q sign out top command , perhaps Ctrl + only .
5. -p
top -p 12345View the specified pid Resources used :
Reference resources :Linux in top Command parameter details
边栏推荐
- HMS core machine learning service creates a new "sound" state of simultaneous interpreting translation, and AI makes international exchanges smoother
- Five data structures of redis
- Transport layer congestion control - slow start and congestion avoidance, fast retransmission, fast recovery
- scratch疫情隔离和核酸检测模拟 电子学会图形化编程scratch等级考试三级真题和答案解析2022年6月
- kivy教程之在 Kivy 中支持中文以构建跨平台应用程序(教程含源码)
- 重磅硬核 | 一文聊透对象在 JVM 中的内存布局,以及内存对齐和压缩指针的原理及应用
- OpenEuler 会长久吗
- MSF horizontal MSF port forwarding + routing table +socks5+proxychains
- Distill knowledge from the interaction model! China University of science and Technology & meituan proposed virt, which combines the efficiency of the two tower model and the performance of the intera
- Common - magic number 7
猜你喜欢
UDP协议:因性善而简单,难免碰到“城会玩”
Getting started with pytest ----- test case rules

Four processes of program operation
编译原理——自上而下分析与递归下降分析构造(笔记)

關於這次通信故障,我想多說幾句…
Implementation of queue
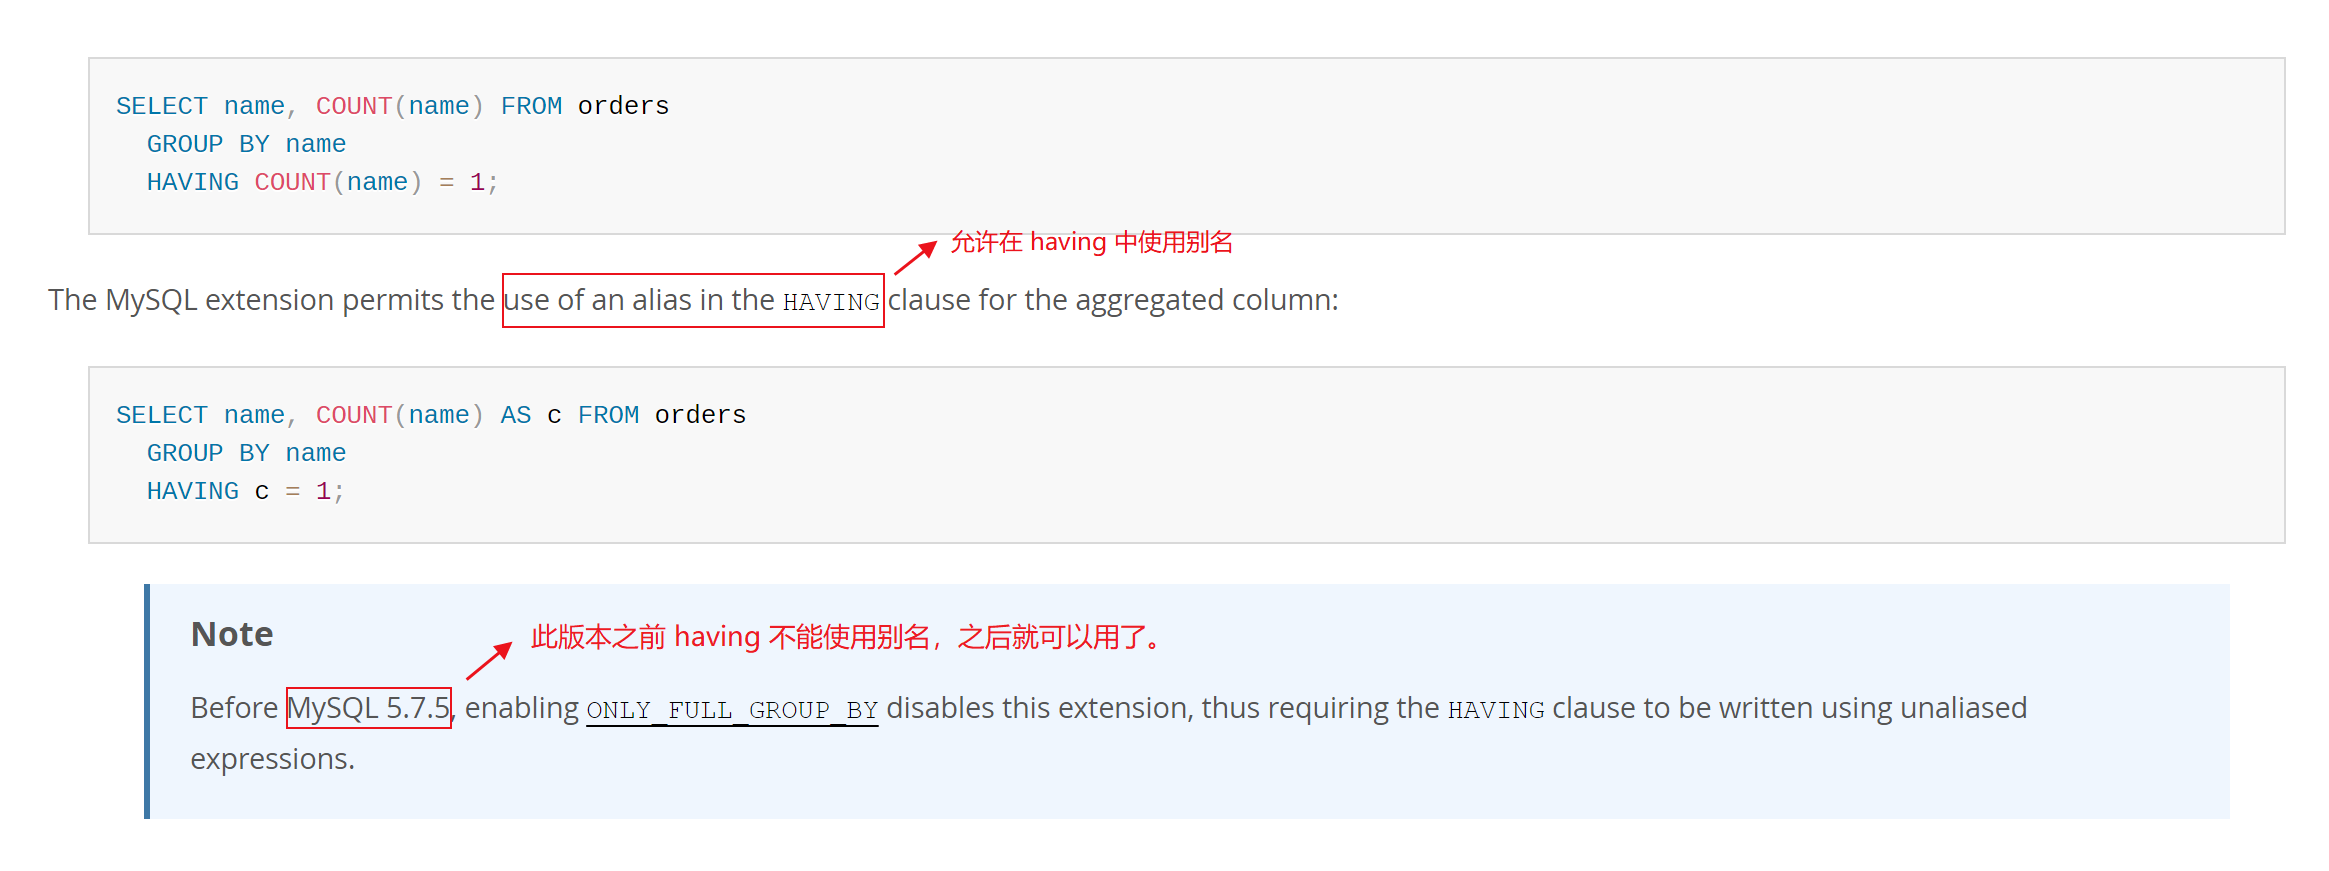
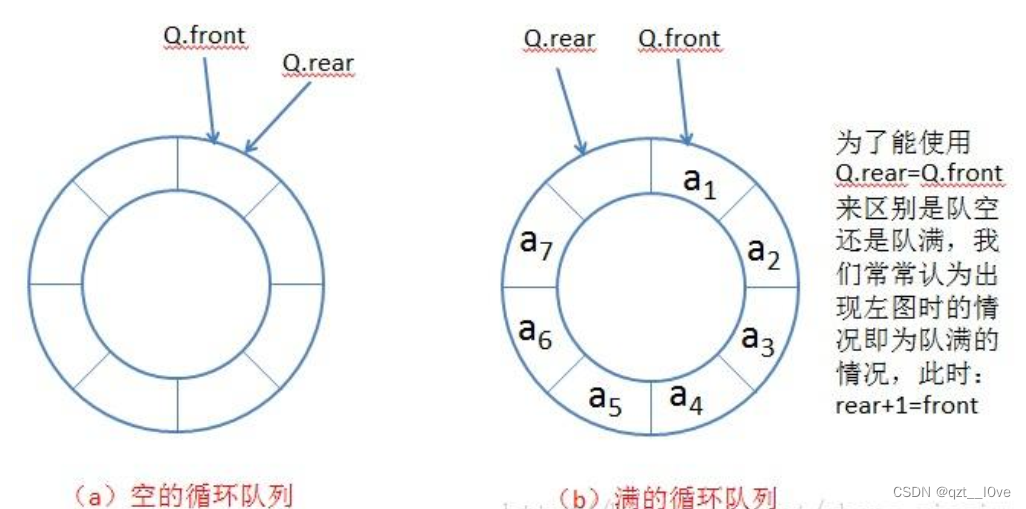
Interview shock 62: what are the precautions for group by?
模板于泛型编程之declval

78 year old professor Huake has been chasing dreams for 40 years, and the domestic database reaches dreams to sprint for IPO
Distill knowledge from the interaction model! China University of science and Technology & meituan proposed virt, which combines the efficiency of the two tower model and the performance of the intera
随机推荐
重磅!蚂蚁开源可信隐私计算框架“隐语”,主流技术灵活组装、开发者友好分层设计...
關於這次通信故障,我想多說幾句…
虚拟机VirtualBox和Vagrant安装
Maixll-Dock 摄像头使用
C语言指针*p++、*(p++)、*++p、*(++p)、(*p)++、++(*p)对比实例
2019阿里集群数据集使用总结
《ASP.NET Core 6框架揭秘》样章发布[200页/5章]
Selected technical experts from China Mobile, ant, SF, and Xingsheng will show you the guarantee of architecture stability
QT中Model-View-Delegate委托代理机制用法介绍
TOP命令详解
Virtual machine VirtualBox and vagrant installation
Jerry's setting currently uses the dial. Switch the dial through this function [chapter]
Interesting - questions about undefined
d绑定函数
Redis的五种数据结构
Implementation of queue
Windows connects redis installed on Linux
Pytest learning ----- detailed explanation of the request for interface automation test
Pytest learning ----- pytest operation mode and pre post packaging of interface automation testing
面试突击62:group by 有哪些注意事项?