当前位置:网站首页>Yygh-11-timing statistics
Yygh-11-timing statistics
2022-07-06 05:40:00 【What about Xiao Zhao】
Medical advice
We pass the scheduled task , Every day 8 Point to perform , Reminder visit
build service-task service
pom The configuration file
<dependencies>
    <dependency>
        <groupId>com.atguigu</groupId>
        <artifactId>rabbit_util</artifactId>
        <version>0.0.1-SNAPSHOT</version>
    </dependency>
</dependencies>
application.properties
#  Service port
server.port=8207
#  service name
spring.application.name=service-task
#  Environment settings :dev、test、prod
spring.profiles.active=dev

# nacos Service address
spring.cloud.nacos.discovery.server-addr=127.0.0.1:8848

#rabbitmq Address
spring.rabbitmq.host=192.168.44.165
spring.rabbitmq.port=5672
spring.rabbitmq.username=guest
spring.rabbitmq.password=guest
stay rabbit-util modular com.atguigu.yygh.common.constant.MqConst Class add
public static final String EXCHANGE_DIRECT_TASK = "exchange.direct.task";
public static final String ROUTING_TASK_8 = "task.8";
// queue
public static final String QUEUE_TASK_8 = "queue.task.8";
Start class
@SpringBootApplication(exclude = DataSourceAutoConfiguration.class)// Cancel data source auto configuration
@EnableDiscoveryClient
public class ServiceTaskApplication {
    public static void main(String[] args) {
        SpringApplication.run(ServiceTaskApplication.class, args);
    }
}
establish service
@Component
@EnableScheduling
@Slf4j
public class ScheduledTask {


    @Autowired
    private RabbitService rabbitService;

    // Execute the method at 8 o'clock every day , Medical advice
    //0 0 8 * * ?
    // Every first 30s Start execution
    @Scheduled(cron = "0 0 8 * * ?")
    public void taskPatient() {

        Date date = new Date();
        SimpleDateFormat sdf = new SimpleDateFormat("yyyy/MM/dd HH:mm");
        log.info(" Scheduled task start execution " + sdf.format(date));
        rabbitService.sendMessage(MqConst.EXCHANGE_DIRECT_TASK, MqConst.ROUTING_TASK_8, "start");
    }
}
order Establish a monitoring module
@Component
@Slf4j
public class OrderReceiver {


    @Autowired
    private OrderService orderService;

    @RabbitListener(bindings = @QueueBinding(
            value = @Queue(value = MqConst.QUEUE_TASK_8, durable = "true"),
            exchange = @Exchange(value = MqConst.EXCHANGE_DIRECT_TASK),
            key = {
    MqConst.ROUTING_TASK_8}
    ))
    public void patientTips(String str) {

        log.info(" Receive the message " + str);
        orderService.patientTips();
    }

}
orderService
@Override
public void patientTips() {

    QueryWrapper<OrderInfo> queryWrapper = new QueryWrapper<>();
    queryWrapper.eq("reserve_date", new DateTime().toString("yyyy-MM-dd"));
    queryWrapper.ne("order_status", OrderStatusEnum.CANCLE.getStatus());
    List<OrderInfo> orderInfos = baseMapper.selectList(queryWrapper);
    for (OrderInfo orderInfo : orderInfos) {

        // Text message prompt
        MsmVo msmVo = new MsmVo();
        msmVo.setPhone(orderInfo.getPatientPhone());
        String reserveDate = new DateTime(orderInfo.getReserveDate()).toString("yyyy-MM-dd") + (orderInfo.getReserveTime() == 0 ? " In the morning " : " Afternoon ");
        Map<String, Object> param = new HashMap<String, Object>() {
    {

            put("title", orderInfo.getHosname() + "|" + orderInfo.getDepname() + "|" + orderInfo.getTitle());
            put("reserveDate", reserveDate);
            put("name", orderInfo.getPatientName());
        }};
        msmVo.setParam(param);
        rabbitService.sendMessage(MqConst.EXCHANGE_DIRECT_MSM, MqConst.ROUTING_MSM_ITEM, msmVo);
    }
}
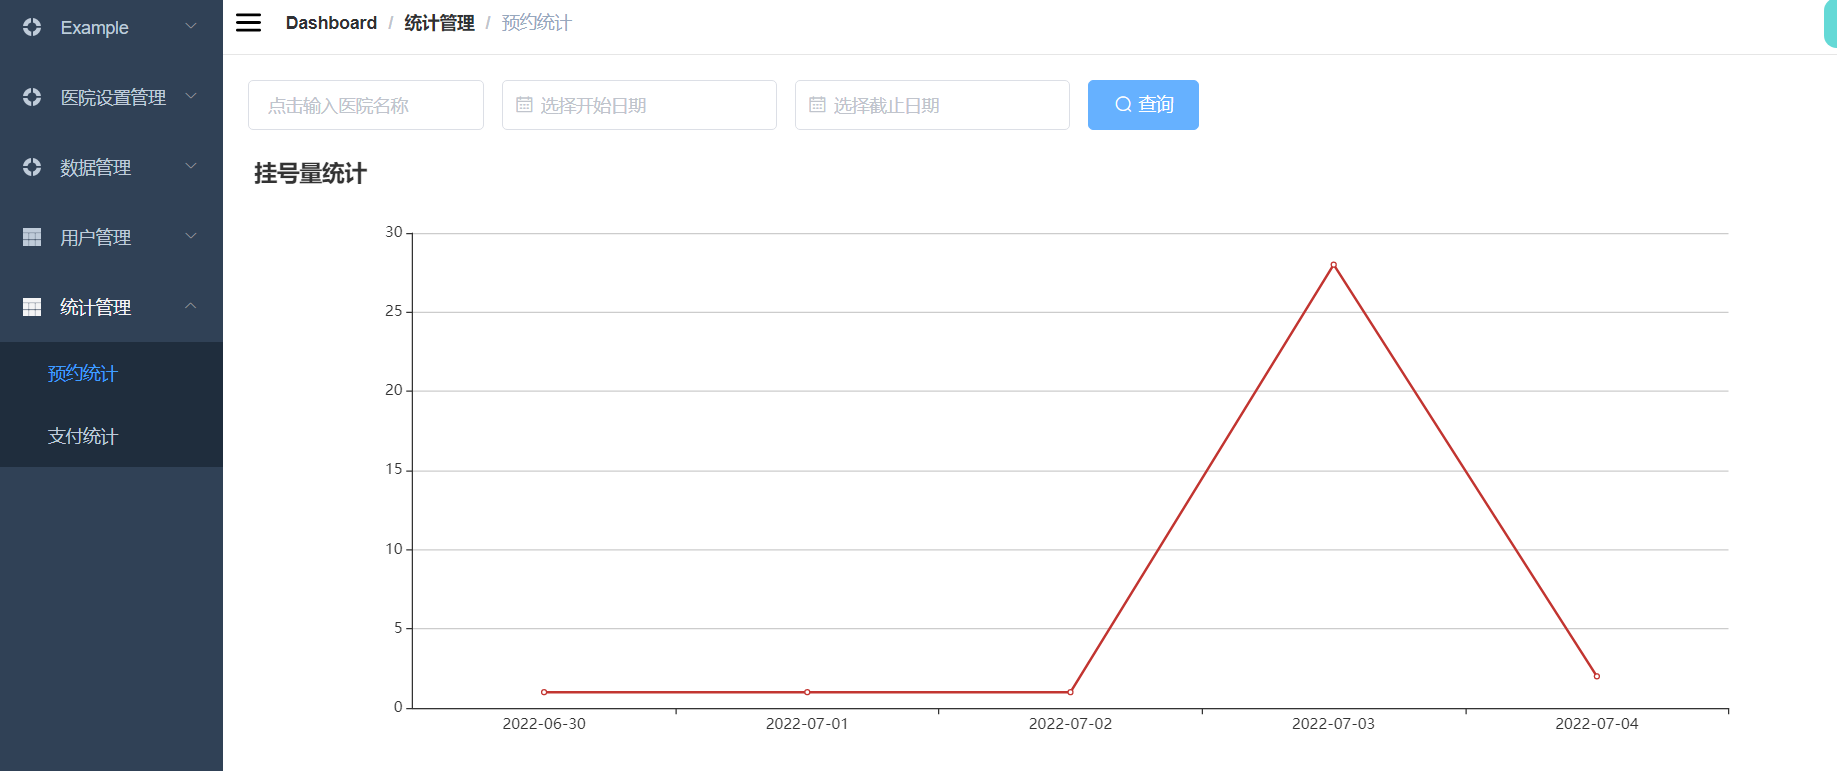
Appointment Statistics
We need to add a line chart showing the number of appointments per day to the management page .
Here we use ECharts To do it
Thought analysis
1. The front end sends a request with query data , To sta modular
2.sta call feign request order modular ,
3.order The module gets the number of appointments per day
Echarts
ECharts It's a Baidu project , Later Baidu put Echart Donated to apache, For chart display , Provides a regular Broken line diagram 、 Histogram 、 Scatter plot 、 The pie chart 、K Line graph , For statistics Box diagram , For geographic data visualization Map 、 Heat map 、 Line graph , For relational data visualization The diagram 、treemap、 Sunrise chart , Multidimensional data visualization Parallel coordinates , Also used BI Of Funnel diagram , The dashboard , And support the mix and match between graphs .
Official website :https://echarts.apache.org/zh/index.html
(1) introduce ECharts
<!--  introduce  ECharts  file  -->
<script src="echarts.min.js"></script>
(2) Define the chart area
<!--  by ECharts Prepare one with size ( Wide and high ) Of Dom -->
<div id="main" style="width: 600px;height:400px;"></div>
(3) Rendering the chart ( Broken line diagram )
<script>
var myChart = echarts.init(document.getElementById('main'));

var option = {

    //x The axis is the category axis ( Discrete data ), Must pass data Set category data

    xAxis: {

        type: 'category',

        data: ['Mon', 'Tue', 'Wed', 'Thu', 'Fri', 'Sat', 'Sun']

    },

    //y The axis is the data axis ( Continuous data )

    yAxis: {

        type: 'value'

    },

    // List of series . Each series passes through  type  Decide your chart type

    series: [{

        // Array of data contents in the series

        data: [820, 932, 901, 934, 1290, 1330, 1320],

        // Broken line diagram

        type: 'line'

    }]

};

myChart.setOption(option);
Project integration EChart
npm install --save [email protected]
Order modular
Add interface Mapper
@Mapper
public interface OrderMapper extends BaseMapper<OrderInfo> {

    List<OrderCountVo> selectOrderCount(@Param("vo") OrderCountQueryVo orderCountQueryVo);

    List<OrderAmountVo> selectOrderAmount(@Param("vo") OrderCountQueryVo orderCountQueryVo);
}
add to mapper.xml
<?xml version="1.0" encoding="UTF-8" ?>
<!DOCTYPE mapper PUBLIC "-//mybatis.org//DTD Mapper 3.0//EN" "http://mybatis.org/dtd/mybatis-3-mapper.dtd">
<mapper namespace="com.example.yygh.order.mapper.OrderMapper">
<!-- Check the number of appointments per day -->
<select id="selectOrderCount" resultType="com.example.yygh.vo.order.OrderCountVo">
select reserve_date as reserveDate, count(reserve_date) as count
from order_info
<where>
<if test="vo.hosname != null and vo.hosname != ''">
and hosname like CONCAT('%',#{vo.hosname},'%')
</if>
<if test="vo.reserveDateBegin != null and vo.reserveDateBegin != ''">
and reserve_date >= #{vo.reserveDateBegin}
</if>
<if test="vo.reserveDateEnd != null and vo.reserveDateEnd != ''">
and reserve_date <= #{vo.reserveDateEnd}
</if>
and is_deleted = 0
</where>
group by reserve_date
order by reserve_date
</select>
<!-- Check the number of appointments per day -->
<select id="selectOrderAmount" resultType="com.example.yygh.vo.order.OrderAmountVo">
select reserve_date as reserveDate, sum(amount) as amount
from order_info
<where>
<if test="vo.hosname != null and vo.hosname != ''">
and hosname like CONCAT('%',#{vo.hosname},'%')
</if>
<if test="vo.reserveDateBegin != null and vo.reserveDateBegin != ''">
and reserve_date >= #{vo.reserveDateBegin}
</if>
<if test="vo.reserveDateEnd != null and vo.reserveDateEnd != ''">
and reserve_date <= #{vo.reserveDateEnd}
</if>
and is_deleted = 0
</where>
group by reserve_date
order by reserve_date
</select>
</mapper>
establish FeignClient
@FeignClient("service-order")
public interface OrderFeignClient {

    /** *  Count the number of appointments per day  * @param orderCountQueryVo * @return */
    @PostMapping("/api/order/orderInfo/inner/getCountMap")
    public Map<String, Object> getCountMap(@RequestBody OrderCountQueryVo orderCountQueryVo);

    /** *  Count the daily registration amount  * @param orderCountQueryVo * @return */
    @PostMapping("/api/order/orderInfo/inner/getAmount")
    public Map<String, Object> getAmunt(@RequestBody OrderCountQueryVo orderCountQueryVo);

}
sta modular
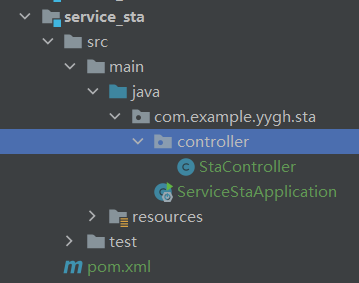
controller
@RestController
@RequestMapping("/admin/sta")
public class StaController {

    @Autowired
    private OrderFeignClient orderFeignClient;

    @ApiOperation(value = " Get order statistics ")
    @GetMapping("getCountMap")
    public Result getCountMap(@ApiParam(name = "orderCountQueryVo", value = " Query object ", required = false) OrderCountQueryVo orderCountQueryVo) {

        return Result.ok(orderFeignClient.getCountMap(orderCountQueryVo));
    }

    @ApiOperation(value = " Get amount statistics ")
    @GetMapping("getAmount")
    public Result getAmount(@ApiParam(name = "orderCountQueryVo", value = " Query object ", required = false) OrderCountQueryVo orderCountQueryVo) {

        return Result.ok(orderFeignClient.getAmunt(orderCountQueryVo));
    }
}
front end
modify src/router/index.js
{

  path: '/statistics',
  component: Layout,
  redirect: '/statistics/order/index',
  name: 'BasesInfo',
  meta: {
     title: ' Statistics management ', icon: 'table' },
  alwaysShow: true,
  children: [
    {

      path: 'order/index',
      name: ' Appointment Statistics ',
      component: () => import('@/views/statistics/order/index'),
      meta: {
     title: ' Appointment Statistics ' }
    },
    {

      path: 'order/pay',
      name: ' Payment statistics ',
      component: () => import('@/views/statistics/order/amount'),
      meta: {
     title: ' Payment statistics ' }
    }
  ]
},
add to src/api/orderStatistics.js
export default {


  getCountMap(searchObj) {

    return request({

      url: `${
    api_name}/getCountMap`,
      method: 'get',
      params: searchObj
    })
  },
  getAmount(searchObj) {

    return request({

      url: `${
    api_name}/getAmount`,
      method: 'get',
      params: searchObj
    })
  }
}
add to src/views/statistics/order/index.vue
<template>
  <div class="app-container">
    <!-- Forms -->
    <el-form :inline="true" class="demo-form-inline">
      <el-form-item>
        <el-input v-model="searchObj.hosname" placeholder=" Click to enter the name of the hospital "/>
      </el-form-item>

      <el-form-item>
        <el-date-picker v-model="searchObj.reserveDateBegin" type="date" placeholder=" Choose a start date " value-format="yyyy-MM-dd"/>
      </el-form-item>
      <el-form-item>
        <el-date-picker v-model="searchObj.reserveDateEnd" type="date" placeholder=" Choose a deadline " value-format="yyyy-MM-dd"/>
      </el-form-item>
      <el-button :disabled="btnDisabled" type="primary" icon="el-icon-search" @click="showChart()"> Inquire about </el-button>
    </el-form>

    <div class="chart-container">
      <div id="chart" ref="chart" class="chart" style="height:500px;width:100%"/>
    </div>
  </div>
</template>

<script> import echarts from 'echarts' import statisticsApi from '@/api/orderStatistics' export default {
       data() {
       return {
       searchObj: {
       hosname: '', reserveDateBegin: '', reserveDateEnd: '' }, btnDisabled: false, chart: null, title: '', xData: [], // x Axis data  yData: [] // y Axis data  } }, methods: {
       //  Initialize chart data  showChart() {
       statisticsApi.getCountMap(this.searchObj).then(response => {
       this.yData = response.data.countList this.xData = response.data.dateList this.setChartData() }) }, setChartData() {
       //  Based on the prepared dom, initialization echarts example  var myChart = echarts.init(document.getElementById('chart')) //  Specify configuration items and data for the chart  var option = {
       title: {
       text: this.title + ' Registration statistics ' }, tooltip: {
      }, legend: {
       data: [this.title] }, xAxis: {
       data: this.xData }, yAxis: {
       minInterval: 1 }, series: [{
       name: this.title, type: 'line', data: this.yData }] } //  Use the configuration item and data display chart just specified . myChart.setOption(option) }, } } </script>
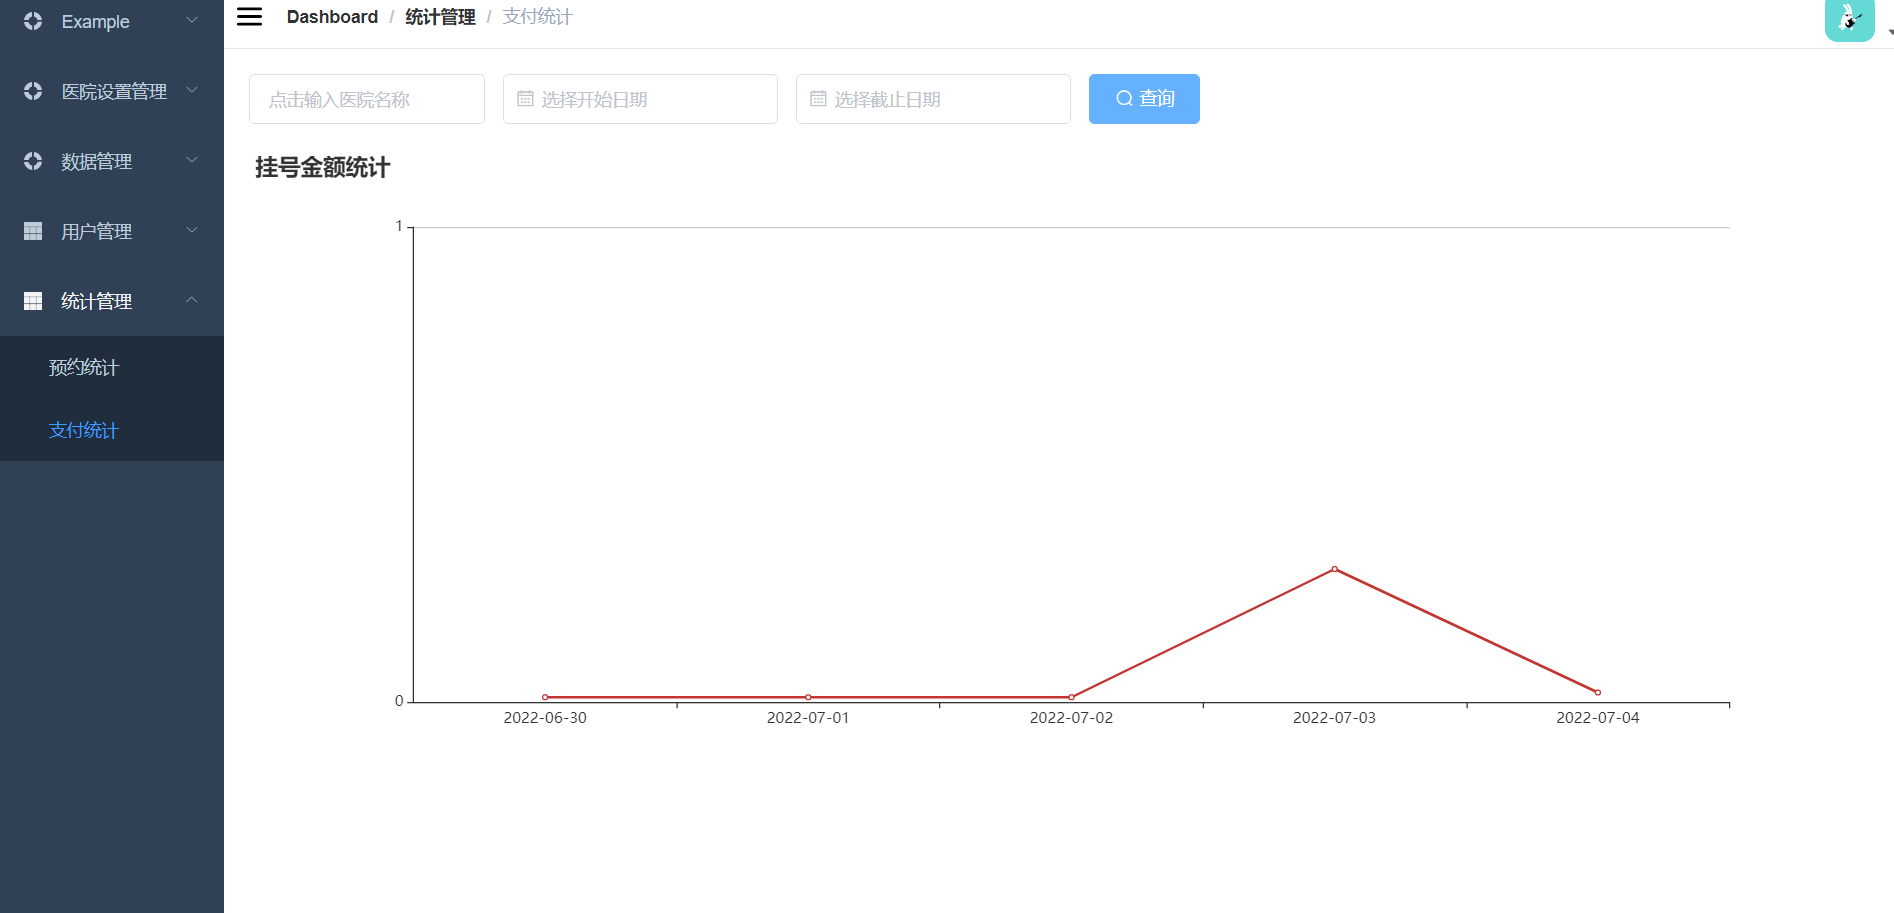
design sketch
边栏推荐
- SQLite add index
- Improve jpopup to realize dynamic control disable
- The ECU of 21 Audi q5l 45tfsi brushes is upgraded to master special adjustment, and the horsepower is safely and stably increased to 305 horsepower
- RustDesk 搭建一个自己的远程桌面中继服务器
- Unity Vector3. Use and calculation principle of reflect
- (column 22) typical column questions of C language: delete the specified letters in the string.
- 26file filter anonymous inner class and lambda optimization
- The ECU of 21 Audi q5l 45tfsi brushes is upgraded to master special adjustment, and the horsepower is safely and stably increased to 305 horsepower
- Cuda11.1 online installation
- Node 之 nvm 下载、安装、使用,以及node 、nrm 的相关使用
猜你喜欢

巨杉数据库再次亮相金交会,共建数字经济新时代

The digital economy has broken through the waves. Is Ltd a Web3.0 website with independent rights and interests?

The ECU of 21 Audi q5l 45tfsi brushes is upgraded to master special adjustment, and the horsepower is safely and stably increased to 305 horsepower
PDK process library installation -csmc
Analysis of grammar elements in turtle Library
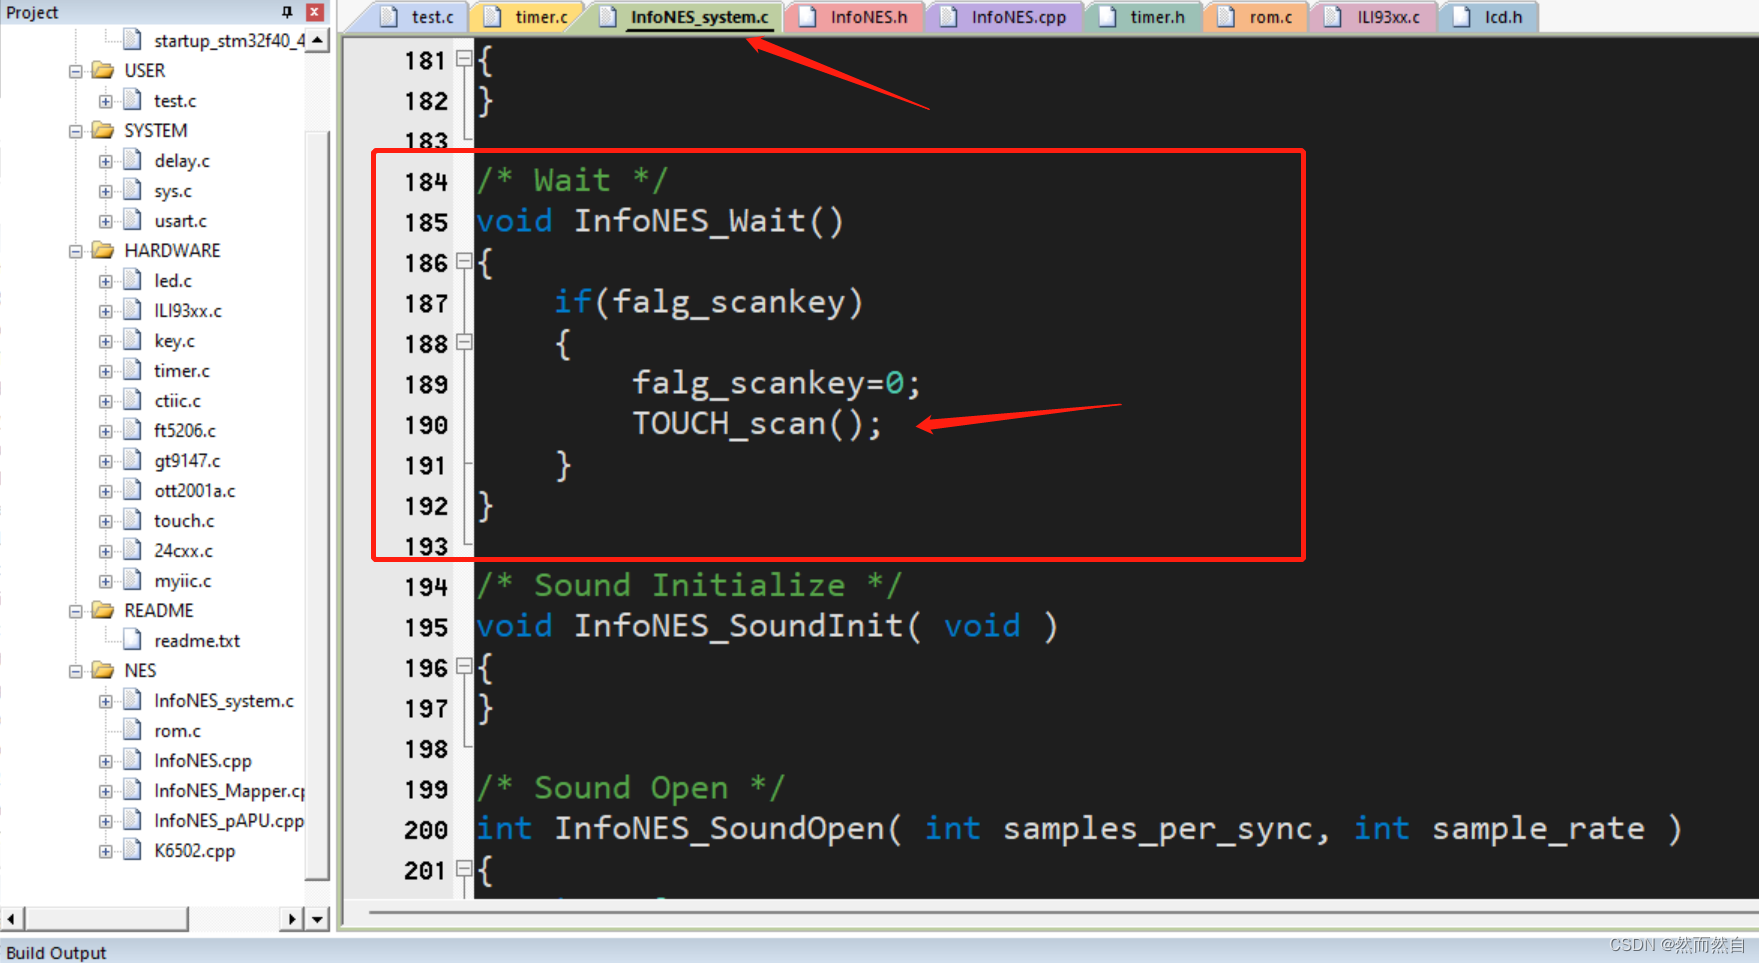
Migrate Infones to stm32
Installation de la Bibliothèque de processus PDK - csmc
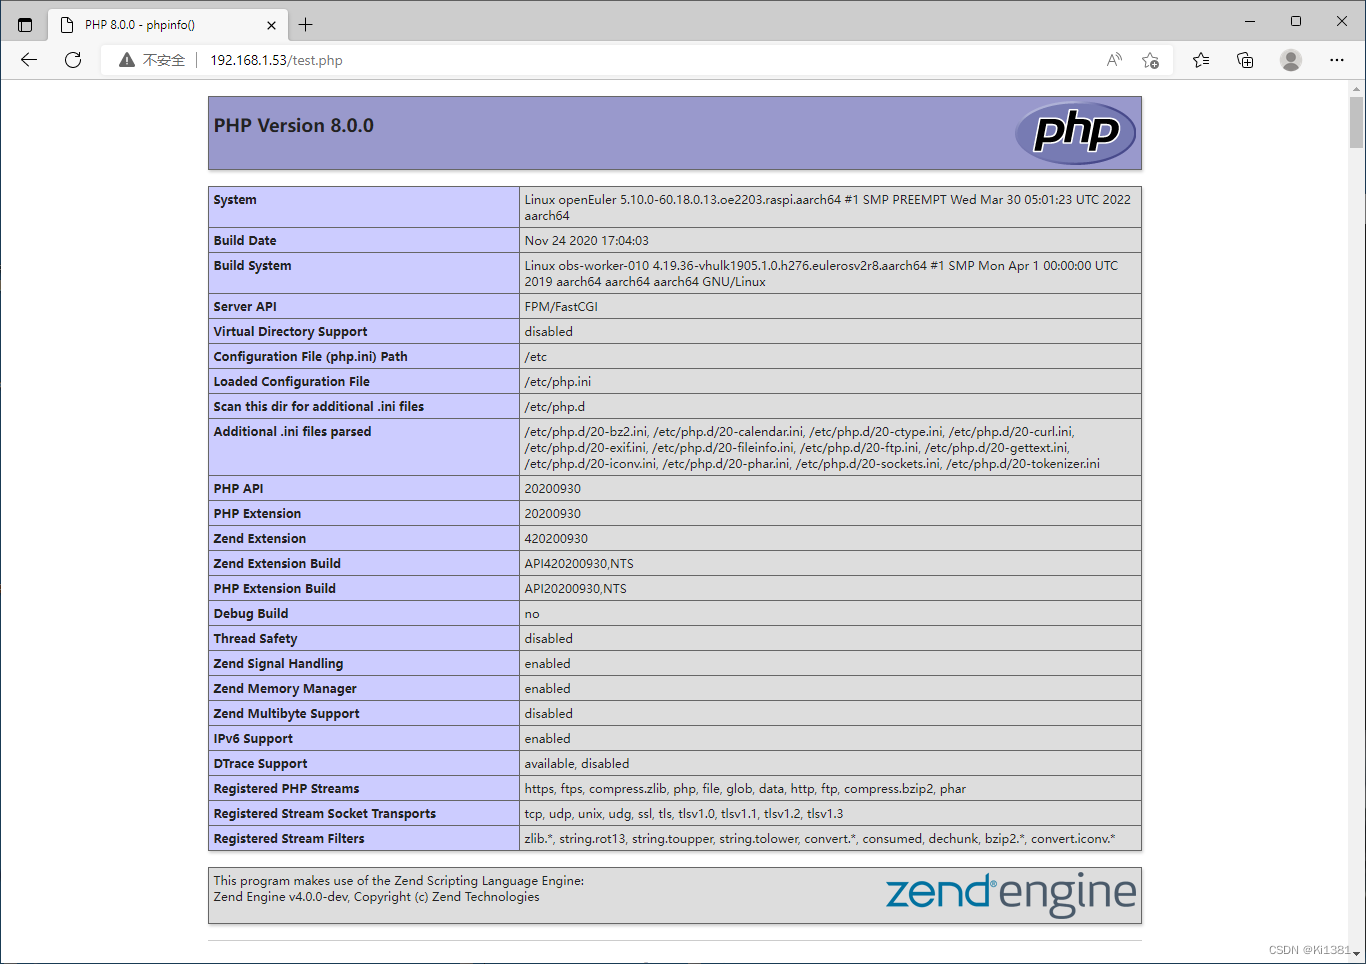 [email protected]树莓派"/>
[email protected]树莓派
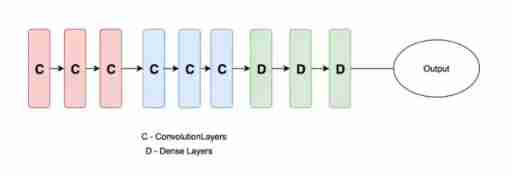
Summary of deep learning tuning tricks

C进阶-数据的存储(上)
随机推荐
Safe mode on Windows
指針經典筆試題
初识CDN
Pointer classic written test questions
Qt TCP 分包粘包的解决方法
SQLite add index
Migrate Infones to stm32
2022半年总结
Web Security (VI) the use of session and the difference between session and cookie
Anti shake and throttling are easy to understand
Sequoiadb Lake warehouse integrated distributed database, June 2022 issue
Selective parameters in MATLAB functions
AUTOSAR从入门到精通番外篇(十)-嵌入式S19文件解析
毕业设计游戏商城
Remember an error in MySQL: the user specified as a definer ('mysql.infoschema '@' localhost ') does not exist
03. Login of development blog project
应用安全系列之三十七:日志注入
移植InfoNES到STM32
The digital economy has broken through the waves. Is Ltd a Web3.0 website with independent rights and interests?
[email protected]树莓派